
North America Pipeline Pigging Services Market Analysis Report, 2024-2032
REPORT DETAILS
Market Statistics
North America Pipeline Pigging Services market size was valued at USD 3,552.30 million in 2023. The market is anticipated to grow from USD 3,736.02 million in 2024 to USD 5,669.39 million by 2032, exhibiting the CAGR of 5.3% during the forecast period.
Industry Trends
The North American market for pipeline pigging services is set to experience steady growth, primarily due to the recent shale revolution, which has spurred a significant increase in the construction of new oil and gas transportation networks. As new supply systems are developed, there will be a heightened market for inline assessment services, including pigging, to underrate pipeline breakdowns. Regulatory management has also implemented policies aimed at lowering spillage and pipeline failures, further boosting the demand for these and ensuring optimal flow efficiency services. For instance, in 2023, the U.S. Pipeline and Hazardous Materials Safety Administration (PHMSA) mandated the periodic inspection and cleaning of pipelines using pigging services. PHMSA has earmarked a $13.5 million increase in pipeline safety operations, specifically targeting the enhancement of safety checks and the reduction of adverse climate and environmental impacts. This strategic investment will enable PHMSA to play a pivotal role in supporting the President's climate change agenda by reducing methane emissions in the oil and gas sector and bolstering oversight of liquefied natural gas (LNG) operations.
Source: Polaris Market Research Analysis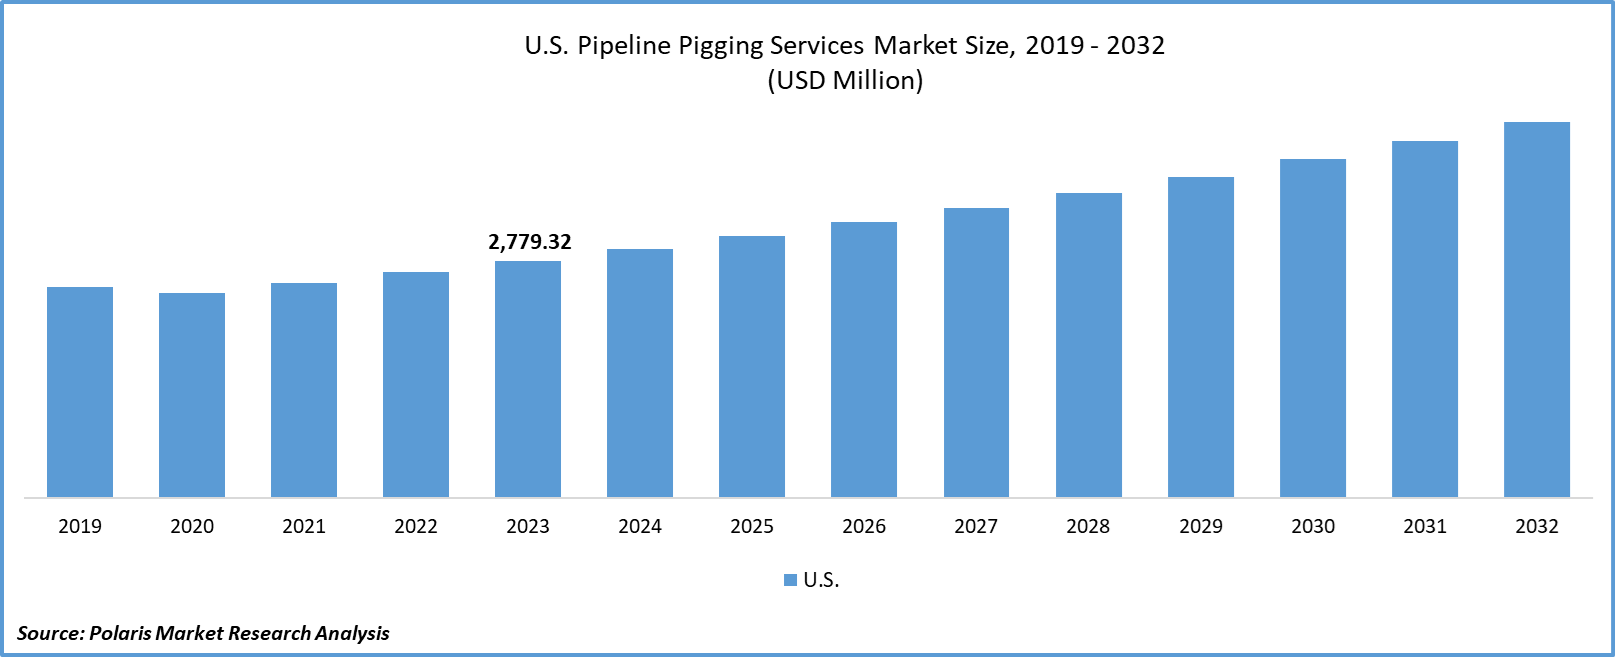
To Understand More About this Research: Download Sample Report
Furthermore, some companies specialize in integrating cutting-edge technologies into existing pigging solutions. They focus on enhancing pigs' capabilities by incorporating advanced sensors, data analytics, and real-time monitoring systems. These integrated solutions provide operators with valuable insights into pipeline conditions and performance, leading to more informed decision-making and proactive maintenance strategies.
For instance, T.D. Williamson, Inc., Mistras Group, Inc, Baker Hughes Company, and American Pipeline Solutions (APS) are the United States-based companies that provide various pipeline pigging services such as Smart Pigging Solution including Advanced Inline Monitoring For Pipelines (i2i Pipelines technology), Eddy Current Technique (ECT), Magnetic Flux Leakage, Conventional Pigging & Swabbing, Smart Pig Pipeline Inspection, Ice Pigging Services, Managing Pipeline Corrosion and Metal Loss, Pipeline Crack Management, Integrated Pigging, and more.
Looking forward, a supportive policy framework coupled with technological advancements will create new opportunities for pipeline-pigging service providers, especially in North America. These factors are poised to fuel regional development and progress in the years ahead.
Key Takeaways
- The U.S. dominated the market with the largest North American pipeline pigging services market share
- By services category, the intelligent pigging segment dominated the North American pipeline pigging services market share
- By application category, the metal loss/corrosion detection segment dominated and is anticipated to grow with a lucrative CAGR over the North American pipeline pigging services market forecast period
What are the market drivers driving the demand for the market?
Rising integration of AI and ML in pipeline pigging services
The integration of AI and ML is driving the expansion of the pipeline pigging services market owing to their capability to accurately and promptly predict the depth of the pipeline while also offering valuable insights to operators. As a result, it enhances the efficiency of pipeline maintenance schedules and boosts asset utilization and overall performance. The implementation of AI-powered pipeline pigging services ensures a higher level of safety for field technicians by enabling early identification and prediction of pipeline pigging problems. This proactive approach aids in preventing pipeline failures and potential leaks and mitigating the risks associated with environmental damage, injuries, and expensive shutdowns.
For instance, in February 2024, Charps invested in the research and development of Houston-based PipeSense; through advanced AI analysis, it will offer customized solutions to tackle pipeline operational issues. This expertise has led to the creation of leak detection technologies and a cutting-edge cloud-based software system. In addition to AI-based pipeline monitoring solutions, PipeSense collaborates with Charps to enhance hydro test monitoring technology and help customers optimize their pipeline monitoring strategies.
Which factor is restraining the demand for the market?
Technical complexity in implementing pigging solutions
The implementation of pigging solutions in North America pipeline pigging services is technically complex due to a variety of factors. Pipeline size, material, and operating conditions all differ, necessitating tailored pigging solutions for optimal performance. Moreover, the integration of pigging technology into existing pipeline infrastructure can be difficult because of compatibility issues and space limitations. Additionally, the use of advanced inspection and cleaning pigs requires specialized equipment and trained personnel. Furthermore, coordinating pigging operations with pipeline maintenance schedules and regulatory requirements adds another level of complexity. In conclusion, effectively addressing these technical challenges requires thorough planning, expertise, and precise execution to ensure the efficiency and safety of pigging activities.
Source: Polaris Market Research Analysis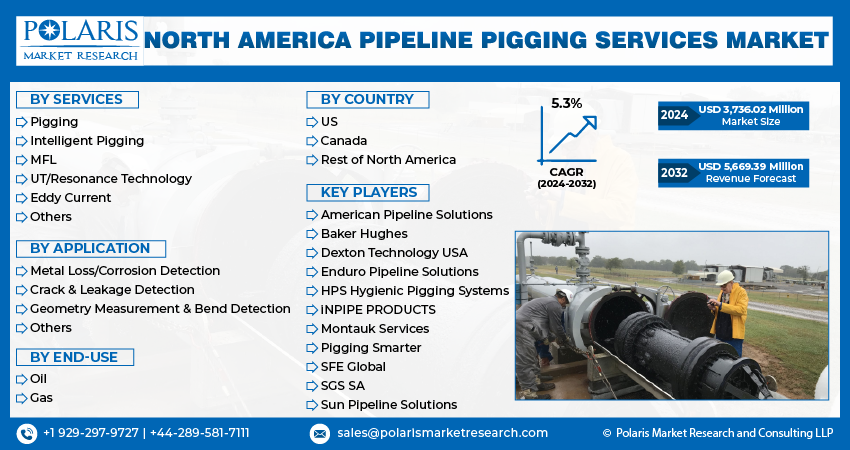
Get Full Segment-Level Forecasts & Insights: Download Sample Report
Report Segmentation
The market is primarily segmented based on services, applications, end-use, and country.
| By Services | By Application | By End-Use | By Country |
|
|
|
|
Source: Polaris Market Research Analysis
To Understand the Scope of this Report: Request Customization
Category Wise Insights
By Services Insights
Based on services analysis, the market is segmented into pigging and intelligent pigging. The pigging segment has dominated North America's Pipeline Pigging Services market. The intelligent pigging services are expected to grow at the fastest CAGR over the forecast period. Intelligent Pigging, which is also referred to as Smart Pigging, is an innovative robotic technique that involves using a specialized Pipeline Integrity Gauge (PIG) unit equipped with several sensors and probes. This technique is used to detect and assess issues such as corrosion, metal loss, cracks, dents, deformations, and more within a pipeline.
The intelligent PIG is equipped with multiple sensors positioned around its circumference to gather data regarding the pipeline's condition. Commonly utilized sensors for inspection purposes include Magnetic Flux Leakage (MFL), Ultrasonic, and Eddy current sensors. Additionally, the PIG incorporates other sensors like Gyro and Odometer to determine the PIG's location and other diagnostic parameters for the sensors and associated electronics. The tool is equipped with a data storage device to retain the information collected by the sensors for subsequent processing and analysis.
By Application Insights
Based on application analysis, the market has been segmented into metal loss/corrosion detection, crack & leakage detection, geometry measurement & bend detection, and others. The metal loss/corrosion detection segment has dominated the market and is anticipated to grow at the fastest CAGR over the forecast period. The dominance of the metal loss/corrosion detection segment is owing to the region's vast network of aging pipelines, especially in the oil and gas industry. As pipeline integrity and safety regulations gain more attention, there is an increased need for technologies that can accurately identify and monitor corrosion-related problems. By utilizing metal loss detection methods, operators can gain valuable insights into the condition of pipelines, enabling them to take proactive measures against corrosion threats and avoid expensive incidents. Consequently, the metal loss/corrosion detection segment plays a crucial role in ensuring the durability and longevity of North America's pipeline infrastructure.
Source: Polaris Market Research Analysis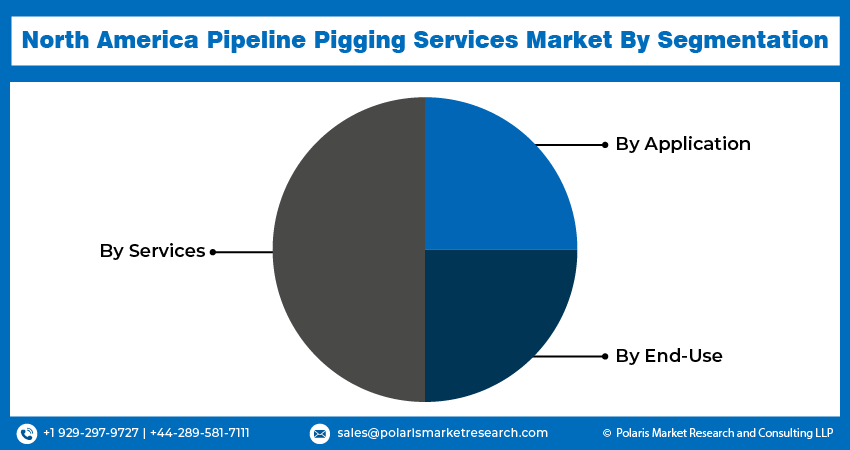
Need Granular Data Across All Market Segments? Request Customization
Country-wise Insights
The U.S.
The U.S. leads the pipeline-pigging market in North America. Owing to ongoing infrastructure expansion projects and the need to upgrade aging pipelines, there is a continuous demand for pipeline-pigging services to ensure the integrity and efficiency of these systems. Technological advancements in pigging, such as the development of intelligent pigs provided with data analytics and sensor capabilities, have enhanced the effectiveness and accuracy of pipeline inspections. This has increased the demand for advanced pigging services that offer comprehensive insights into pipeline conditions and performance.
In February 2024, Dexon Technology USA Inc., a provider of pipeline integrity and intelligent pigging solutions, is thrilled to announce its participation in the 36th annual Pipeline Integrity and Pigging Management Conference, scheduled from February 12th to 16th, 2024, in Houston, Texas to bring Dexon's extensive history of innovation and expertise to the U.S. and Canadian markets to leverage advanced intelligent pigging technologies, the company delivers comprehensive integrity solutions to identify and manage corrosion and cracks with exceptional precision and accuracy while offering data-driven insights for optimized maintenance and reduced downtime.
Competitive Landscape
The competitive landscape for the North America pipeline pigging services market consists of a combination of well-established companies and emerging niche providers. The larger companies utilize their extensive experience and technological expertise to offer comprehensive pigging solutions that encompass inspection, cleaning, and maintenance services along with innovative technologies, allowing them to gain maximum market shares. Strict regulatory requirements further intensify the competition in this industry, compelling companies to differentiate themselves through advanced technologies, cost-effectiveness, and environmental sustainability.
Some of the major players operating in the North American market include:
- American Pipeline Solutions
- Baker Hughes
- Dexton Technology USA
- Enduro Pipeline Solutions
- HPS Hygienic Pigging Systems
- iNPIPE PRODUCTS
- Montauk Services
- Pigging Smarter
- SFE Global
- SGS SA
- Sun Pipeline Solutions
Recent Developments
- In August 2022, Baker Hughes announced its plan to acquire Quest Integrity, a subsidiary of Team, Inc. Quest Integrity is a global provider of advanced asset inspection and reliability management solutions technology. The company specializes in serving various sectors such as pipeline, refining, petrochemical, and power generation.
- In March 2022, Baker Hughes announced the acquisition of Qi2 Elements, a designer and manufacturer of advanced robotic sensor systems that inspect, assess, and monitor the integrity of critical energy infrastructure. The acquisition complements Baker Hughes’ existing capability in gas pipeline inspection.
Report Coverage
The North America Pipeline Pigging Services market report emphasizes key countries across the region to provide a better understanding of the product to the users. Also, the report provides market insights into recent developments, trends and analyzes the technologies that are gaining traction around the region. Furthermore, the report covers an in-depth qualitative analysis pertaining to various paradigm shifts associated with the transformation of these solutions.
The report provides a detailed analysis of the market while focusing on various key aspects, such as competitive analysis, services, applications, end-uses, and their futuristic growth opportunities.
North America Pipeline Pigging Services Market Report Scope
| Report Attributes | Details |
| Market size value in 2024 | USD 3,736.02 million |
| Revenue Forecast in 2032 | USD 5,669.39 million |
| CAGR | 5.3% from 2024 – 2032 |
| Base year | 2023 |
| Historical data | 2019 – 2022 |
| Forecast period | 2024 – 2032 |
| Quantitative units | Revenue in USD million and CAGR from 2024 to 2032 |
| Segments Covered | By Services, By Application, By End-Use, By Country |
| Regional scope | US, Canada, Rest of North America |
| Customization | Report customization as per your requirements with respect to countries, regions, and segmentation. |
Source: Polaris Market Research Analysis
North America Pipeline Pigging Services Market FAQ's
The North America Pipeline Pigging Services Market report covering key segments are services, applications, end-use, and country.
North America Pipeline Pigging Services Market Size Worth USD 5,669.39 Million by 2032
North America Pipeline Pigging Services market exhibiting the CAGR of 5.3% during the forecast period.
key driving factors in North America Pipeline Pigging Services Market are Rising integration of AI and ML in pipeline pigging services
Download Sample Report of North America Pipeline Pigging Services Market Analysis Report, 2024-2032
Please fill out the form to request a customized copy of the research report.
