
Quantum Dot Market Size, Share & Forecast Report, 2025-2034
REPORT DETAILS
Market Statistics
Market Overview
Quantum dot market size was valued at USD 10.09 billion in 2024. The market is anticipated to grow from USD 11.87 billion in 2025 to USD 53.16 billion by 2034, exhibiting a CAGR of 18.1% during the forecast period.
The quantum dots market involves the production and application of nanoscale semiconductor particles that emit light when excited. These materials are used in various industries, including electronics, display technology, and biomedical applications, due to their unique optical and electronic properties.
Advancements in display technology, with enhanced quality, color accuracy, energy efficiency, and imaging capabilities, are expected to drive the quantum dots market growth during the forecast period. Additionally, innovations in quantum computing, including D-Wave systems and cloud-based quantum services, offer numerous advantages, such as improved encryption, optimized logistics, and advancements in materials science. These technologies are also revolutionizing artificial intelligence by enabling the rapid solving of complex problems. As a result, the integration of quantum dots in displays and computing systems is expected to drive quantum dots market growth during forecast period.
Source: Polaris Market Research Analysis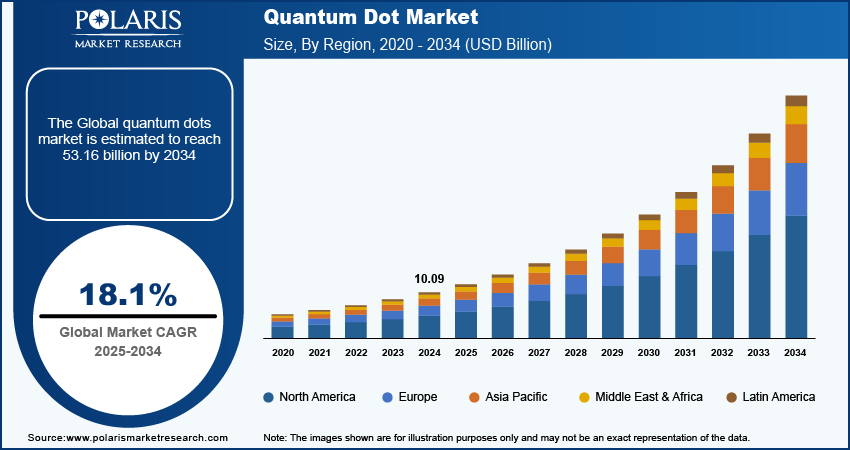
To Understand More About this Research: Download Sample Report
The advancement of silicon quantum dot technology by key industry players is significantly driving the growth of the quantum dot market. For instance, Diraq's, in March 2024, enabled quantum computers to operate at higher temperatures. This innovation not only enhances computational power but also reduces manufacturing costs and improves energy efficiency. Such developments represent a crucial step toward scaling up quantum computing technology, making it more accessible and economically viable, thereby fueling quantum dots market expansion.
Growth Drivers
Growing Demand for High-Quality Device Display
Increasing demand for high-quality displays in a wide range of devices is boosting quantum dots market growth during the study period. Quantum dots have gained significant popularity in display technology due to their exceptional advantages in enhancing visual quality. Their ability to deliver higher brightness levels, improved contrast ratios, and a wider color gamut makes them particularly appealing to consumers who prioritize premium display experiences, including high dynamic range (HDR) content. This growing consumer preference for superior display quality is fueling the quantum dot market growth as manufacturers increasingly adopt this technology to meet the demand for vibrant, lifelike visuals in televisions, monitors, and other devices.
For instance, in December 2023, LG announced quantum dot technology based on QNED and QNED Mini LED television, which contains a variety of screen sizes, including an option for 98 inches, providing better picture quality, more advanced AI processing as well as customization features.
Integration Of Quantum Dot Technology into Solar Panel
The integration of quantum dot technology into solar panels is a significant driver of the quantum dot market growth during the forecast period. By enabling the absorption of a broader spectrum of sunlight, quantum dots enhance the efficiency of solar panels, allowing for more effective conversion of sunlight into electricity. As demand for renewable energy solutions grows, particularly in the solar sector, the need for efficient and cost-effective solar technologies has surged. This increased focus on sustainable energy sources is propelling the adoption of quantum dot technology, leading to the growth of quantum dots market
Restraining Factors
Regulatory Hurdles
The quantum dot market faces significant challenges due to regulatory barriers. Materials like cadmium pose health risks and environmental hazards, leading to heightened scrutiny from government and regulatory bodies. Stringent regulations regarding the use, disposal, and recycling of these toxic substances can restrict market growth and increase compliance costs for manufacturers.
Source: Polaris Market Research Analysis
Get Full Segment-Level Forecasts & Insights: Download Sample Report
Report Segmentation
The Quantum Dot Market is primarily segmented based on type, application, product, and region.
By Type Analysis
The II-VI semiconductors segment accounted for the largest market share in 2024
The II-VI semiconductors segment held the largest revenue share in the quantum dot market. This dominance is primarily due to its various application uses such as non-linear optics, solar cells, quantum computing, spintronics, telecommunications, and biomedical applications owing to their unique optical properties. Tunable optoelectronic properties, high efficiency in solar cells, low toxicity, adjustable bandgap, solution processability, and stability, make III-VI semiconductor quantum dots suitable for several applications in optoelectronics, renewable energy, and biomedical fields.
The III-V-semiconductors segment is projected to grow at healthy CAGR during the projected period in the quantum dot market, owing to its use in quantum computers and high-performance sensors. Moreover, market players are actively engaged with research and development to cut costs and increase production scalability further enhancing their adoption rates and market expansion in the future.
By Product Analysis
The medical devices segment is expected to witness the highest growth during the forecast period.
The medical devices segment is projected to grow at a highest CAGR during the projected period in the quantum dot market. Quantum dots have exceptional optical characteristics which enable them well-suited for advanced medical imaging, diagnostics as well as targeted drug delivery. Increased focus on the early identification of diseases including personalized treatment have spurred the acceptance of quantum dot point technology within the medical field.
The displays segment garnered the largest revenue share in the quantum dot market. This is due to its applications in QLED TVs, monitors, and smartphones. Its ability to increase the quality of colors, energy efficiency, and brightness creates opportunities in screen displays.
Source: Polaris Market Research Analysis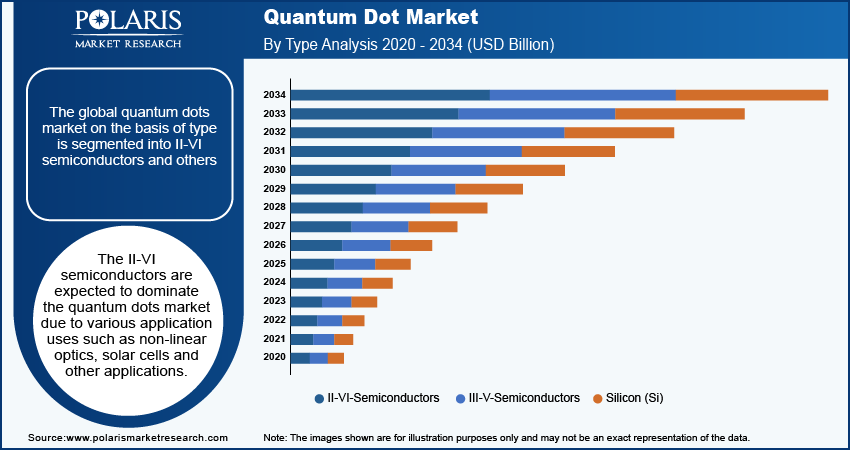
Need Granular Data Across All Market Segments? Request Customization
Regional Insights
The Asia-Pacific region registered the largest share of the global quantum dot market in 2024
The Asia-Pacific region held the dominant share in the quantum dot market. This is due to the increasing rapid population led to the demand for consumer electronics, a strong manufacturing base, and strong economic growth in the emerging South Asian nations. Furthermore, ongoing research on quantum dots for solar modules to improve efficiency further boosts the quantum dot market in the region.
The North American region will grow rapidly in the quantum dot market during forecast period, owing to the increasing investment in quantum dot technology-based projects, and its application in healthcare, consumer electronics, and lasers increase the demand of the quantum dot and regional market growth during forecast period.
Source: Polaris Market Research Analysis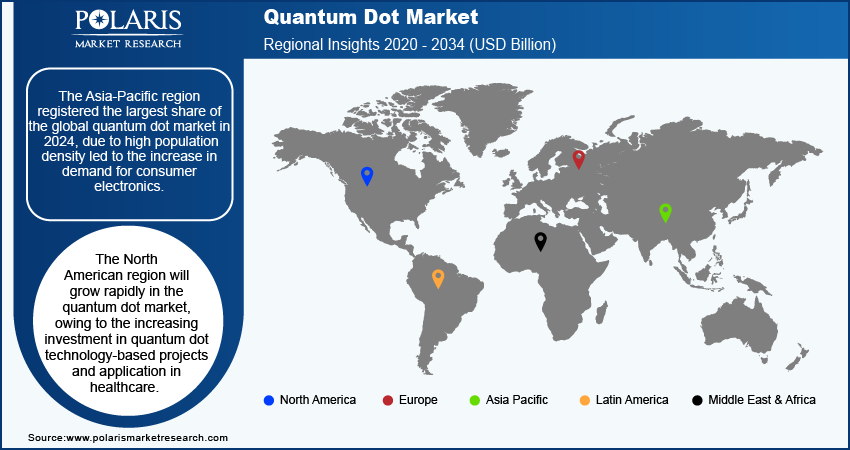
Curious About Regional Market Performance? Request Customization
Key Market Players & Competitive Insights
The quantum dot market is fragmented. The growing investments in new quantum dot technology impacting the global market. The ongoing expansion initiatives, including partnerships, and collaborations, fueling competition in the market. For instance, in February 2024, On the Merck Sigma-Aldrich platform, new quantum dot (QD) products were launched by the Quantum Science to widen the range of infrared PbS and lead-free INFIQ QDs to researchers.
Some of the major players
- Nanosys Inc.
- NnCrystal US Corporation (NN-Labs)
- Quantum Materials Corporation
- UbiQD Inc.
- Ocean NanoTech
- Nanoco Group PLC
- NanoOptical Materials Inc.
- Merck KGaA
- Quantum Solutions Inc.
Recent Developments in the Industry
- May 2025: Nanoco and POE (Guangdong Poly Optoelectronics Co., Ltd.) entered into a Licensing and Collaboration agreement. Through this agreement, Nanoco and POE partnered to develop cadmium-free quantum dot products for multiple applications, including advanced lighting films and display technologies.
- April 2025: Nanoco announced a joint development agreement (JDA) with a new Asian chemical partner. The company develops advanced materials used in TV screens, monitors, medical imaging, and early cancer diagnostics. This collaboration reinforces Nanoco’s role in the rapidly evolving quantum dot market while enhancing its global reach and long-term financial prospects.
- April 2025: UbiQD raised USD 20 million in Series B funding to advance quantum dot technology across various industries. The company stated the proceeds would be used to scale manufacturing, expand R&D capabilities, strengthen intellectual property, enhance marketing initiatives, and support working capital needs.
- May 2024: UbiQD, Inc., a quantum dot (QD) company, raised USD 615,000 from the New Mexico Economic Development Department (NMEDD). This funding aims to improve the products & services of the company.
- January 2024: LG launched the QNED 83 series a combination of quantum dot technology & NanoCell technology LED TVs, in India. LG QNED 83 series has better picture quality, a 120Hz refresh rate display with Dolby Vision support, and AI super upscaling for a better viewing experience.
Quantum Dots Market Segmentation
By Type Outlook (USD Billion, 2020 - 2034)
- III-V-Semiconductors
- II-VI-Semiconductors
- Silicon (Si)
By Product Outlook (USD Billion, 2020 - 2034)
- Displays
- Lasers
- Solar Cells/Modules
- Medical Devices
- Photodetectors/Sensors
- LED Products
- Others
By Application Outlook (USD Billion, 2020 - 2034)
- Optoelectronics and Optical Components
- Medicine
- Agriculture
- Alternative Energy
- Other Applications
By Regional Outlook (USD Billion, 2020 - 2034)
-
North America
- US
- Canada
- Europe
- Germany
- France
- UK
- Italy
- Spain
- Netherlands
- Russia
- Rest of Europe
- Asia-Pacific
- China
- Japan
- India
- Malaysia
- South Korea
- Indonesia
- Australia
- Rest of Asia-Pacific
- Middle East & Africa
- Saudi Arabia
- UAE
- Israel
- South Africa
- Rest of Middle East & Africa
- Latin America
- Mexico
- Brazil
- Argentina
- Rest of Latin America
Report Coverage
The quantum dot market report emphasizes key regions across the globe to provide a better understanding of the product to the users. Also, the report provides market insights into recent developments, and trends and analyzes the technologies that are gaining traction around the globe. Furthermore, the report covers an in-depth qualitative analysis pertaining to various paradigm shifts associated with the transformation of these solutions.
The report provides a detailed analysis of the market while focusing on various key aspects such as competitive analysis, product & services, type, platform, application, end-user, and their futuristic growth opportunities.
Quantum Dot Market Report Scope
| Report Attributes | Details |
| Market size value in 2025 | USD 11.87 billion |
| Revenue Forecast in 2034 | USD 53.16 billion |
| CAGR | 18.1% from 2025 – 2034 |
| Base year | 2024 |
| Historical data | 2020– 2023 |
| Forecast period | 2025 – 2034 |
| Quantitative units | Revenue in USD billion and CAGR from 2025 to 2034 |
| Segments Covered |
|
| Regional scope |
|
| Competitive Landscape |
|
| Report Format |
|
| Customization | Report customization as per your requirements with respect to countries, regions, and segmentation. |
Source: Polaris Market Research Analysis
Quantum Dot Market FAQ's
The Quantum Dots Market size was valued at USD 10.09 billion in 2024 and is projected to grow to USD 53.16 billion by 2034.
The global market is projected to grow at a CAGR of 18.1% during the forecast period, 2025-2034.
Asia Pacific had the largest share in the global market
The key players in the market are Nanosys Inc., NnCrystal US Corporation (NN-Labs), Quantum Materials Corporation, UbiQD Inc., Ocean NanoTech, Nanoco Group PLC, NanoOptical Materials Inc., Merck KGaA and Quantum Solutions Inc.
The II-VI semiconductors segment is anticipated to experience substantial growth with a significant CAGR in the global market. This growth is due to wide range of application
The medical devices segment accounted for the largest revenue share of the market in 2024. Quantum dots have exceptional optical characteristics which enable them well-suited for advanced medical imaging and other medical applications.
Download Sample Report of Quantum Dot Market
Please fill out the form to request a customized copy of the research report.
