

Market Overview
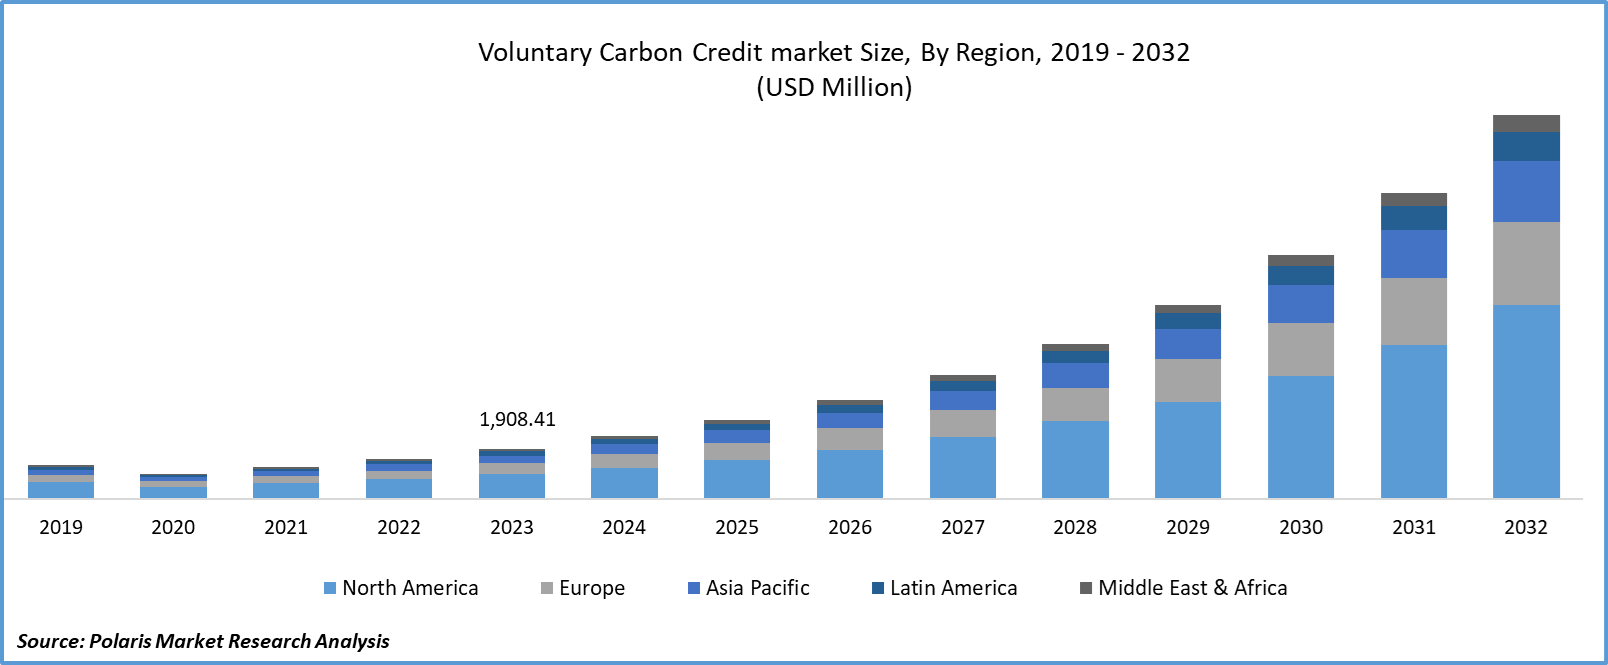
Global voluntary carbon credit market size was valued at USD 2,419.30 million in 2024. The industry is projected to exhibit a compound annual growth rate (CAGR) of 25.6% during the forecast period (2025 - 2034). The growth is driven by technological advancement, and rising demand for carbon offset projects.
Key Insights
- The power segment dominated in 2024 due to critical role in reducing greenhouse gas emissions.
- The avoidance/reduction projects segment is expected to witness fastest growth during the forecast period due to well-established methodologies and verification processes.
- North America dominated with largest share in 2024 due to well-developed financial markets and trading platforms facilitating the buying and selling of carbon credits.
- Asia Pacific is projected to accounted for a significant share in the global market due to growing awareness and commitment to CSR initiatives.
Industry Dynamics
- The rising technological advancements is fueling the growth.
- The rising demand for carbon offset projects and related credits is driving the growth.
- The increase in investment is boosting the growth.
- Lack of standardization and concerns over the integrity and transparency of carbon offset projects is limiting the growth.
Market Statistics
- 2024 Market Size: USD 2,419.30 Million
- 2034 Projected Market Size: USD 23,573.20 Million
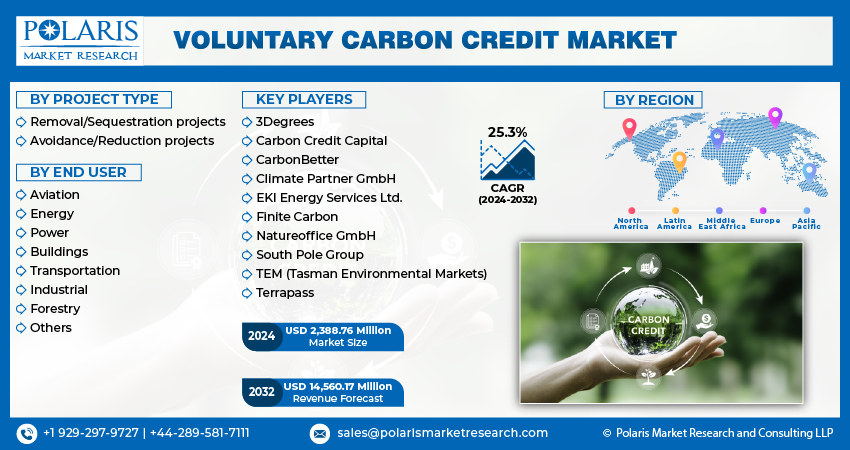
- CAGR (2025-2034): 25.6%
- Largest Market: North America
To Understand More About this Research: Request a Free Sample Report
The voluntary carbon credit market is experiencing robust growth driven by several companies setting ambitious targets to achieve net-zero emissions. Purchasing carbon credits is a practical way to offset unavoidable emissions, thus boosting voluntary carbon credit market growth. Additionally, due to growing consumer preference for environmentally responsible products and brands, companies are responding by investing in carbon credits to enhance their green credentials.
Voluntary carbon credit allows businesses, organizations, and individuals to offset their carbon emissions by purchasing carbon credits from projects that reduce or remove greenhouse gases from the atmosphere. Unlike mandatory carbon markets, which governments regulate, the voluntary market operates on a discretionary basis, driven by the need to take proactive climate action and demonstrate environmental responsibility.
The growing interest in a diverse range of projects beyond traditional reforestation and renewable energy, including carbon capture and storage (CCS), soil carbon sequestration, and blue carbon projects (coastal and marine ecosystems), is driving the market growthAlso, advancements in monitoring, reporting, and verification technologies enhance the accuracy and transparency of carbon credits, boosting voluntary carbon credit market.
What Factors are Driving the Industry Growth?
Rising Technological Advancements: Market CAGR for voluntary carbon credits is being driven by technological advancements that enhance the accuracy and transparency of carbon credit projects, making it easier to verify and trust the carbon reductions claimed. The development of online marketplaces and exchanges facilitates the buying, selling, and trading of carbon credits, increasing market accessibility. Interest is growing in offset credits from engineered reduction technologies such as carbon capture and storage (CCS), direct air capture (DAC), and BECCS (bioenergy with carbon capture and storage). These technologies are currently less common due to their complexity and higher cost, but they are increasingly seen as crucial by large companies aiming to meet ambitious climate goals. Carbon financing is evolving, and as these technologies expand, their role in the voluntary carbon market is expected to grow significantly.
Rising Demand for Carbon Offset Projects and Related Credits: The rising demand for carbon offset projects and related credits is a significant growth driver for the voluntary carbon credit market. This demand is driven by various factors, including corporate sustainability goals, consumer preferences, regulatory pressures, and the broader push to address climate change. Many companies are committing to ambitious sustainability targets, including achieving net-zero emissions by specific dates. Offsetting unavoidable emissions through the purchase of carbon credits is a crucial strategy for meeting these targets. Corporations are increasingly aware that demonstrating environmental responsibility enhances their brand value and reputation. Investing in carbon offset projects allows them to showcase their commitment to sustainability, which attracts customers, investors, and partners. Some companies voluntarily exceed existing regulations to establish themselves as industry leaders in climate action. This proactive approach includes investing in high-quality carbon offset projects. Also, introducing new policy guidelines are aimed at fostering a robust and significant market growth. For instance, in 2024, the US government released new policy guidelines for the voluntary carbon credit market. The new guidelines aim to enhance and advance the market by establishing standards that ensure the high integrity of voluntary carbon markets (VCMs). They were introduced in response to the surging demand for carbon offset projects and related credits, driven primarily by enterprises seeking net-zero goals and utilizing offsets to complete their emissions reduction endeavors or to balance unavoidable emissions. Furthermore, the development of new and diverse carbon offset projects, such as blue carbon (coastal and marine ecosystems) and soil carbon sequestration, expands the range of options available for buyers. This variety attracts more participants to the market and drives the voluntary carbon credit market revenue.
Which Segment by Project Type is Exopected to Witness Fastest Growth?
The avoidance/reduction projects segment is expected to witness the fastest market during the forecast period due to well-established methodologies and verification processes, making them more accessible and easier to implement. These projects have a longer track record and are widely recognized for their effectiveness in reducing emissions. Many avoidance/reduction projects, such as renewable energy installations and energy efficiency improvements, often have lower upfront costs compared to advanced removal technologies. This cost efficiency enhances their attractiveness in the voluntary carbon credit market, driving adoption and contributing to sustainable development goals globally.
Why Power Segment Dominated in 2024?
The power segment dominated with largest share in 2024, emphasizing the critical role of renewable energy in reducing greenhouse gas emissions. Projects such as wind, solar, and hydropower effectively replace fossil fuels, leading to significant carbon credits. Companies with ambitious sustainability goals, like transitioning to 100% renewable energy, find it essential to purchase these credits to meet their environmental targets and support global emission reduction initiatives. Further, many corporations have set ambitious sustainability targets, including commitments to 100% renewable energy. Purchasing carbon credits from renewable energy projects helps companies meet these goals. For example, the RE100 initiative, where influential companies commit to use 100% renewable energy, has driven significant demand for renewable energy credits.
What is the Regional Statistics of Industry?
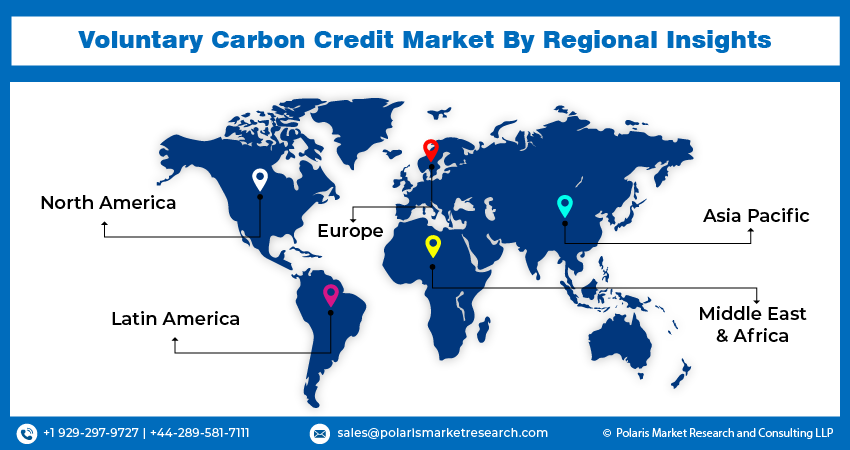
By region, the study provides market insights into North America, Europe, Asia-Pacific, Latin America, and Middle East & Africa. In 2024, North America accounted for the largest share in the voluntary carbon credit market due to well-developed financial markets and trading platforms facilitating the buying and selling of carbon credits. High levels of investment in renewable energy, carbon capture, and other emissions reduction technologies boost the supply and diversity of carbon credits available and strengthen the voluntary carbon credit industry landscape in North America. The key market players are merging, acquiring, and collaborating to strengthen their market presence and serve better offerings in North America, further driving the market during the forecast period.
The U.S. voluntary carbon credit market has the largest market share due to high levels of investment in renewable energy, carbon capture, and other emissions reduction technologies, which boosts the supply and diversity of carbon credits available. The regulatory policies and incentives supporting carbon offset projects and emissions reductions contribute to a more active market. In May 2024, the U.S. Department of the Treasury, a key player in the U.S. voluntary carbon credit market, issued a joint policy statement and principles on VCMs. These involve the buying and selling of credits representing one tonne of carbon reduced or removed from the atmosphere, conducted voluntarily by companies, NGOs, governments, and other entities. Beyond their role in advancing decarbonization efforts, VCMs offer potential economic opportunities both domestically and internationally. These include opportunities for farmers, ranchers, small suppliers, and through initiatives in developing nations. According to the report, voluntary carbon markets can create new revenue streams for farmers, ranchers, private forest owners, and rural communities while also stimulating investments in nature-based climate solutions within the agriculture and forestry sectors.
The Canada voluntary carbon credit market held a significant share in 2024. This is largely due to the efforts of organizations like the International Federation of Accountants (IFAC), CPA Canada, and the Institute for Sustainable Finance. These entities provide resources and guidelines that help market participants understand and engage in VCMs, increasing confidence and participation in the market. For instance, in June 2024, the International Federation of Accountants (IFAC), CPA Canada, and the Institute for Sustainable Finance published a resource for professional accountants and market players, including capital providers, businesses, and the broader public, on the state of voluntary carbon markets (VCMs) and their future development. This report analyzes existing VCMs, corresponding standards, and the finest techniques to improve confidence in carbon markets and encourage investment in credible GHG reduction projects. It follows IOSCO's consultation report to promote the integrity and orderly functioning of VCMs, which now forms part of IOSCO's updated 2024 work plan. Such a dynamic market is poised to continue expanding as more stakeholders recognize the benefits and opportunities associated with carbon offsetting and drive the voluntary carbon credit market demand.
The Asia-Pacific voluntary carbon credit market is expected to grow at the fastest CAGR during the forecast period. Growing awareness and commitment to CSR initiatives are pushing businesses to invest in carbon offset projects. Moreover, China’s voluntary carbon credit market held the largest market share in 2024. The rapid industrialization and urbanization in China have led to increased emissions, requiring carbon offset strategies. Major infrastructure projects often seek carbon credits to mitigate their environmental impact. The Indian voluntary carbon credit market is expected to continue its steady growth during the forecast period due to advancements in carbon capture and storage (CCS) technologies, as well as renewable energy projects, which are increasing the availability and viability of carbon credits.
Key Market Players & Competitive Insights
Leading market players include project developers, brokers, standards organizations, and buyers from various sectors. The voluntary carbon credit market is highly fragmented, with numerous small and large players involved in different aspects of the market. This fragmentation leads to a competitive landscape where innovation, development, credibility, and partnerships play critical roles. To expand and survive in a more competitive and rising market environment, the voluntary carbon credit industry must offer advancements in technology, such as blockchain for carbon trading transparency and improved carbon capture techniques. Collaborations between corporates, NGOs, and governments are essential for scaling up carbon offset projects. Partnerships help pool resources, share expertise, and increase the global voluntary carbon credit industry reach. Major players in the voluntary carbon credit market include South Pole Group, 3Degrees, Finite Carbon, EKI Energy Services Ltd., CarbonBetter, Terrapass, Carbon Credit Capital, Natureoffice GmbH, Climate Partner GmbH, TEM (Tasman Environmental), etc.
Finite Carbon Corporation is a developer and supplier of forest carbon offsets that was founded in 2009. Since its establishment, the firm has developed high-integrity projects in voluntary and compliance markets, covering 4 million acres of forests across the mainland. In 2013, Finite Carbon registered and developed California’s first compliance offset project. Since then, the company has been responsible for developing and transacting over 100 million offsets, accounting for one-third of California’s compliance offset supply. Currently, Finite Carbon is developing a portfolio of voluntary improved forest management projects in North America. In May 2024, Finite Carbon launched a marketplace for carbon credit buyers in the voluntary carbon market.
Tasman Environmental (TEM) is a significant provider of carbon offsetting solutions in the Asia-Pacific region, operating in both voluntary and compliance markets. TEM is the provider of voluntary Australian carbon credits and offers comprehensive carbon offsetting solutions to support business goals. These solutions, which include corporate offset portfolios, digital sales and calculations, carbon project development and investment options, and a trading desk, have had a significant impact. Since 2014, TEM has financed over 300 carbon projects in 30 countries, reducing more than 11 million tonnes of carbon emissions and providing community and biodiversity benefits. In June 2021, TEM launched a voluntary carbon offset program for the Singapore Airlines Group.
List Of Key companies
- 3Degrees
- Carbon Credit Capital
- CarbonBetter
- Climate Partner GmbH
- EKI Energy Services Ltd.
- Finite Carbon
- Natureoffice GmbH
- South Pole Group
- TEM (Tasman Environmental Markets)
- Terrapass
Voluntary Carbon Credit Industry Developments
- April 2025: Microsoft and BTG Pactual TIG inked a major agreement for 8 million carbon removal. The company also bought 40,000 verified credits from Indigo Ag to boost its soil carbon efforts. The company revealed that both actions support its target to become carbon negative by 2030.
- June 2024: RVCMC hosted a voluntary carbon credit auction in Nairobi, which sold over 2.2 million tonnes. The credits were taken from regional projects focused on emission removals and reductions. Key buyers included ENOWA, Aramco, and the Saudi Electricity Company.
- April 2024: RVCMC announced its partnership with Xpansiv for the launch of a new carbon credit exchange platform. With the strategic move, RVCMC aims at improving transparency and direct climate finance to underserved regions.
- April 2024: Saudi PIF-backed RVCMC teamed up with Xpansiv to roll out a new carbon credit exchange platform. The initiative seeks to enhance transparency and channel climate finance to underserved regions.
- December 2023: ClimatePartner and seven EU countries (Germany, Netherlands, France, Finland, Spain, Belgium, and Austria) published joint endorsements to enhance the voluntary carbon market's integrity. These recommendations ensure full transparency, high-quality carbon credits, and credible claims.
- June 2023: 3Degrees announced that Verra, the global carbon standards body, has approved a groundbreaking methane release project at Skyridge Farms. The project not only captures methane but also introduces an innovative system that delivers numerous benefits to the farm. The newly approved carbon credit project is set to enhance the financial health of the company.
- August 2021: South Pole partnered with Landcare NSW to develop and deliver nature-based climate transition alleviation and biodiversity projects in New South Wales. This innovative partnership aims to create lasting change through the development of carbon credit projects that provide real, tangible benefits.
Voluntary Carbon Credit Market Segmentation:
Voluntary Carbon Credit Project Type Outlook
- Removal/Sequestration projects
- Avoidance/Reduction projects
Voluntary Carbon Credit End User Outlook
- Aviation
- Energy
- Power
- Buildings
- Transportation
- Industrial
- Forestry
- Others
Voluntary Carbon Credit Regional Outlook
- North America
- US
- Canada
- Europe
- Germany
- France
- UK
- Italy
- Spain
- Netherlands
- Russia
- Rest of Europe
- Asia-Pacific
- China
- Japan
- India
- Malaysia
- South Korea
- Indonesia
- Australia
- Vietnam
- Rest of Asia-Pacific
- Middle East & Africa
- Saudi Arabia
- UAE
- Israel
- South Africa
- Rest of Middle East & Africa
- Latin America
- Mexico
- Brazil
- Argentina
- Rest of Latin America
Voluntary Carbon Credit Report Scope:
|
Report Attributes |
Details |
|
Market Size Value in 2024 |
USD 2,419.30 million |
|
Market Size Value in 2025 |
USD 3,024.52 million |
|
Revenue Forecast in 2034 |
USD 23,573.20 million |
|
CAGR |
25.6% from 2025 – 2034 |
|
Base Year |
2024 |
|
Historical Data |
2020 – 2023 |
|
Forecast Period |
2025 – 2034 |
|
Quantitative Units |
Revenue in USD million and CAGR from 2025 to 2034 |
|
Report Coverage |
Revenue Forecast, Market Competitive Landscape, Growth Factors, and Trends |
|
Segments Covered |
|
|
Regional Scope |
|
|
Competitive Landscape |
|
|
Report Format |
|
|
Customization |
Report customization as per your requirements with respect to countries, regions, and segmentation. |
FAQ's
Global voluntary carbon credit market size was valued at USD 2,419.30 million in 2024. The industry is projected to exhibit a compound annual growth rate (CAGR) of 25.6% during the forecast period (2025 - 2034)
The global market is projected to grow at a CAGR of 25.6% during the forecast period, 2024-2032
North America held the largest share of the global market.
The key players in the market are South Pole Group, 3Degrees, Finite Carbon, EKI Energy Services Ltd., CarbonBetter, Terrapass, Carbon Credit Capital, Natureoffice GmbH, Climate Partner GmbH, and TEM (Tasman Environmental).
The avoidance/reduction projects type is expected to witness the fastest CAGR during the forecast period
The power segment held the largest share in the global market
Voluntary carbon credits allow businesses, organizations, and individuals to offset their carbon emissions by purchasing credits from projects that reduce or remove greenhouse gases from the atmosphere, operating on a discretionary basis driven by proactive climate action and environmental responsibility.
Key trends include rising corporate net-zero commitments, growing adoption of carbon capture and storage technologies, expanding diversity of offset projects such as blue carbon and soil sequestration, advancements in blockchain-based trading transparency, and increasing government policy guidelines supporting high-integrity voluntary carbon markets.
Page last updated on:
Jul-2024
Research Methodology
A robust system of research, verification, and forecasting designed to ensure reliable and actionable market insights.
Polaris Market Research uses a clear and structured approach to deliver insights that clients can rely on. The process combines detailed primary and secondary research, including direct communication with industry experts. The detailed information helps build a complete picture of market trends and developments. Secondary data is gathered from credible sources such as industry reports, company filings, government source links, and trusted organization databases. It is then cross-checked through discussions with key stakeholders across the value chain. Market size and forecasts are developed using both bottom-up and top-down methods to ensure accuracy and consistency in the final results.

Project Setup
Step 1 & 2:
- We start every project by clearly understanding the client’s objective or goal, then defining the market scope, and aligning regions, segments, and timelines.
- Once the foundation is set, we collect data from all-around of sources, including company reports, government databases, and paid industry platforms.
- Our research is based on secondary data, which helps us build a strong understanding of the market across regions and industries. Then we validate this information through primary research by speaking directly with industry experts, companies, and stakeholders.
- By combining secondary and primary research, we ensure that our market insights are accurate, practical, and closely aligned with real market conditions.
Data Collection
We gather information from both public and verified sources:

Data Structuring
Step 3:
- All collected data is organized into a consistent format to ensure accurate analysis. Since inputs come from multiple sources, they are standardized and aligned before use.
- The data is segmented by product, application, and region, and mapped across a defined historical period (2020–2024). All values are converted into common units (USD Mn/Bn), and volume and pricing are aligned where required to estimate revenue.
- Any overlaps or inconsistencies are reviewed and adjusted to maintain accuracy (<5% variance threshold).
- The result is a structured dataset that allows for clear comparison across regions and supports reliable analysis and forecasting.
Structured Market Dataset, USD Mn/Bn

4. Data Structuring
Step 4: TOP-DOWN APPROACH
- We start with the overall market size at a global or macro level.
- The market is then narrowed down based on scope and industry relevance.
- We apply penetration rates and split the data by region and segment.
- This helps us estimate the market size for specific segments.
- The numbers are validated through cross-checks to ensure accuracy.

Step 5: BOTTOM-UP APPROACH
- We begin by analyzing data from leading companies in the market.
- Revenue data is collected and mapped across different segments.
- The data is then aggregated to estimate the total market size.
- To fill in any gaps, adjustments are made based on industry standards.
- Validation checks make sure that the results are correct.

5. Data Structuring
Step 6:
At Polaris Market Research, we employ a methodical forecasting strategy. This approach blends the analysis of historical data with real-time market validation. To forecast future trends with precision, we examine past patterns, pricing fluctuations, and the interplay of supply and demand. To ensure our conclusions reflect the present market landscape, we actively seek input from industry experts and key stakeholders.
To refine our predictions, we carefully consider critical elements such as market drivers and restraints, fluctuations in raw material costs, emerging technologies, and the production capabilities of various regions. Furthermore, we assess regulatory frameworks and potential policy shifts to gauge their potential impact on market expansion.
All this information is synthesized to generate precise forecasts for each segment and region. These forecasts illuminate the current state of the market and highlight forthcoming opportunities.

6. Data Structuring
Step 7:
In the final stage, we validate all our estimates using a triangulation method, where data is cross-checked from multiple reliable sources, like company data, primary interviews, and secondary research. This helps us make sure that our numbers are correct and fit with the rest of the market.
This process involves verifying data consistency across various segments and geographic areas. It also requires comparing historical trends with the assumptions support the forecast. Any discrepancies involve adjustments to ensure everything remains aligned and dependable.
Once the data is finalized, we prepare the final outputs, including market size estimates, segment-wise breakdowns, and growth metrics. These are delivered in structured formats such as tables, charts, and data files for easy analysis and use.
We collaborate closely with clients, ensuring the final products align with their requirements. This includes offering tailored adjustments, supplementary data analyses, and continuous assistance. Furthermore, we monitor market trends post-delivery, providing updates and refinements to maintain the insights' relevance as time passes.
Post-delivery, we continue to monitor market shifts, offering updates and adjustments to ensure the insights remain relevant over time.
Validation
Triangulation Framework
- Company-level data
- Primary inputs from industry participants
- Secondary benchmarks and published data
- Variance maintained within ±5-10%
- Adjustments applied to align estimates
- Segment values validated against overall market structure
Quality Check
Data Consistency & Integrity
- Segment totals validated to 100%
- Regional estimates aligned with global market size
- Historical trends compared against forecast outputs
- Assumptions reviewed for cross-segment and regional alignment
Output & Delivery
Final Outputs
- Market size estimates (USD Mn/Bn)
- Segment-wise distribution (%)
- Growth metrics (CAGR %)
- Structured tables and charts
- Segment-level datasets
- Excel-based data files for further analysis
Client Alignment & Support
- Deliverables are aligned with defined client requirements and scope
- Custom data cuts and segment splits are incorporated as required
- Post-delivery queries are addressed through analyst interactions
- Additional clarifications and data support are provided upon request
Client Continuity & Updates
- Market developments are tracked post-delivery to capture changes in key trends
- Updated data and revisions are provided based on new market inputs
- Additional refinements and data cuts are shared as required
- Continued analyst engagement supports evolving client requirements
