

Market Overview
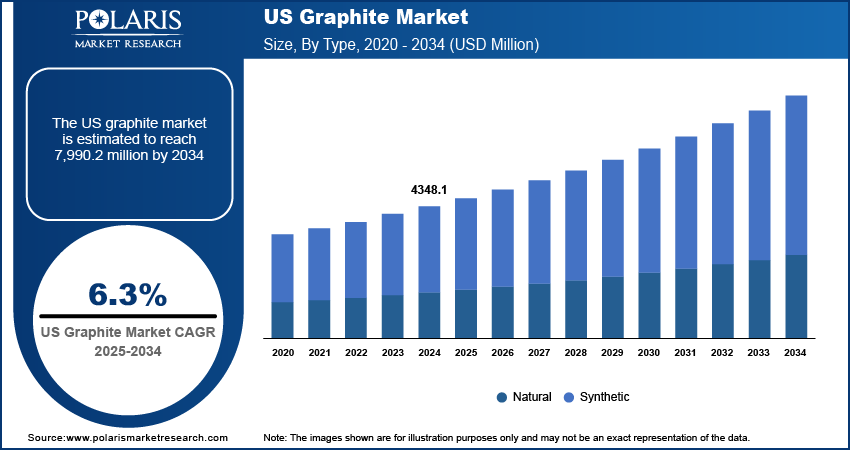
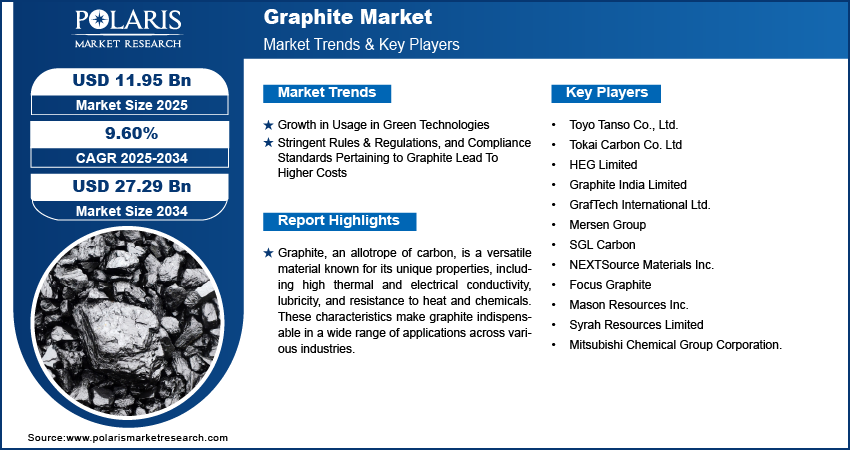
The global graphite market size was valued at USD 12.12 billion in 2025 and is expected to register a CAGR of 9.6% from 2026 to 2034. The graphite market is driven by the increasing demand for batteries, refractories, and lubricants. Technological advancements in graphite are improving the quality of graphite, which is expected to drive the graphite market growth in the future.
Key Insights
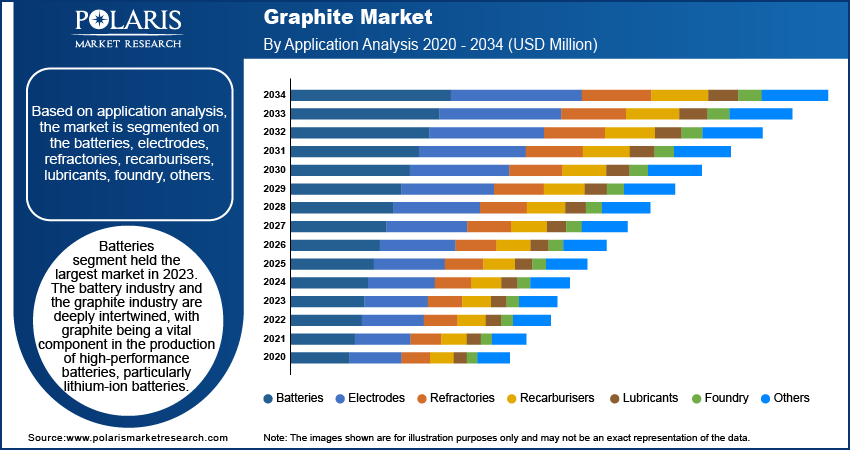
- The batteries segment held the largest market share in 2025. Graphite is a critical component in the production of high-performance batteries, especially lithium-ion batteries.
- The synthetic graphite market is expected to register the highest CAGR from 2026 to 2034. The growing acceptance of synthetic graphite by battery manufacturers is due to its consistent structure and suitability for fast-charging batteries. This is expected to fuel the synthetic graphite growth rate during the forecast period.
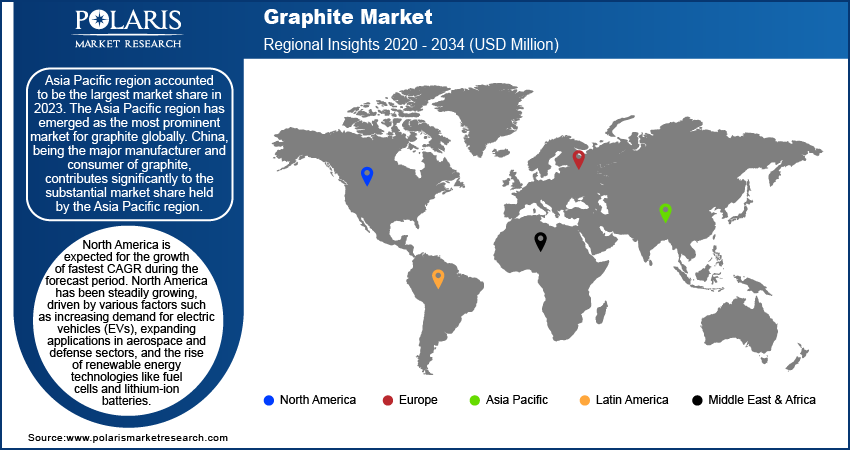
- Asia Pacific dominated the largest market share in 2024. The robust industrial foundation and focus on manufacturing and technological advancements boost graphite production in the Asia Pacific.
- The North America market is expected to have the highest CAGR during the forecast period. The rising demand for electric vehicles and growing use in the aerospace and defense industries drive the market in the region.
Industry Dynamics
- The rising demand for energy storage solutions for renewable energy and electric vehicles is boosting market expansion. The increasing use of graphite in green technologies is fueling the growth of the graphite market.
- Government support for the development of clean energy sources, such as electric vehicles and local battery production, is creating steady and long-term demand for graphite. However, demand faces supply chain risks stemming from the concentration of graphite mining and processing in a few locations.
- The strict rules and regulations, along with compliance requirements for graphite, are increasing costs, thereby hampering market growth.
Market Statistics
- 2025 Market Size: USD 12.12 billion
- 2034 Projected Market Size: USD 27.65 billion
- CAGR (2026–2034): 9.6%
- Asia Pacific: Largest market in 2025
Graphite is a carbon allotrope that functions as an all-purpose material because it possesses special characteristics that enable high thermal and electrical conductivity, serve as a lubricant, and withstand heat and chemical exposure. The unique properties of graphite make it an essential material for a wide range of applications. In the energy storage industry, graphite serves as a primary element in lithium-ion batteries, which use it as their anode material. The automotive industry relies on graphite for producing brake linings and clutch facings because of its ability to withstand extreme temperatures while reducing friction. Graphite functions as a friction-reducing agent in industrial lubricants, which enables machines to operate smoothly under demanding situations. The steel industry uses graphite during the carburizing process to introduce carbon into molten steel for achieving specific material characteristics. The high carbon content and purity of graphite make it an ideal material for this process.
The graphite industry presents an attractive landscape that is characterized by a combination of technological requirements and sustainable initiatives. With the increasing adoption of electric vehicles, battery energy storage systems, and renewable energy solutions, graphite, which is an essential material in lithium-ion batteries, is witnessing a significant increase in demand. The increasing demand for graphite is also driven by emerging sectors such as energy storage and aerospace. In addition, the increasing concern for sustainability and environmental awareness is promoting a shift towards natural graphite that is mined with minimal environmental impact.
For instance, in April 2024, TOYO TANSO CO., LTD. announced that it would increase its production capacity. The move is expected to satisfy the rising demand for silicon carbide (SiC) and tantalum carbide (TaC)-coated graphite materials globally.
In addition, technology and materials science are improving the quality of graphite. This is opening new avenues for the use of graphite. With the rising need for efficiency and performance, the demand for high-quality graphite is expected to increase.
Market Drivers
Growth in Usage in Green Technologies
The graphite industry is growing because of increasing requirements for graphite used in environmentally friendly technologies. Graphite has some unique properties, which include its ability to conduct heat and electricity, as well as its resistance to chemical reactions. This makes it essential for multiple environmentally friendly purposes. The main use of graphite in environmentally friendly technology is to produce lithium-ion batteries, which serve as essential components for storing energy from electric vehicles and renewable energy sources. Graphite serves as the anode material in lithium-ion batteries, enabling stable lithium-ion storage during charging and discharging. This application improves battery performance and extends their storage life, supporting electric vehicle operation and renewable energy use.
The use of graphite in these green technologies is driving the graphite market. Various industries and governments around the world are working towards the reduction of carbon emissions and the adoption of sustainable energy sources. The automobile industry's transition to electric vehicles, along with the worldwide focus on renewable energy, is a major positive factor for the graphite market. For example, In May 2022, Hyundai announced its plan to invest USD 5.5 billion in the construction of an electric vehicle (EV) and battery manufacturing plant in Bryan County, Georgia, U.S. The company plans to start commercial production in the first half of 2025, with an annual production target of 300,000 units. Electrodes are among the key drivers of demand in this market. Electrodes used in steel production and other energy-intensive industries also have a significant role in supporting demand, which helps keep graphite consumption diversified beyond batteries.
Market Restraints
Stringent Rules & Regulations, and Compliance Standards Pertaining to Graphite Lead To Higher Costs
Tough rules and regulations, along with compliance standards for the production and use of graphite, pose major challenges for market players, thereby increasing operational costs in the graphite market. These rules and regulations cover various areas, such as environmental impact, worker safety, and product quality control. Adherence to these standards requires major investments in equipment and worker training.
The imposition of strict regulations impacts various segments of the graphite industry. Graphite producers are impacted by the need to comply with environmental regulations, which would entail adopting strategies to reduce emissions and offset the environmental impact of mining and processing activities. This would include investments in technologies for wastewater treatment, dust control, and site reclamation, thereby increasing costs.
Report Segmentation
The graphite market is categorized based on product, form, application, end use industry and region, which is indicative of the varied use of the product in industry.
By Application Insights
Based on application analysis, the market is segmented into batteries, electrodes, refractories, recarburisers, lubricants, foundry, and others. The batteries category had the largest market share in 2025. The battery industry and the graphite industry are interlinked, and graphite is an essential material used in the manufacture of high-performance batteries, specifically lithium-ion batteries. In lithium-ion batteries, graphite is utilized as an anode material because of its high electrical conductivity, high energy density, and stability during the charge/discharge process. This makes it an ideal material for ensuring the efficiency and life of batteries used in various applications, such as consumer electronics and electric vehicles (EVs).
The graphite market is experiencing significant growth due to increasing demand for electric vehicles. The automotive industry requires advanced batteries as manufacturers shift to electric vehicle production to comply with environmental regulations and meet consumer demand for sustainable options. For instance, Tesla utilizes graphite as the main material in the battery packs that power its cars and energy storage solutions. The Gigafactories established by Tesla are monumental in creating a market for high-quality graphite.
By Product Insights
Based on product analysis, the market has been segmented on the basis of natural graphite and synthetic graphite. The synthetic graphite segment is anticipated to be the fastest-growing segment during the forecast period. Synthetic graphite, which contains carbon, is produced through high-temperature processes involving the graphitization of petroleum coke and coal tar pitch. Industries use synthetic graphite because it has been developed to meet specific performance needs that differ from those of natural graphite from mining. Its atomic structure exhibits complete order. This allows it to achieve better mechanical, thermal, and electrical performance than natural graphite.
Regional Insights
Asia Pacific
Asia Pacific accounted for the largest market share in 2025. The Asia Pacific region has emerged as the most prominent market for graphite. China, as the chief producer and consumer of graphite, has made a significant contribution to the Asia Pacific region's large share. The region’s strong industrial base and emphasis on manufacturing and technology are the reasons behind its strong position.
The regional players use various approaches, such as product innovation, differentiation, mergers, acquisitions, alliances, and partnerships, to sustain their market lead. For example, in June 2022, Mitsubishi Chemical Holdings Group (MCHG) enhanced the production capacity of natural graphite anode material at its Chinese subsidiaries, Qingdao Lingda Kasei and Qingdao Anode Kasei, from 2,000 tons/year to 12,000 tons/year.
North America
The North America graphite market is anticipated to register the highest CAGR during the forecast period. North America has been growing steadily over the years due to several factors, including the growing demand for electric vehicles (EVs), their use in the aerospace and defense industries, and the development of renewable energy sources such as fuel cells and lithium-ion batteries. Graphite is an essential material used in lithium-ion batteries, which power EVs. The regional market is also benefiting from government incentives and efforts to localize critical mineral supply chains.
Competitive Landscape
The graphite industry is saturated with the presence of major players. These firms have a significant customer base and efficient distribution channels, giving them a competitive edge in market reach and penetration. The market is highly competitive. The companies are competing for market share with continuous enhancements in strategic collaborations, partnerships, and innovation. To keep up with the increasing demands of the industry and meet the stringent quality standards, the companies are actively involved in research and development activities. The competitive landscape is complex and dynamic, with various companies competing in various market segments.
List of Key Companies
- Focus Graphite
- GrafTech International Ltd.
- Graphite India Limited
- HEG Limited
- Mason Resources Inc.
- Mersen Group
- Mitsubishi Chemical Group Corporation.
- NEXTSource Materials Inc.
- SGL Carbon
- Syrah Resources Limited
- Tokai Carbon Co. Ltd
- Toyo Tanso Co., Ltd.
Recent Developments
- In April 2025, Vianode launched its new synthetic graphite anode for electric vehicle batteries, which uses recycled materials as its primary component. The company will use this technology to reduce its dependence on imported materials while decreasing its greenhouse gas emissions. The system will enhance the performance of electric vehicle batteries through two main benefits, which include faster charging times and increased driving distances.
- In July 2023, Mersen inaugurated new graphite manufacturing facilities in the USA. The company stated that the new facilities are aimed at improving its production capabilities. The strategic move will help the company make 2,000 tons of isostatic graphite and 4,000 tons of extruded graphite annually.
- In March 2023, Mersen, and Wolfspeed, the global leader in Silicon Carbide technology, announced a major contract. Under this agreement, Mersen will supply Wolfspeed with graphite and other high-tech materials to support Wolfspeed’s capacity expansion to meet rapidly growing demand for SiC materials and devices.
- In October 2022, SGL Carbon enhanced its production capabilities for graphite products intended for the semiconductor industry. The company increased its production capacities at the Shanghai, St. Marys (USA), and Meitingen (Germany) facilities.
- In October 2022, Syrah Resources disclosed its strategy to quadruple the size of its graphite facility situated in Louisiana, USA. This expansion initiative followed the allocation of a substantial grant of USD 219.8 million from the U.S. government.
Report Coverage
The Graphite market report emphasizes on key regions across the globe to provide a better understanding of the product to the users. Also, the report provides market insights into recent developments, trends, and analyzes the technologies that are gaining traction around the globe. Furthermore, the report covers in-depth qualitative analysis pertaining to various paradigm shifts associated with the transformation of these solutions.
The report provides a detailed analysis of the market while focusing on various key aspects such as competitive analysis, product, application, and their futuristic growth opportunities.
Graphite Market Segmentation
By Product Outlook (Revenue, USD Billion, 2021–2034)
- Natural Graphite
- Synthetic Graphite
By Form Outlook (Revenue, USD Billion, 2021–2034)
- Flake Graphite
- Micronized Graphite
- Expanded Graphite
- Graphite Granules
By Application Outlook (Revenue, USD Billion, 2021–2034)
- Batteries
- Lubricants
- Refractories
- Electronics
- Composite Materials
By End Use Industry Outlook (Revenue, USD Billion, 2021–2034)
- Automotive
- Aerospace
- Energy
- Electronics
- Construction
By Regional Outlook (Revenue, USD Billion, 2021–2034)
- North America
- US
- Canada
- Europe
- Germany
- France
- UK
- Italy
- Spain
- Netherlands
- Russia
- Rest of Europe
- Asia Pacific
- China
- Japan
- India
- Malaysia
- South Korea
- Indonesia
- Australia
- Vietnam
- Rest of Asia Pacific
- Middle East & Africa
- Saudi Arabia
- UAE
- Israel
- South Africa
- Rest of Middle East & Africa
- Latin America
- Mexico
- Brazil
- Argentina
- Rest of Latin America
Graphite Market Report Scope
|
Report Attributes |
Details |
|
Market Size in 2025 |
USD 12.12 billion |
|
Market Size in 2026 |
USD 13.24 billion |
|
Revenue Forecast by 2034 |
USD 27.65 billion |
|
CAGR |
9.6% |
|
Base Year |
2025 |
|
Historical Data |
2021–2024 |
|
Forecast Period |
2026–2034 |
|
Quantitative Units |
Revenue in USD billion, and CAGR from 2026 to 2034 |
|
Report Coverage |
Revenue Forecast, Market Competitive Landscape, Growth Factors, and Trends |
|
Segments Covered |
|
|
Regional Scope |
|
|
Competitive Landscape |
Graphite Industry Trend Analysis (2025) Company profiles/industry participants profiling include company overview, financial information, product/service benchmarking, and recent developments |
|
Report Format |
PDF + Excel |
|
Customization |
Report customization as per your requirements with respect to countries, regions, and segmentation. |
FAQ's
The graphite market stood at USD 12.12 billion in 2025. It is projected to account for a CAGR of 9.6% between 2026 and 2034.
Graphite is primarily used in lithium-ion battery anodes and brake linings. It also finds uses in clutch facings, refractories, and lubricants.
The graphite market is primarily driven by rising electric vehicle demand and expanding production of lithium-ion batteries. The market is also benefiting from the growth of renewable energy storage systems.
Asia Pacific leads the graphite industry. This is due to the region’s strong manufacturing base and growing electric vehicle adoption in China and India.
Natural graphite is mined and processed from earth deposits. Synthetic graphite is manufactured in controlled environments. The synthetic type offers high purity and superior performance.
Page last updated on:
Apr-2023
Research Methodology
A robust system of research, verification, and forecasting designed to ensure reliable and actionable market insights.
Polaris Market Research uses a clear and structured approach to deliver insights that clients can rely on. The process combines detailed primary and secondary research, including direct communication with industry experts. The detailed information helps build a complete picture of market trends and developments. Secondary data is gathered from credible sources such as industry reports, company filings, government source links, and trusted organization databases. It is then cross-checked through discussions with key stakeholders across the value chain. Market size and forecasts are developed using both bottom-up and top-down methods to ensure accuracy and consistency in the final results.

1. Project Setup
Step 1 & 2:
- We start every project by clearly understanding the client’s objective or goal, then defining the market scope, and aligning regions, segments, and timelines.
- Once the foundation is set, we collect data from all-around of sources, including company reports, government databases, and paid industry platforms.
- Our research is based on secondary data, which helps us build a strong understanding of the market across regions and industries. Then we validate this information through primary research by speaking directly with industry experts, companies, and stakeholders.
- By combining secondary and primary research, we ensure that our market insights are accurate, practical, and closely aligned with real market conditions.
2. Data Collection
We gather information from both public and verified sources:

3. Data Structuring
Step 3:
- All collected data is organized into a consistent format to ensure accurate analysis. Since inputs come from multiple sources, they are standardized and aligned before use.
- The data is segmented by product, application, and region, and mapped across a defined historical period (2020–2024). All values are converted into common units (USD Mn/Bn), and volume and pricing are aligned where required to estimate revenue.
- Any overlaps or inconsistencies are reviewed and adjusted to maintain accuracy (<5% variance threshold).
- The result is a structured dataset that allows for clear comparison across regions and supports reliable analysis and forecasting.
Structured Market Dataset, USD Mn/Bn

4. Data Structuring
Step 4: TOP-DOWN APPROACH
- We start with the overall market size at a global or macro level.
- The market is then narrowed down based on scope and industry relevance.
- We apply penetration rates and split the data by region and segment.
- This helps us estimate the market size for specific segments.
- The numbers are validated through cross-checks to ensure accuracy.

Step 5: BOTTOM-UP APPROACH
- We begin by analyzing data from leading companies in the market.
- Revenue data is collected and mapped across different segments.
- The data is then aggregated to estimate the total market size.
- To fill in any gaps, adjustments are made based on industry standards.
- Validation checks make sure that the results are correct.

5. Data Structuring
Step 6:
At Polaris Market Research, we employ a methodical forecasting strategy. This approach blends the analysis of historical data with real-time market validation. To forecast future trends with precision, we examine past patterns, pricing fluctuations, and the interplay of supply and demand. To ensure our conclusions reflect the present market landscape, we actively seek input from industry experts and key stakeholders.
To refine our predictions, we carefully consider critical elements such as market drivers and restraints, fluctuations in raw material costs, emerging technologies, and the production capabilities of various regions. Furthermore, we assess regulatory frameworks and potential policy shifts to gauge their potential impact on market expansion.
All this information is synthesized to generate precise forecasts for each segment and region. These forecasts illuminate the current state of the market and highlight forthcoming opportunities.

6. Data Structuring
Step 7:
In the final stage, we validate all our estimates using a triangulation method, where data is cross-checked from multiple reliable sources, like company data, primary interviews, and secondary research. This helps us make sure that our numbers are correct and fit with the rest of the market.
This process involves verifying data consistency across various segments and geographic areas. It also requires comparing historical trends with the assumptions support the forecast. Any discrepancies involve adjustments to ensure everything remains aligned and dependable.
Once the data is finalized, we prepare the final outputs, including market size estimates, segment-wise breakdowns, and growth metrics. These are delivered in structured formats such as tables, charts, and data files for easy analysis and use.
We collaborate closely with clients, ensuring the final products align with their requirements. This includes offering tailored adjustments, supplementary data analyses, and continuous assistance. Furthermore, we monitor market trends post-delivery, providing updates and refinements to maintain the insights' relevance as time passes.
Post-delivery, we continue to monitor market shifts, offering updates and adjustments to ensure the insights remain relevant over time.
Validation
Triangulation Framework
Estimates are cross-verified across three sources:
Company-level data
• Primary inputs from industry participants
• Secondary benchmarks and published data
Variance maintained within +5-10%
Adjustments applied to align estimates
Segment values validated against overall market structure
Quality Check
Data Consistency & Integrity
Segment totals validated to 100%
Regional estimates aligned with global market size
Historical trends compared against forecast outputs
Assumptions reviewed for cross-segment and regional alignment
Output & Delivery
Final Outputs
Market size estimates (USD Mn/Bn)
Segment-wise distribution (%)
Growth metrics (CAGR %)
Final Outputs
Structured tables and charts
Segment-level datasets
Excel-based data files for further analysis
Client Alignment & Support
- Deliverables are aligned with defined client requirements and scope
- Custom data cuts and segment splits are incorporated as required
- Post-delivery queries are addressed through analyst interactions
- Additional clarifications and data support are provided upon request
Client Continuity & Updates
- Market developments are tracked post-delivery to capture changes in key trends
- Updated data and revisions are provided based on new market inputs
- Additional refinements and data cuts are shared as required
- Continued analyst engagement supports evolving client requirements
