
Aerospace Parts Manufacturing Market : Upward Trajectory Through 2026-2034
REPORT DETAILS
Market Statistics
Aerospace Parts Manufacturing Market Overview
The global aerospace parts manufacturing market size was valued at USD 1.01 trillion in 2025, exhibiting a CAGR of 5.2% during 2026–2034. The rising global air traffic, increasing modernization of fleets, and expanding operations of airlines are the primary factors fueling market growth.
Key Takeaways
- North America led the global market with a revenue share of 42.0% in 2025. The presence of major market participants, along with significant investments in research and development, drives the region’s leading market share.
- Asia Pacific is registering substantial growth at a CAGR of 7.2% during the forecast period, primarily due to expanding commercial aviation fleets and rising air travel demand in the region.
- In 2025, the aerostructure segment accounted for 25.0% market share. The crucial role of aerostructure in aircraft construction contributes to the segment’s larger market share.
- The commercial aircraft segment dominated the market with a revenue share of 55.0%. The rising demand for air travel is fueling the robust growth of the segment.
- The business aircraft segment is expected to witness the fastest growth at a CAGR of 6.3% during the forecast period.
*
Source: Polaris Market Research Analysis
Note: Figures and projections outlined in this report are the result of Polaris Market Research’s proprietary analytical processes, grounded in the latest available datasets and market observations.Market Statistics
- 2025 Market Size: USD 1.01 trillion
- 2034 Projected Market Size: USD 1.60 trillion
- CAGR (2026-2034): 5.2%
- North America: Largest Market in 2025
Industry Dynamics
- The increasing spending on military drones/UAVs has boosted the demand for advanced components such as precision control systems and lightweight frames, driving market expansion.
- Growing focus on aircraft weight reduction and the introduction of government initiatives that aim at expanding space exploration programs are fueling robust demand for aerospace components.
- A growing emphasis on rapid prototyping and design iteration using additive manufacturing is expected to create several market opportunities.
- Price Volatility in the market may present market challenges.
Source: Polaris Market Research Analysis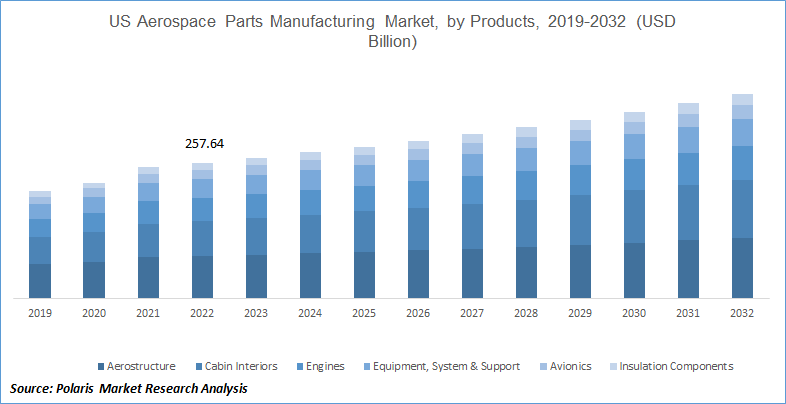
To Understand More About this Research:Download Sample Report
What is Aerospace Parts Manufacturing?
The production of aerospace parts is the manufacturing of very precise, long-lasting, and safety-critical parts such as airframe structures, engine components, landing gear, and avionics housings used in air, space and missile applications.
The aerospace parts manufacturing industry plays a crucial role in supporting both commercial and defense aviation sectors. It involves the production of critical components such as engines, airframes, landing gear, avionics, and control systems that ensure the safety, performance, and efficiency of aircraft. This sector supports aircraft production and also provides aftermarket parts for maintenance, repair, and overhaul (MRO), making it essential for sustained aviation operations.
List of Materials Used in Aerospace Parts Manufacturing
| Material Type | Key Properties | Common Applications |
| Aluminum Alloys | Lightweight, high strength-to-weight ratio, corrosion resistance | Fuselage structures, wings, panels |
| Titanium Alloys | High strength, heat resistance, corrosion resistance | Engine components, landing gear, structural parts |
| Stainless Steel | Durability, high strength, temperature resistance | Engine parts, exhaust systems, tanks, fasteners |
| Nickel-Based Superalloys (Inconel) | Superior heat resistance, oxidation resistance | Turbine blades, jet engines, high-temperature zones |
| Carbon Fiber Reinforced Polymers (CFRP) | Lightweight, high strength, fuel efficiency | Aircraft bodies, wings, interiors |
| Glass Fiber Composites | Corrosion resistance, durability, cost-effective | Radomes, cabin interiors, secondary structures |
| Engineering Plastics | Chemical resistance, lightweight, thermal stability | Seals, insulation parts, cable systems, interiors |
| Rubber and Silicone Materials | Flexibility, thermal stability, fuel resistance | Seals, gaskets, vibration dampers |
| Ceramics and Thermal Barrier Materials | Extreme temperature resistance, insulation performance | Heat shields, turbine coatings, insulation systems |
| Magnesium Alloys | Very lightweight, good machinability | Lightweight structural applications |
| Copper Alloys | High electrical and thermal conductivity | Electrical systems, connectors, heat exchangers |
| Additive Manufacturing Powders | Design flexibility, precision, lightweight structures | Aerospace 3D printed precision parts |
Source: Polaris Market Research Analysis
The global demand for aerospace parts is growing significantly due to increased air travel. According to the International Air Transport Association (IATA), global air passenger demand in 2024 rose by 10.4% compared to 2023, surpassing pre-pandemic levels. This sharp recovery in international and domestic air traffic, especially the strong year-end finish in December, emphasizes the aerospace parts manufacturing market opportunity. Aircraft manufacturers are increasing production to meet the rising demand, resulting in a greater demand for reliable and high-quality parts.
The rising global air passenger traffic directly correlates with the growing requirement for newer, more fuel-efficient aircraft, which, in turn, accelerates the aerospace parts manufacturing market demand. Airlines are modernizing fleets and expanding operations, triggering a wave of orders for parts manufacturers. Additionally, high load factors and increased operational hours place further emphasis on the demand for durable and technologically advanced components
Real-World Examples of Aerospace Parts Manufacturing Applications and Materials Used
| Application Area | Parts | Key Materials Used |
| Aircraft Engines | Turbine blades, compressor discs, exhaust nozzles | Nickel-based superalloys, titanium alloys, ceramics |
| Fuselage Structures | Aircraft body panels, wing frames, bulkheads | Aluminum alloys, CFRP, titanium alloys |
| Landing Gear Systems | Main landing gear, nose gear assemblies | Titanium alloys, stainless steel, high-strength steel |
| Avionics Systems | Wiring systems, connectors, control panels | Copper alloys, engineering plastics, aluminum |
| UAV Components | Drone frames, propulsion housings, sensor mounts | CFRP, aluminum alloys, engineering plastics |
Source: Polaris Market Research Analysis
Market Dynamics
Increasing Spending on Military Drones/UAVs
The increasing spending on military drones/UAVs is significantly driving aerospace parts manufacturing market expansion. Military drones, now central to modern warfare, require advanced components such as lightweight airframes, precision control systems, and efficient propulsion units. The rising demand for intelligence, surveillance, and reconnaissance (ISR) capabilities is pushing defense agencies to invest heavily in UAV technology. According to the Teal Group, global R&D and procurement spending on military drones is expected to grow from USD 11.1 trillion in 2020 to USD 14.3 trillion by 2029.
The US leads this trend by increasing its R&D spending from USD 2.2 trillion in 2020 to a projected USD 2.7 trillion by 2029. Fuel cell-powered drones, offering extended flight time and reduced noise, are becoming preferred choices. For instance, LIG Nex1 was selected for South Korea’s USD 39.3 trillion hydrogen-powered cargo drone project. This shift toward technologically advanced UAVs is fueling the aerospace parts manufacturing market demand, particularly for innovative and lightweight components.
Rising Focus on Reducing Aircraft Weight and Increasing Government Initiatives
The increasing focus on reducing total aircraft weight using lightweight parts is a key driver of aerospace parts manufacturing market development. Lightweight components enhance fuel efficiency, lower emissions, and reduce maintenance costs, making them essential for modern aircraft design. The use of advanced composites in fuselage manufacturing minimizes fatigue in high-tension areas, reducing the need for frequent repairs and lowering overall operational costs.
Government initiatives aimed at expanding space exploration programs are creating strong demand for aerospace components. Satellites, rockets, and related space systems require high-performance, lightweight parts for efficiency and durability. Additionally, the growing use of drones and UAVs for military and surveillance applications is contributing to the aerospace parts manufacturing market growth despite potential restraints from fluctuating military budgets.
Source: Polaris Market Research Analysis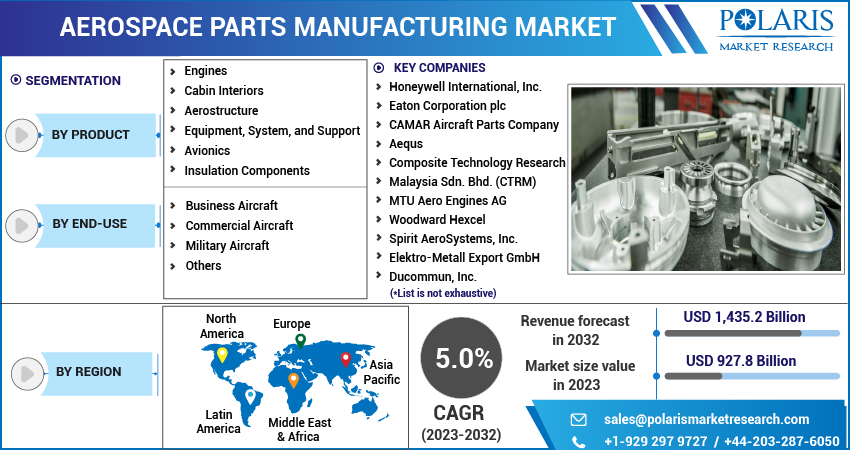
Get Full Segment-Level Forecasts & Insights: Download Sample Report
Segment Analysis
Assessment by Product
The global aerospace parts manufacturing market segmentation, based on product, includes aerostructure; cabin interiors; engines; equipment, system, & support; avionics; and insulation components. In 2025, the aerostructure segment accounted for 25.0% of the aerospace parts manufacturing market share due to its critical role in aircraft construction. Aerostructures include key components such as fuselage, wings, and empennage, which form the structural backbone of an aircraft. The increased demand for lightweight and durable materials in these areas drives significant investment in design and manufacturing innovations. The growing aircraft production across commercial and defense sectors further amplifies demand for these essential structures.
Technological advancements in composite materials and modular assembly techniques are helping manufacturers meet performance and efficiency standards. The increased production of next-generation aircraft and rising demand for fuel-efficient designs continue to reinforce the dominance of the aerostructure segment within the overall market.
Evaluation by End Use
The global aerospace parts manufacturing market segmentation, based on end use, includes business aircraft, commercial aircraft, military aircraft, and others. The commercial aircraft segment dominated the market with 55.0% share in 2025, due to the rising demand for air travel, especially in emerging economies. The increasing globalization, tourism, and business travel are driving airlines to expand and modernize their fleets. Airlines are focusing on fuel-efficient, next-generation aircraft to reduce operational costs and environmental impact. Governments and the private sector are heavily investing in aviation infrastructure to support growing passenger traffic. Technological advancements and improved safety features are also boosting aircraft replacement cycles. These factors collectively contribute to the rapid growth and strong outlook of the commercial aircraft segment.
Source: Polaris Market Research Analysis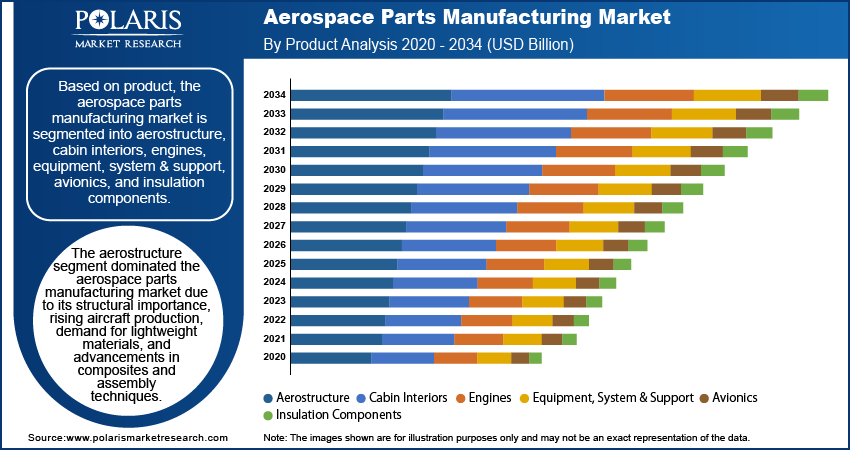
Need Granular Data Across All Market Segments? Request Customization
Regional Analysis
By region, the study provides aerospace parts manufacturing market insights into North America, Europe, Asia Pacific, Latin America, and the Middle East & Africa. North America dominated the global aerospace parts manufacturing market with 42.0% revenue share due to the presence of key industry players, robust technological advancements, and significant investments in research and development. The region is home to major aerospace manufacturers and suppliers, including Boeing, Lockheed Martin, and General Electric, that drive the market growth. The demand for both commercial and defense aircraft, coupled with high government spending on defense contracts, contributes to North America's leadership. Moreover, favorable regulatory frameworks, a skilled workforce, and the adoption of innovative manufacturing processes further strengthen the market demand in the region.
Source: Polaris Market Research Analysis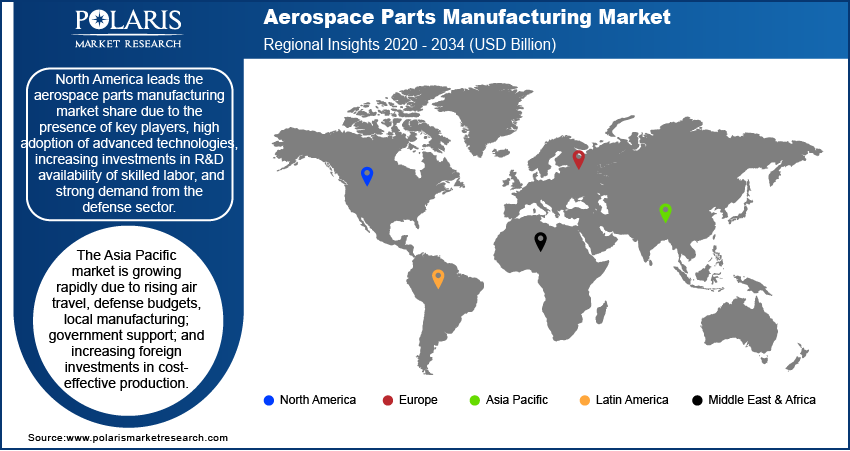
Curious About Regional Market Performance? Request Customization
The Asia Pacific aerospace parts manufacturing market is experiencing substantial growth at a CAGR of 7.2%, due to rapid industrialization, increasing air travel demand, and expanding commercial aviation fleets. Countries such as China, India, and Japan are heavily investing in aerospace infrastructure and local production capabilities. Government initiatives supporting domestic manufacturing and strategic partnerships with global aerospace companies are driving regional market development. The rising defense budgets and the emergence of low-cost carriers are boosting demand for new aircraft and replacement parts. Skilled labor availability and cost-effective manufacturing further attract foreign investments, making Asia Pacific a key hub for market development in the coming years.
Key Players and Competitive Analysis Report
The competitive landscape of the aerospace parts manufacturing market is characterized by a mix of global leaders and regional players competing for market share through innovation, strategic partnerships, and regional expansion. A few key market players such as GE Aviation; Honeywell International, Inc.; IHI Corp.; Kawasaki Heavy Industries Ltd.; Mitsubishi Heavy Industries, Ltd.; Rolls Royce plc; Raytheon Technologies Corp.; Ducommun Inc.; Eaton Corporation plc; and Thales Group leverage their strong engineering capabilities and global manufacturing footprints to develop high-performance aerospace components. These companies focus on competitive intelligence and strategy to optimize production processes, improve fuel efficiency, and ensure compliance with stringent regulatory standards. Competitive trends indicate a growing emphasis on lightweight materials and digital integration in part manufacturing. Smaller firms, meanwhile, are enhancing their competitive positioning by offering niche, cost-effective solutions tailored to specific customer needs. Industry-wide, strategies such as joint ventures, supply chain diversification, and aftermarket service expansion are shaping the competitive dynamics.
Honeywell International Inc. is a global company in aerospace, industrial automation, and smart building technologies. Its Industry 4.0 solutions, including Honeywell Forge, integrate IoT, AI, and sustainability can enhance operational efficiency, safety, and energy management across industries. In July 2022, Honeywell partnered with Archer Aviation to supply flight control actuation and thermal management systems, enhancing Archer’s 12 tilt 6 design and in-cabin passenger experience.
Thales Group delivers advanced electronic systems, software, and services across aerospace, defense, and digital security. Its offerings include avionics, satellites, cybersecurity, radar, and biometric solutions, serving commercial, government, and military sectors through its aerospace, defense, and digital identity business segments. In May 2022, Thales collaborated with Dassault Aviation through the signature of a maintenance agreement signed on April 1, 2022, for electrical systems on Falcon 900 and Falcon 2000 Series Fleets.
List of Key Companies
- Ducommun Inc.
- Eaton Corporation plc
- GE Aviation
- Honeywell International, Inc.
- IHI Corp.
- Kawasaki Heavy Industries Ltd.
- Mitsubishi Heavy Industries, Ltd.
- Raytheon Technologies Corp.
- Rolls Royce plc
- Thales Group
Industry Development
- January 2026: Collins Aerospace, an RTX business, announced three-year parts distribution agreements with Integrated Procurement Technologies, S3 AeroDefense and Derco, a Lockheed Martin company. It is expected to enhance hardware and logistics support for brakes and wheels on the C-130 Hercules. (Source: prnewswire.com)
- June 2025: Dassault Aviation and Tata Advanced Systems Limited finalized four Production Transfer Agreements to begin manufacturing fuselages for Rafale fighter aircraft in India. This initiative boosts India’s aerospace production capacity and further integrates the country into global supply chains. (Source: dassaultaviation.com)
- April 2025: Cambium launched ApexShield, a high-temperature resin system that's revolutionizing aerospace manufacturing. Developed with US Department of Defense labs, this innovation produces carbon-carbon components for rocket nozzles and hypersonic vehicles in just 1-2 months instead of 6-9 months, while cutting fabrication costs by 75%. (Source: cambium.com)
- March 2025: GE Aerospace secured a USD 5 trillion indefinite delivery/indefinite quantity contract from the US Air Force to support foreign military sales of F110-GE-129 engines used in F-15 and F-16 aircraft operated by allied nations worldwide. (Source:geaerospace.com)
Market Segmentation
By Product Outlook (Revenue, USD trillion, 2021–2034)
- Aerostructure
- Cabin Interiors
- Engines
- Equipment, System, & Support
- Avionics
- Insulation Components
By End Use Outlook (Revenue, USD trillion, 2021–2034)
- Business Aircraft
- Commercial Aircraft
- Military Aircraft
- Others
By Regional Outlook (Revenue, USD trillion, 2021–2034)
- North America
- US
- Canada
- Europe
- Germany
- France
- UK
- Italy
- Spain
- Netherlands
- Russia
- Rest of Europe
- Asia Pacific
- China
- Japan
- India
- Malaysia
- South Korea
- Indonesia
- Australia
- Rest of Asia Pacific
- Middle East & Africa
- Saudi Arabia
- UAE
- Israel
- South Africa
- Rest of Middle East & Africa
- Latin America
- Mexico
- Brazil
- Argentina
- Rest of Latin America
Report Scope
| Report Attributes | Details |
| Market Size Value in 2025 | USD 1.01 trillion |
| Market Size Value in 2026 | USD 1.07 trillion |
| Revenue Forecast by 2034 | USD 1.60 trillion |
| CAGR | 5.2% from 2026 to 2034 |
| Base Year | 2025 |
| Historical Data | 2021–2024 |
| Forecast Period | 2026–2034 |
| Quantitative Units | Revenue in USD trillion and CAGR from 2026 to 2034 |
| Report Coverage | Revenue Forecast, Market Competitive Landscape, Growth Factors, and Trends |
| Segments Covered |
|
| Regional Scope |
|
| Competitive Landscape |
|
| Report Format |
|
| Customization | Report customization as per your requirements with respect to countries, regions, and segmentation. |
Source: Polaris Market Research Analysis
aerospace parts manufacturing market FAQ's
The global aerospace parts manufacturing market size was valued at USD 1.01 trillion in 2025 and is projected to grow to USD 1.60 trillion by 2034.
The global market is projected to register a CAGR of 5.2% during the forecast period.
North America dominated the market with 42.0% share in 2025.
A few key players in the market are GE Aviation; Honeywell International, Inc.; IHI Corp.; Kawasaki Heavy Industries Ltd.; Mitsubishi Heavy Industries, Ltd.; Rolls Royce plc; Raytheon Technologies Corp.; Ducommun Inc.; Eaton Corporation plc; and Thales Group.
The aerostructure segment led the market with 25.0% share in 2025.
The business aircraft segment is anticipated to register the highest growth rate of 6.2% during the forecast period.
Download Sample Report of aerospace parts manufacturing market
Please fill out the form to request a customized copy of the research report.
