
Air Purifier Market Industry Business Growth, Latest Study, 2026-2034
REPORT DETAILS
Market Statistics
What is the Air Purifier Market Size?
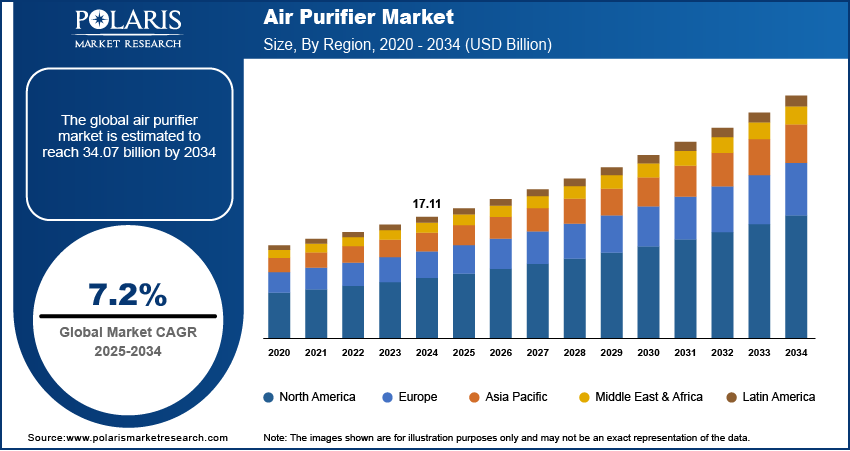
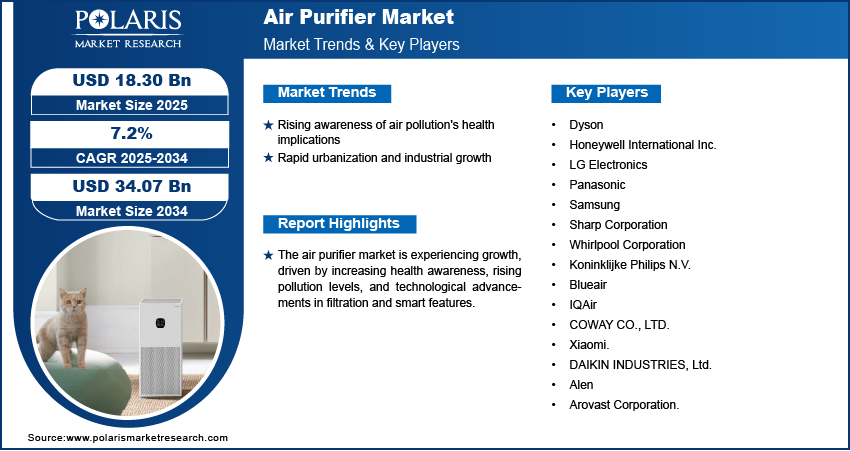
The global air purifier market was valued at USD 18.26 billion in 2025. It is expected to register a CAGR of 7.2% from 2026 to 2034. The market is driven by government regulations and rising disposable incomes. Rising demand for HEPA air purifiers and UV-C air purifiers will fuel the market expansion.
Key Insights
- Asia Pacific led the global market with 35.0% share in 2025. Asia Pacific air purifier market growth is driven by severe pollution in countries such as China and India.
- The North America air purifier market is expected to experience the fastest growth with a CAGR of 6.3%, during the forecast period. Rising health awareness and the imposition of stringent environmental regulations boost the market expansion.
- In 2025, the HEPA filters segment dominated the air purifier industry with 40.0% share. High filtration efficiency and broad use across residential, commercial, and industrial settings are driving the expansion of the HEPA air purifier market.
- The online sales segment is projected to grow at a CAGR of 6.0% during the forecast period. Online air purifier sales are driven by the convenience, extensive product choices, and competitive pricing on online platforms.
- The commercial segment dominated the market revenue share of 28.0% in 2025. The dominance is driven by rising demand from commercial buildings, retail spaces, and hospitality sectors.
Industry Dynamics
- Rising air pollution levels propel the demand for air purifiers.
- Increasing awareness of health conditions related to pollution boosts the market for air purifiers.
- HEPA filters and UV-C systems enhance product efficacy. Rising integration of these technologies will create lucrative market opportunities.
- Growth in urbanization and concerns about indoor air quality (IAQ) in residential and commercial spaces are boosting market adoption.
- Air purifier market restraints are high air purifier maintenance costs and the maintenance requirements of advanced air purifiers.
- Technological advancements in smart and energy-efficient air purifiers present significant growth opportunities.
Market Statistics
- 2025 Market Size: USD 18.26 billion
- Air purifier market forecast 2034: USD 34.15 billion
- Air purifier market CAGR during 2026–2034: 7.2%
- Asia Pacific: Largest market in 2025
AI Impact on Air Purifier Market
- Artificial intelligence technology is used to analyze indoor air quality data to identify pollution sources. They optimize air purifier settings for improved purification efficiency and energy use.
- AI integration facilitates automatic adjustment of filtration levels based on pollutant levels, humidity, and occupancy patterns.
- AI-enabled tools simulate airflow dynamics. They are used to predict filter performance in different environmental conditions.
- The technology helps forecast demand and optimize component usage. It improves supply chain and production efficiency.
Source: Polaris Market Research Analysis
Want a Deeper Look at Key Market Players? Download Sample Report
What is an Air Purifier?
An air purifier removes impurities such as dust, allergens, pollutants, and harmful particles from indoor air. The devices are used to improve indoor air quality (IAQ) and health.
Air purifier use addresses increasing concerns over air quality and pollution by removing contaminants. According to the EPA report published in August 2024, about 66 million tons of air pollution were emitted in the U.S. in 2023. Air pollution reduces visibility, creates ozone and particulate matter, and causes acid rain. The presence of airborne pollutants, such as particulate matter (PM2.5, PM10), volatile organic compounds (VOCs), and allergens, is growing. It impacts public health with rapid urbanization and industrialization. The purifiers mitigate allergens in homes and control harmful emissions in industrial spaces.
Governments and healthcare organizations run awareness campaigns on the adverse health effects of polluted air. This growing awareness underscores the industry's growth. Also, technological advancements and the integration of IoT-enabled purifiers boost the market expansion. In addition, consumers increasingly compare purifiers using objective performance indicators such as CADR and ACH.
How to Choose Air Purifier for Room Size?
Standards and performance metrics influence purchase decisions of commercial buyers and health-conscious households. Air purifier efficacy is evaluated by checking the CADR (Clean Air Delivery Rate) rating. It is required to match CADR rating to room size, alongside air changes per hour (ACH) targets for faster particulate removal. Certifications such as AHAM Verifide verify performance claims under standardized testing protocols. For consumers, such certifications create a clear, comparable framework across HEPA, activated carbon, and hybrid systems. It reduces their confusion and improves purchase confidence.
Market Dynamics
Rising Awareness of Air Pollution's Health Implications
Increasing levels of air pollution lead to the respiratory and cardiovascular diseases such as asthma and bronchitis, allergies, and other health issues. Children and the elderly are more vulnerable to air pollution's effects. Rising PM2.5 exposure is linked to allergy flare-ups and asthma exacerbations. Thus, households and institutions prioritize clinically effective filtration systems, such as air quality control system. There is a rising awareness shift from odor control to respiratory health management. Consumers seek solutions that can capture fine particulates and allergens. HEPA filters are trusted for consistent PM2.5 and allergen removal. Hence, the rising awareness of air pollution's health implications fuels the industry growth.
Rapid Urbanization and Industrialization
Various countries across the world are witnessing rapid urbanization and industrialization. Increasing urban population and industrial expansion lead to growing air pollution. Expanding urban cities experience rising construction dust, and industrial discharge. Also, vehicle emissions have become a one of the serious concerns across various countries. The rising population density in urban areas boosts energy consumption and indoor air pollutants. Owing to these factors, air quality is declining as pollution levels increase. Thus, commercial air purifiers are installed across schools, hospitals, and other public places. Purifiers maintain consistent IAQ in these high-occupancy environments. Air purifiers mitigate the adverse effects of urbanization and industrialization. Thus, rapid urbanization and industrial growth drive the demand for air purifiers.
What is the Impact on Regulations and Certifications on the Air Purifier Market?
Governments of various countries impose stringent air quality regulations. In August 2022, Congress passed the Inflation Reduction Act. It provided the EPA with USD 41.5 billion to address the climate crisis. Over USD 11 billion of this will help ensure clean air and a safe climate for Americans. Such regulations boost the adoption of air purifiers in residential, commercial, and industrial settings.
| Region/Regulatory Body | Key Standards and Certifications | Impact on Air Purifier Industry |
| U.S. |
|
|
| European Union |
|
|
| India |
|
|
| International Standards |
|
|
| Other Regional Schemes |
|
|
Source: Polaris Market Research Analysis
Total Cost of Ownership (TCO) & Maintenance
Amount of energy consumption during high fan speeds influences TCO. The frequent increase in filter replacement costs and HEPA filter replacement can hinder purchase decisions of consumers. Also, periodic servicing in commercial deployments can raise maintenance costs. The explanation of the simple “annual operating cost” improves buyer clarity. It reduces purchase friction, particularly in price-sensitive regional markets, such as Asia Pacific.
Source: Polaris Market Research Analysis
Get Full Segment-Level Forecasts & Insights: Download Sample Report
Segment Assessment
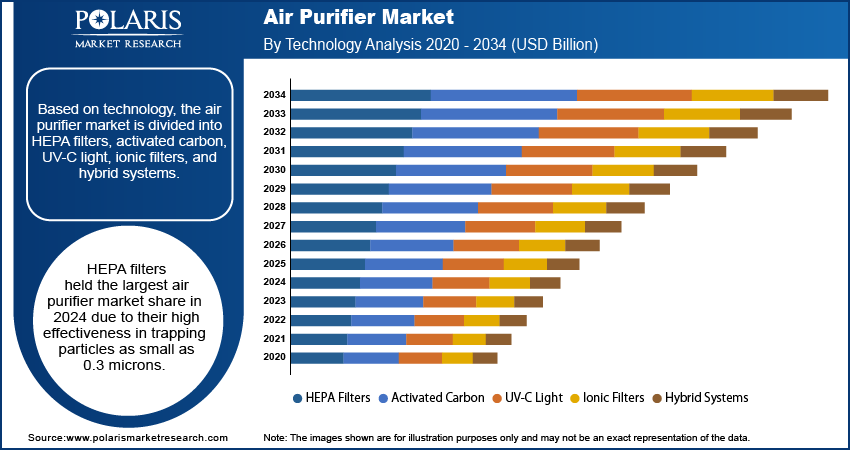
By Technology Outlook
The segmentation includes HEPA filters, activated carbon, UV-C light, ionic filters, and hybrid systems. The HEPA filters segment held the largest revenue capturing 40.0% share in 2025. High-Efficiency Particulate Air (HEPA) filters lead in CADR for particulate removal. HEPA filters efficiently capture dust, pollen, pet dander, allergens, and other airborne particles. Their rising adoption across residential, commercial, and industrial applications propels dominance. Additionally, the increasing awareness of respiratory health propels the requirement for HEPA filters. Growing concerns over air pollution fueled the HEPA air purifier market share. They are compatible with advanced filtration systems. Their integration into hybrid air purification technologies also strengthened segment growth. Stringent indoor air quality regulations boost the demand for HEPA air purifiers.
Comparison Matrix: HEPA Filters vs. Activated Carbon vs. UV-C Light in Air Purifiers
| Feature | HEPA Filters | Activated Carbon Filters | UV-C Light |
| Full Form | High-Efficiency Particulate Air | Porous Carbon-Based Adsorption Filter | Ultraviolet-C Germicidal Light |
| Primary Function | Captures airborne particles | Removes odors, gases, and VOCs | Inactivates bacteria, viruses, and mold spores |
| Key application | Removal of dust, pollen, pet dander, PM2.5, and smoke particles | Removal of smoke smell, cooking odors, chemicals, and VOCs | Germ control and microbial reduction |
| Working Principle | Mechanical filtration through dense fiber mesh | Adsorption of gas molecules on porous carbon surface | UV radiation damages microbial DNA/RNA |
| Filter Replacement | Every 6–12 months | Every 3–6 months | UV lamp replacement after long usage |
| Maintenance Cost | Moderate | Moderate to High | Low to Moderate |
| Limitations | Cannot remove gases or odors | Cannot trap fine particles effectively | Does not remove dust or odors; effectiveness depends on exposure time |
| Ideal Usage | Allergy relief, pollution control | Kitchen smoke, pet smells, VOC control | Hospitals, clinics, hygiene-focused environments |
Source: Polaris Market Research Analysis
By Distribution Channel Outlook
Based on distribution channel, the segmentation includes online and offline. The online segment would register a growth rate of 8.6% in the coming years. Online retail channels provide convenience and transparency. Wider product availability and competitive pricing propel online air purifier sales. On e-commerce platforms, consumers can compare air purifier reviews, features, and prices. Also, online consumers rely on verified CADR rating and certifications. Performance verification content boosts online conversion. The adoption of smartphones and 5G connectivity is rising globally. It boosts e-commerce air purifier market trends. Free delivery and flexible payment options attract consumers. Industry players implement strategies, including digital marketing and product discounts. It boosts sales on these platforms.
Key Use Cases
- Air purifiers for schools: High CADR and low noise are priorities. Predictable filter replacement schedules for classrooms are required.
- Air purifiers for hospitals: Hospitals focus on HEPA deployment and strong operational uptime. In-duct systems are considered for controlled environments.
- Office air purifiers: Offices emphasize sensor-based auto modes for variable occupancy and energy efficiency.
- Industrial and cleanrooms: In these environments, filtration systems are used to remove process-specific particulates and VOCs. HVAC integration is done for continuous IAQ control.
Source: Polaris Market Research Analysis
Need Granular Data Across All Market Segments? Request Customization
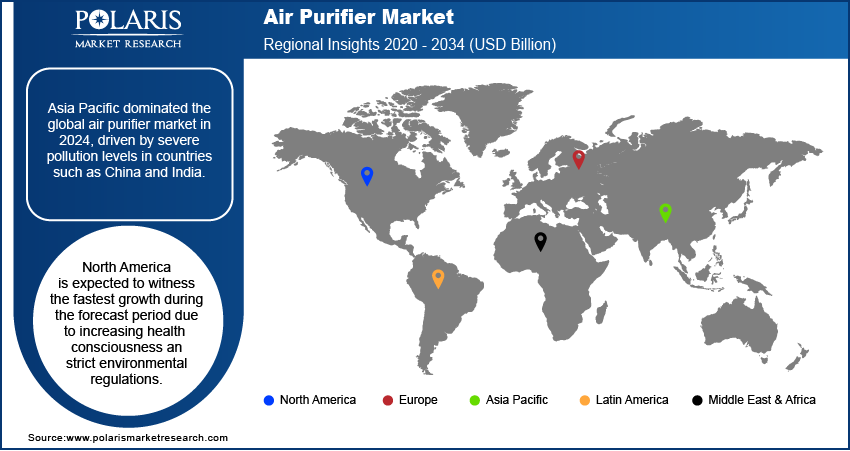
By Region
By region, the report covers North America, Europe, Asia Pacific, Latin America, and the Middle East & Africa. Asia Pacific dominated the global market with a share of 35.0% in 2025. Increasing pollution levels in countries such as China and India drive the demand for air purifiers in the region. The Indian government announced various initiatives to combat air pollution, such as subsidies for air purifier adoption. It runs awareness campaigns for air pollution controls. According to a December 2023 report by the Ministry of Environment, Forest, and Climate Change, the government allocated USD 1.158 billion to 131 cities. The allocation is done under the National Clean Air Programme (NCAP). The investment was announced to address air pollution from FY 2019-20 to FY 2023-24. Additionally, rising disposable incomes and urbanization boost the market demand.
The North America air purifier industry is expected to witness the fastest growth with a CAGR of 8.9%, during the forecast period. Increasing health consciousness propels the demand for solutions, such as air filters. Also, stringent environmental regulations drive the market growth. The U.S. leads the regional market. Technological advancements and higher adoption rates of smart air purifiers drive the U.S. air purifier market. The robust presence of key players and high R&D investments boost the leading position.
Source: Polaris Market Research Analysis
Curious About Regional Market Performance? Request Customization
Key Market Players and Competitive Analysis Report
The market witnesses intense competition. Major players are increasingly investing in research and development (R&D). It will help them expand their offerings in the global market. Top 15 companies collectively dominated the market. They emphasize technological innovation and strategic partnerships. Companies are expanding their distribution networks. Major players aim to introduce advanced, IoT-enabled air filters to enhance user experience. Meanwhile, regional players cater to price-sensitive markets. They focuse on offering affordable, high-performance purifiers. Market players aim to hold a significant market share. Thus, they focus on strategies such as mergers, acquisitions, and product diversification.
Key Companies
- Dyson
- Honeywell International Inc.
- LG Electronics
- Panasonic
- Samsung
- Sharp Corporation
- Whirlpool Corporation
- Koninklijke Philips N.V.
- Blueair
- IQAir
- COWAY CO., LTD.
- Xiaomi.
- DAIKIN INDUSTRIES, Ltd.
- Alen
- Arovast Corporation.
Market Development
March 2026: Coway introduced the Airmega Mighty2 AP-1512N. It is the next-generation version of its Airmega Mighty AP-1512HH air purifier. The new air purifier combines the Mighty's original performance with a new modernized design. It has enhanced control panel. (Source: prnewswire.com)
In August 2024, Daikin launched two plug-and-play air purifier models—MCK70Z and MC80Z. The models have integrated sensors to measure indoor air quality. They rely on the Google Maps Platform to obtain outdoor air quality data. (Source: daikin.eu)
June 2024: Coway launched the Airmega 100 air purifier in Europe. The purifier features 360° air intake and a 3-stage HEPA filtration system. It has real-time air quality indicators. Designed for smaller spaces, it addresses hay fever and allergy concerns. It contains energy-saving technology and quiet operation. (Source: conway.com)
Future of Air Purifier Market
As per our market analysis, the air purifier industry is expected to witness rapid expansion in the coming years. Rising air pollution levels and increasing health awareness are expected to boost the demand for air purifiers across the world. Growing prevalence of respiratory diseases and the surging concerns of indoor air quality will drive the product demand. Demand for smart air purifiers with IoT connectivity, real-time air quality monitoring, and energy-efficient technologies is projected to rise significantly. Additionally, innovations in HEPA, activated carbon, and UV-C purification technologies will improve product performance and consumer preference.
Air Purifier Market Segmentation
By Technology Outlook (Revenue, USD Billion, 2021–2034)
- HEPA Filters
- Activated Carbon
- UV-C Light
- Ionic Filters
- Hybrid Systems
By Application Outlook (Revenue, USD Billion, 2021–2034)
- Residential
- Commercial (Offices, Hospitals, and Schools)
- Industrial
By Distribution Channel Outlook (Revenue, USD Billion, 2021–2034)
- Online
- Offline
By Coverage Range Outlook (Revenue, USD Billion, 2021–2034)
- Below 250 Sq. Ft.
- 250–400 Sq. Ft.
- 401–700 Sq. Ft.
- Above 700 Sq. Ft.
By Type Outlook (Revenue, USD Billion, 2021–2034)
- Standalone/Portable
- In-duct/Fixed
By Regional Outlook (Revenue, USD Billion, 2021–2034)
- North America
- U.S.
- Canada
- Europe
- Germany
- France
- UK
- Italy
- Spain
- Netherlands
- Russia
- Rest of Europe
- Asia Pacific
- China
- Japan
- India
- Malaysia
- South Korea
- Indonesia
- Australia
- Vietnam
- Rest of Asia Pacific
- Middle East & Africa
- Saudi Arabia
- UAE
- Israel
- South Africa
- Rest of Middle East & Africa
- Latin America
- Mexico
- Brazil
- Argentina
- Rest of Latin America
Air Purifier Market Report Scope
| Report Attributes | Details |
| Market Size in 2025 | USD 18.26 Billion |
| Market Size in 2026 | USD 19.51 Billion |
| Revenue Forecast by 2034 | USD 34.15 Billion |
| CAGR | 7.2% from 2026 to 2034 |
| Base Year | 2025 |
| Historical Data | 2021–2024 |
| Forecast Period | 2026–2034 |
| Quantitative Units | Revenue in USD billion, 2021–2034 and CAGR from 2026 to 2034 |
| Report Coverage | Revenue Forecast, Market Competitive Landscape, Growth Factors, and Trends |
| Segments Covered |
|
| Regional Scope |
|
| Competitive Landscape |
|
| Report Format | PDF + Excel |
| Customization | Report customization as per your requirements with respect to countries, regions, and segmentation. |
Source: Polaris Market Research Analysis
Air Purifier Market FAQ's
The global air purifier market was valued at USD 18.26 billion in 2025. It is projected to reach USD 34.15 billion by 2034. The growth is attributed to increasing concerns on air pollution and health awareness.
The HEPA filters segment led the market in 2025. HEPA filters can capture 99.97% of airborne particles. Thus, it is a dominating segment. UV-C and hybrid multi-stage systems are emerging as the fastest-growing technologies for pathogen control.
Asia Pacific dominated the global market share in 2025. China, India, Japan, and South Korea are leading markets in the region. North America and Europe follow with strong smart-home integration and stricter air quality regulations. These factors are driving adoption of air purifiers in these regions.
Demand for smart IoT-enabled air purifiers is growing significantly. The purifiers offer real-time air quality monitoring. They also have features such as voice control and predictive filter alerts. Premium purifiers cost 25–30% more. However, they deliver enhanced health benefits and convenience.
Commercial sectors such as schools, hospitals, offices, and hotels are increasingly adopting air purifiers. Stricter indoor air quality mandates, infection control needs, and enhanced guest wellness expectations boost the adoption.
Ionizers and ozone-generating purifiers are generally not considered safe. They are not preferred as primary indoor air cleaners. Their demand is declining due to ozone production and lower effectiveness than filtered purifiers.
The common long-term cost for most air purifiers is replacing filters. Electricity consumption at higher fan speeds and maintenance for commercial installations influence the operating costs.
HEPA targets particulate matter (PM2.5/PM10). Activated carbon helps lower VOCs and odors from indoor air. Many consumers prefer hybrid air purifiers for mixed pollutants.
Download Sample Report of Air Purifier Market
Please fill out the form to request a customized copy of the research report.
