
Reports

Aircraft Leasing Market Opportunity and Global Report, 2026-2034
REPORT DETAILS
REPORT DETAILS
ABOUT THIS REPORT
Market Statistics
Market Overview
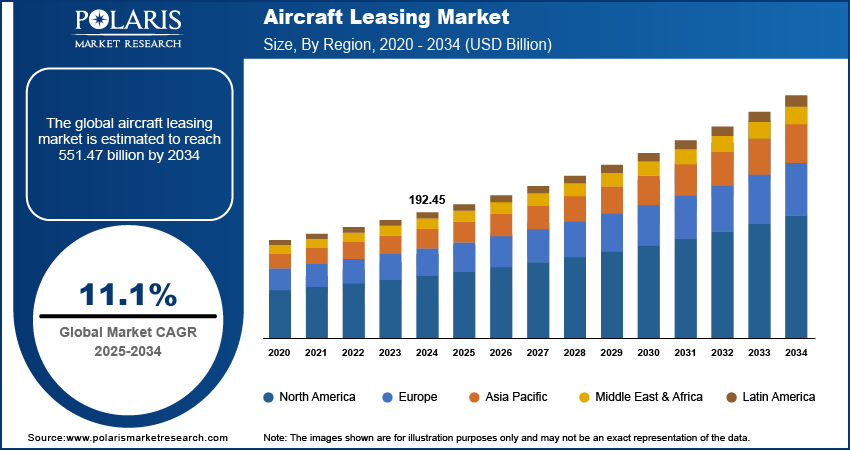
The global aircraft leasing market size was valued at USD 213.4 billion in 2025 and is projected to grow at a CAGR of 11.2% during the forecast period. Increasing passenger demand, growing need for fleet modernization, and fluctuating fuel prices are the key factors driving the growth of the aircraft leasing market.
Key Insights
- The operating lease segment has the biggest market share at 82.91%. This is because it is flexible and helps airlines save money.
- The narrow-body aircraft segment has the largest market share at 67.17%. As these planes are efficient and work well on busy domestic routes.
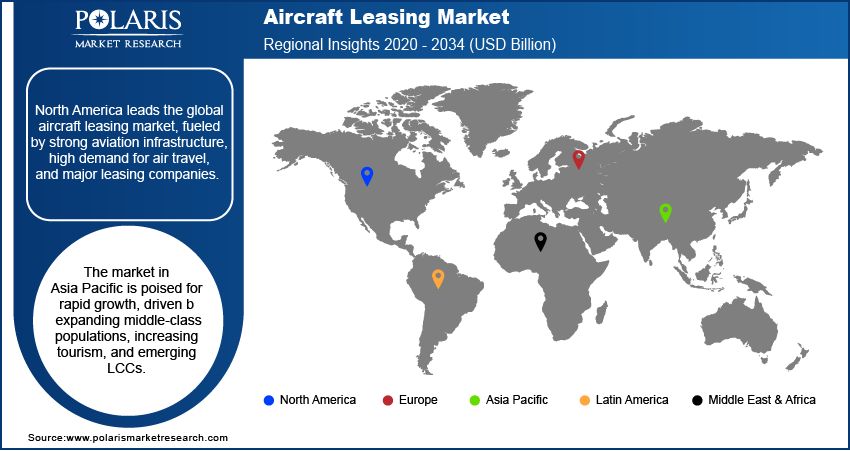
- North America has the biggest share of the global market, with 49.80%. This is because it has a strong aviation infrastructure and major leasing companies are based there.
- Asia Pacific is expected to grow steadily, with a CAGR of 11.5%. This is because more people are becoming middle-class and more people are traveling within the region.
Industry Dynamics
- The growing preference for air travel, fueled by improved economic conditions in regions such as the Asia Pacific and Latin America, is driving airlines to adopt aircraft leasing to meet rising demand.
- The cost savings and operational flexibility offered by aircraft leasing make it an attractive option and contribute to market expansion.
- The shift towards operating leases is expected to provide several market opportunities in the coming years.
- The high initial cost associated with aircraft leasing may present challenges to market growth.
Market Statistics
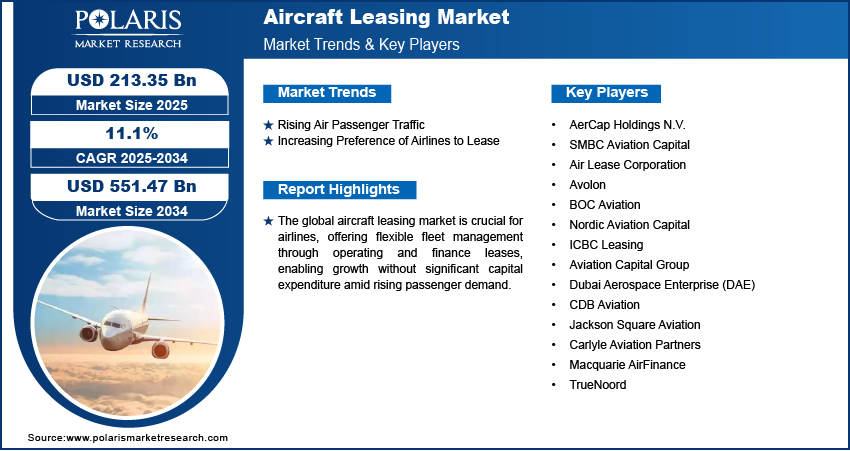
- 2025 Market Size: USD 213.4 Billion
- 2034 Projected Market Size: USD 551.5 Billion
- CAGR (2026–2034): 11.2%
- North America: Largest Market Share in 2025
To Understand More About this Research: Download Sample Report
The global aircraft leasing market plays a pivotal role in the aviation industry, enabling airlines to expand their fleets efficiently without significant upfront capital expenditure. Aircraft leasing involves two primary models—operating leases and finance leases. This market caters to the needs of airlines, particularly low-cost carriers (LCCs), by providing flexible fleet management solutions and mitigating the financial burden of purchasing aircraft outright. Increasing passenger demand, fluctuating fuel prices, and the rising demand for fleet modernization are driving the aircraft leasing market demand by both established and emerging airlines worldwide
Market Dynamics
Growing Demand for Air Travel
More people are opting for air travel, driven by improving economic conditions in regions such as Asia Pacific, Africa, and Latin America. Airlines face the challenge of scaling their fleets to meet this demand but often lack the capital to purchase new aircraft. Aircraft leasing offers a cost-effective solution, allowing airlines to expand their fleets quickly without substantial upfront investments. The demand for passenger and cargo flights has driven the need for flexible fleet solutions. Therefore, the increasing global demand for air travel, particularly in emerging markets, is a major driver of the aircraft leasing market expansion.
Cost Efficiency and Flexibility
Aircraft leasing provides airlines with significant cost savings and operational flexibility, making it an attractive option. Leasing eliminates the high initial capital outlay associated with purchasing aircraft, which is particularly important for airlines seeking to optimize their balance sheets or manage cash flow. Furthermore, leases offer flexibility in terms of fleet management, allowing airlines to adjust their fleets based on seasonal demand fluctuations or market conditions. This flexibility helps airlines stay competitive while minimizing the risks associated with long-term ownership of expensive assets. Leasing also allows carriers to access newer aircraft models, improving fuel efficiency and reducing maintenance costs. Hence, benefits such as cost efficiency and flexibility boost the aircraft leasing market expansion.
Segment Assessment
Market Assessment by Lease Type
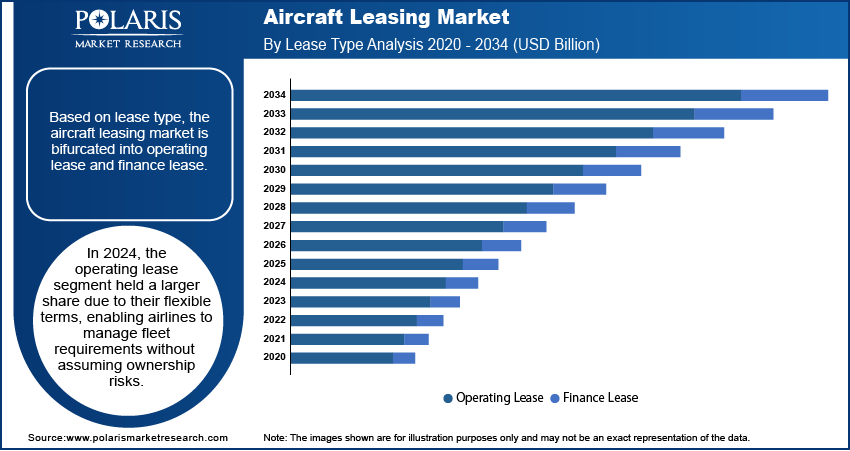
The aircraft leasing market assessment, based on lease type, include operating leases and finance leases. The operating lease segment holds a larger market share due to its flexibility and reduced financial burden for airlines. Operating leases typically have shorter terms compared to finance leases, allowing airlines to adapt quickly to changing market conditions or fleet requirements. These leases provide airlines with the ability to return aircraft without taking ownership risks, offering substantial financial flexibility. Airlines can scale fleets up or down based on demand fluctuations, reducing long-term commitments and capital expenditure, thus enhancing operational efficiency and minimizing risk exposure.
Evaluation by Aircraft Type
The aircraft leasing market evaluation, based on aircraft type, include wide body aircraft and narrow body aircraft. The narrow body aircraft segment dominates the market due to their operational efficiency and suitability for high-demand domestic and short-haul international routes. These aircraft offer lower operating costs related to fuel and maintenance, making them a preferred choice for airlines operating across regions with dense air traffic. Their smaller size allows them to access airports with limited infrastructure, enhancing flexibility. The surge in regional air travel and the expansion of low-cost carriers further drive demand for narrow-body aircraft, contributing significantly to their aircraft leasing market share.
Outlook by Region
North America dominates the global aircraft leasing market share, driven by a combination of robust aviation infrastructure, high demand for air travel, and the presence of major leasing companies. According to the North America Airport Council, in 2025, North American airports services reported an increase in the volume of international passengers, with a year-over-year increase of 27.9% compared to 2022. Domestic passenger traffic also witnessed a substantial uptick, rising by 9.5% during the same period. Notably, five US airports ranked among the world's top 10 busiest airports in terms of total passenger throughput, showcasing high demand for air travel. These factors collectively create an environment where the leasing market thrives, supporting both domestic and international aviation operations.
The aircraft leasing market statistics in Asia Pacific is poised for significant growth, driven by expanding middle-class populations, increasing domestic tourism, and emerging low-cost carriers. China leads the regional market share, fueled by robust government support for aviation expansion and significant investments in fleet modernization. According to the State Council of the People’s Republic of China, in 2023, the Chinese government allocated ∼USD 16.2 billion to invest in the civil aviation sector, showcasing growth in government investment to support aviation expansion.
Key Players and Competitive Analysis Report
Major market players dominate the aircraft leasing market stats through extensive global networks, diverse portfolios, and strategic partnerships with airlines and manufacturers. AerCap's acquisition of GECAS solidifies its market leadership, while SMBC and Avolon leverage strong financial backing to expand their fleets. BOC Aviation and CDB Aviation capitalize on their proximity to the Asia Pacific growth epicenter. Each key player employs strategies such as fleet optimization, sustainable aviation investments, and customer-centric leasing models to maintain competitive edges, shaping the aircraft leasing market expansion.
Dubai Aerospace Enterprise (DAE) is an aviation services company based in Dubai, United Arab Emirates. Established in 2006, it operates through two main divisions which include DAE Capital and DAE Engineering. The company is indirectly owned by the Investment Corporation of Dubai (ICD), the principal investment arm of the Government of Dubai. DAE Capital focuses on aircraft leasing and managing a fleet of Airbus, ATR, and Boeing aircraft. This division is involved in acquiring, leasing, and trading aircraft, as well as managing aircraft on lease for other investors. DAE Engineering provides maintenance, repair, and overhaul (MRO) services from its facility at Queen Alia International Airport in Amman, Jordan. The facility can handle up to 17 aircraft and is authorized to work on several aircraft types with regulatory approval from multiple global regulators. DAE serves over 170 airline customers across more than 65 countries, with operations in Dubai, Dublin, Amman, Singapore, Miami, New York, and Seattle. DAE Capital's leasing activities are global, while DAE Engineering primarily serves Europe, the Middle East, Africa, and South Asia.
Air Lease Corporation (ALC) is an American aircraft leasing company founded in 2010 by Steven F. Udvar-Házy. Based in Los Angeles, California, ALC purchases new commercial aircraft from major manufacturers like Boeing, Airbus, Embraer, and ATR and leases them to airlines worldwide. As of September 2024, ALC's fleet includes 485 owned aircraft and 64 managed aircraft, with a significant order book of 287 new aircraft from Airbus and Boeing. This fleet composition reflects ALC's role in providing aircraft to airlines globally. ALC's business is primarily focused on commercial aircraft leasing, capital markets, trading, aircraft financing, remarketing, and sales. The company leases aircraft to airlines, allowing them to operate modern fleets without the need for outright purchases. In the capital markets, ALC works with financial institutions to provide financing solutions for aircraft acquisition and operational expenses. Additionally, it engages in trading aircraft, engines, and components to manage fleet operations for clients. This approach enables ALC to support airlines in managing their aircraft portfolios. Air Lease Corporation operates globally, serving airlines across multiple regions, including North America, Europe, Asia Pacific, the Middle East and Africa, and Latin America.
List of Key Companies
- AerCap Holdings N.V.
- Air Lease Corporation
- Aviation Capital Group
- Avolon
- BOC Aviation
- Carlyle Aviation Partners
- CDB Aviation
- Dubai Aerospace Enterprise (DAE)
- ICBC Leasing
- Jackson Square Aviation
- Macquarie AirFinance
- Nordic Aviation Capital
- SMBC Aviation Capital
- TrueNoord
Aircraft Leasing Industry Development
February 2026: BlueFive Capital started a new platform for leasing planes called BlueFive Leasing. The company wants to help airlines by giving them various financing choices and growing its business in the global aircraft leasing sector. (Source: bluefivecapital.com)
April 2026: India made changes to make its aircraft leasing industry easier to utilize. These reforms are meant to make it easier for businesses to do business and attract more investors and leasing companies. (Source: ainonline.com)
April 2026: Indonesia said it would start an aircraft leasing fund with a goal of USD 800 million. The goal of the fund is to make the country's aviation industry stronger. (Source: asianaviation.com)
May 2025: Dubai Aerospace Enterprise (DAE) Ltd announced the completion of the acquisition of Nordic Aviation Capital (NAC). DAE stated the acquisition will bring its combined fleet to over 750 aircraft. (Source: dubaiaerospace.com)
April 2025: Aviation Capital Group (AGC) signed a definitive agreement with Avolon Aerospace Leasing Limited. AGC stated that the agreement is intended to purchase 20 aircraft from Avolon. The portfolio includes 16 narrowbody and four widebody aircraft. (Source: aviationcapitalgroup.com)
May 2024: Hanwha, a multinational corporation operating in various industries such as clean energy, petrochemicals, and leisure, announced the launch of Hanwha Aviation, a new platform for leasing and trading aircraft and engines. (Source: hanwha.com)
Aircraft Leasing Market Segmentation
By Lease Type Outlook (Revenue, USD Billion, 2021–2034)
- Operating Lease
- Finance Lease
By Aircraft Type Outlook (Revenue, USD Billion, 2021–2034)
- Wide Body Aircraft
- Narrow Body Aircraft
By Airline Type Outlook (Revenue, USD Billion, 2021–2034)
- Full-Service Carriers
- Low-Cost Carriers
- Carter Airline
By Regional Outlook (Revenue, USD Billion, 2021–2034)
- North America
- US
- Canada
- Europe
- Germany
- France
- UK
- Italy
- Spain
- Netherlands
- Russia
- Rest of Europe
- Asia Pacific
- China
- Japan
- India
- Malaysia
- South Korea
- Indonesia
- Australia
- Vietnam
- Rest of Asia Pacific
- Middle East & Africa
- Saudi Arabia
- UAE
- Israel
- South Africa
- Rest of Middle East & Africa
- Latin America
- Mexico
- Brazil
- Argentina
- Rest of Latin America
Aircraft Leasing Market Report Scope
| Report Attributes | Details |
| Market Size Value in 2025 | USD 213.4 billion |
| Market Size Value in 2026 | USD 236.6 billion |
| Revenue Forecast in 2034 | USD 551.5 billion |
| CAGR | 11.2% from 2026 to 2034 |
| Base Year | 2025 |
| Historical Data | 2021–2024 |
| Forecast Period | 2026–2034 |
| Quantitative Units | Revenue in USD Billion and CAGR from 2026 to 2034 |
| Report Coverage | Revenue Forecast, Market Competitive Landscape, Growth Factors, and Trends |
| Segments Covered |
|
| Regional Scope |
|
| Competitive Landscape |
|
| Report Format |
|
| Customization | Report customization as per your requirements with respect to countries, regions, and segmentation. |
FAQ's
The global aircraft leasing market size was valued at USD 213.4 billion in 2025 and is projected to grow to USD 551.5 billion by 2034.
The global market is projected to register a CAGR of 11.2% during the forecast period.
North America held the largest share of the global market in 2025.
A few of the key players in the market are AerCap Holdings N.V., SMBC Aviation Capital, Air Lease Corporation, Avolon, BOC Aviation, Nordic Aviation Capital, ICBC Leasing, Aviation Capital Group, Dubai Aerospace Enterprise (DAE), CDB Aviation, Jackson Square Aviation, Carlyle Aviation Partners, Macquarie AirFinance, and TrueNoord.
The operating lease segment held a larger share in 2025 due to their flexible terms, enabling airlines to manage fleet requirements without assuming ownership risks.
Download Sample Report of Aircraft Leasing Market
Please fill out the form to request a customized copy of the research report.
