

What is Asia Pacific Aquaponics Market Size?
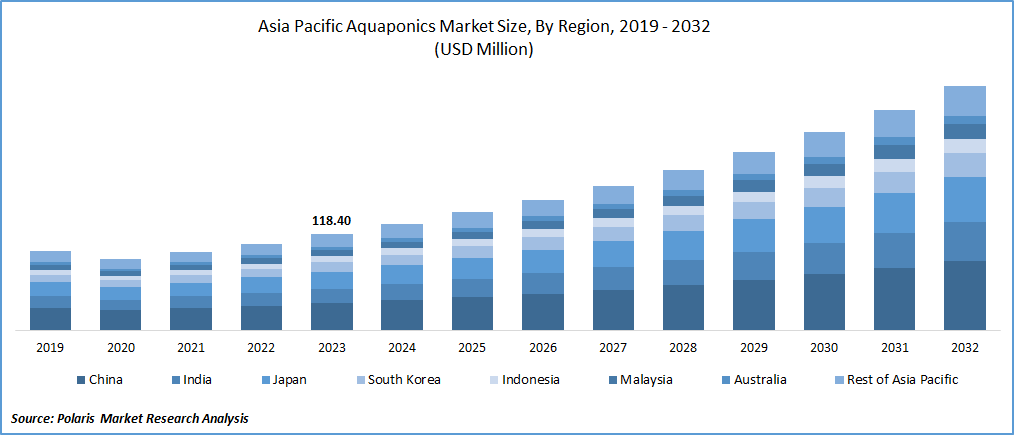
The Asia Pacific aquaponics market was valued at USD 145.31 Million in 2025 and is expected to grow at a CAGR of 11.1% during the forecast period.
Market Statistics
- 2025 Market Size: USD 145.31 Million
- 2034 Projected Market Size: USD 373.52 Million
- CAGR (2026-2034): 11.1%
- Largest Market: China
The Asia Pacific aquaponics market is expected to experience significant growth due to the growing emphasis on sustainable and environment-friendly food production methods. There is a high projected growth in the region, increasing awareness about the environmental impact of traditional agriculture, growing population and urbanization leading to increased demand for locally produced food, and government support for sustainable agriculture practices.
For instance, in the Asia Pacific region, the Pongamia Farm in Thailand uses a closed-loop system that combines fish farming and hydroponic plant cultivation, producing both fresh vegetables and protein-rich fish. The farm's innovative use of pongamia trees as a nutrient source for the fish has helped it become a successful and sustainable business model.
To Understand More About this Research: Request a Free Sample Report
In addition, the pandemic-like situation has accelerated interest in indoor and vertical farming methods like aquaponics, which can provide a reliable source of fresh produce even during lockdowns or supply chain disruptions.
However, there are also some challenges facing the industry, such as high initial investment costs, limited availability of skilled labor, and the need for standardized regulations across different countries in the region. Also, the import restrictions on foreign seeds and fertilizers pose a challenge to the industry players.
Growth Drivers
Continuous Declining Per Capita Land Holding is Creating the Need For Unique Solutions Like Aquaponics
The continuous decline in per capita land holdings in the Asia Pacific region has created a critical need for innovative and sustainable agricultural practices. Aquaponics, a method of growing plants and fish together in a symbiotic environment, offers a unique solution to this challenge. By using water instead of soil to cultivate crops, aquaponics can significantly reduce the amount of land required for farming, making it an attractive option for small-scale farmers and urban communities. For example, in densely populated cities like Tokyo, Japan, where land is scarce, aquaponics has been used to create rooftop gardens that produce fresh vegetables and fish while minimizing the use of space. This not only helps address food security concerns but also provides a sustainable way to meet the increasing demand for locally-grown produce. Thus, the declining per capita land holdings in the Asia Pacific region are expected to drive the growth of the aquaponics market in the coming years.
Key Trends in Aquaponics
|
Trend |
Description |
|
IoT and AI Automation |
Sensors monitor pH, nutrients, temperature; AI enables real-time adjustments and predictive analytics for optimal yields. |
|
Vertical Farming |
Space-efficient stacked systems for urban environments, supporting year-round production of greens and herbs. |
|
Nanobubble Technology |
Fine bubble systems enhance biofiltration, water clarity, and oxygen levels, reducing maintenance. |
|
Renewable Energy Use |
Solar-powered setups lower costs and emissions, boosting viability in off-grid or commercial operations. |
|
Crop Diversification |
Beyond leafy greens to fruiting crops like tomatoes and strawberries via optimized nutrient solutions. |
|
Closed-Loop Efficiency |
Up to 90% less water than soil farming, with waste from fish fertilizing plants in sustainable cycles. |
Report Segmentation
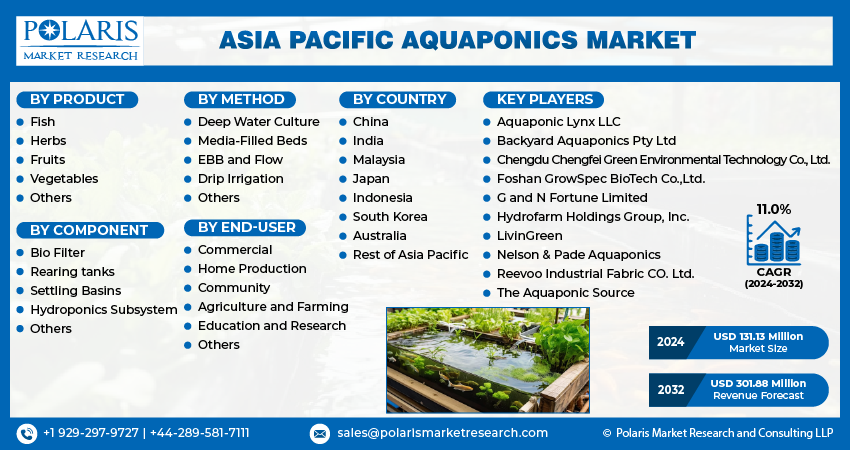
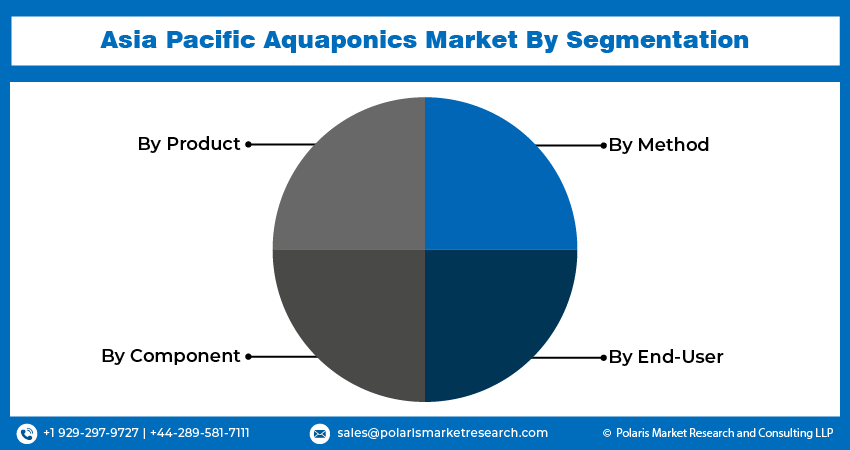
The market is primarily segmented based on product, component, method, end-user, and country.
|
By Product |
By Component |
By Method |
By End-User |
By Country |
|
|
|
|
|
To Understand the Scope of this Report: Speak to Analyst
By Product Analysis
The Fish Segment Within Product Held the Dominating Revenue Share in 2025
In 2025, the fish segment within the product category held the dominant revenue share in the Asia Pacific aquaponics market. This was attributed to the rising demand for novel approaches to fish farming, as well as the increasing consumption of fish and its byproducts. Aquaponics offers an efficient way to produce fish without the use of chemicals or antibiotics, making it an attractive option for consumers who are looking for more natural and sustainable food sources.
In addition, the ability to produce a wide variety of fish species using aquaponics systems, such as tilapia, catfish, and trout, has further contributed to the segment's growth. The fish produced through aquaponics are often perceived as of higher quality and nutrition than those raised using traditional methods, which has led to increased consumer preference for aquaponic fish. All these factors have collectively contributed to the fish segment's dominant revenue share in the Asia Pacific aquaponics market.
By Method Analysis
The Media-filled Beds Segment Dominated the Market in 2025
The media-filled bed segment dominated the Asia Pacific aquaponics market in 2025 as it allows for maximum exposure of roots to oxygen and nutrients, resulting in faster growth rates and higher crop yields. Media-filled beds, also known as floating rafts or nutrient film technique (NFT) systems, are a popular choice for aquaponic farming in the region because they offer high yields and efficient use of water. In this system, plants are grown on a platform with a continuous flow of nutrient-rich water, which is recirculated throughout the system.
In addition, media-filled beds can be easily integrated into existing agricultural systems, making them an adaptable option for both small-scale and commercial farmers. Also, the closed-loop nature of aquaponics systems helps reduce water waste and minimize environmental impact, aligning with the increasing demand for sustainable farming practices in the Asia Pacific region.
Country Insights
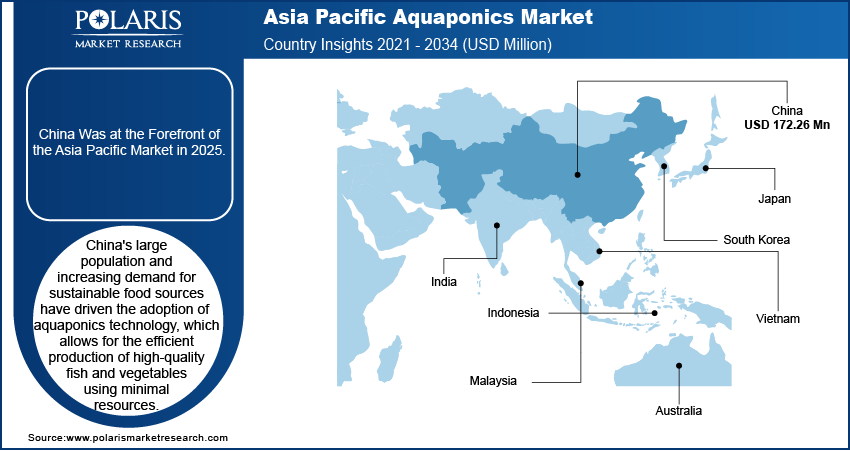
China Was at the Forefront of the Asia Pacific Market in 2025
China was a dominant country in the Asia Pacific aquaponics market in 2025, owing to the country's promoting and investing in agricultural innovation activities, including in aquaponics, as part of its efforts to improve food security and reduce environmental impact. This supportive government policy has created an enabling environment for the growth of the aquaponics industry in China. In addition, China's large population and increasing demand for sustainable food sources have driven the adoption of aquaponics technology, which allows for the efficient production of high-quality fish and vegetables using minimal resources.
Further, China's well-established supply chain infrastructure and access to low-cost labor have made it easier for companies to set up and operate large-scale aquaponics facilities. Thus, Chinese companies have been aggressively expanding their presence in international markets through partnerships and acquisitions, further solidifying China's position as a leader in the global aquaponics industry.
Key Market Players & Competitive Insights
The manufacturer has been actively involved in the Asia Pacific aquaponics market, recognizing the increased need for food production in the region. They have started establishing partnerships with local farmers and organizations to promote the use of their innovative aquaponics systems, which are designed to be efficient, scalable, and adaptable to different climates and environments. The manufacturer has also invested in research and development to improve the technology and make it more accessible to small-scale farmers and communities.
Some of the major players operating in the Asia Pacific market include:
- Aquaponic Lynx LLC
- Backyard Aquaponics Pty Ltd
- Chengdu Chengfei Green Environmental Technology Co., Ltd.
- Foshan GrowSpec BioTech Co.,Ltd.
- G and N Fortune Limited
- Hydrofarm Holdings Group, Inc.
- LivinGreen
- Nelson & Pade Aquaponics
- Reevoo Industrial Fabric CO. Ltd.
- The Aquaponic Source
Recent Developments
- November 2025: Hydrofarm Holdings Group reduced its manufacturing footprint by nearly 60% compared to early 2023 while pivoting toward proprietary brands, aligning its strategy to better support controlled-environment agriculture, including aquaponics.
- 2022, the state government of Sikkim in India declared its adoption of contemporary farming methodologies such as hydroponic, aquaponic, and rooftop farming. The primary objective of implementing these techniques is to enhance productivity, particularly in small private landholdings, and to assure financial benefits for cultivators.
Asia Pacific Aquaponics Market Report Scope
|
Report Attributes |
Details |
|
Market size in 2025 |
USD 145.31 mllion |
| Market size in 2026 | USD 161.09 mllion |
|
Revenue Forecast in 2034 |
USD 373.52 million |
|
CAGR |
11.1% from 2026 – 2034 |
|
Base year |
2025 |
|
Historical data |
2021 – 2024 |
|
Forecast period |
2026 – 2034 |
|
Quantitative units |
Revenue in USD million and CAGR from 2026 to 2034 |
|
Segments Covered |
By Product, By Component, By Method, By End-user, By Country |
|
Country scope |
China, India, Malaysia, Japan, Indonesia, South Korea, Australia, Rest of Asia Pacific |
|
Customization |
Report customization as per your requirements concerning countries, regions, and segmentation. |
FAQ's
Aquaponic Lynx LLC, Backyard Aquaponics Pty Ltd, Chengdu Chengfei Green Environmental Technology Co., Ltd., Foshan GrowSpec BioTech Co.,Ltd., G And N Fortune Limited are the key companies in Asia Pacific Aquaponics Market.
The Asia Pacific aquaponics market is expected to grow at a CAGR of 11.1% during the forecast period.
The Asia Pacific Aquaponics Market report covering key segments are product, component, method, end-user, and country.
Continuous declining per capita land holding is creating the need for unique solutions like aquaponics are the key driving factors in Asia Pacific Aquaponics Market.
The Asia Pacific Aquaponics market size is expected to reach USD 373.52 Million by 2034
Page last updated on:
Feb-2024
Research Methodology
A robust system of research, verification, and forecasting designed to ensure reliable and actionable market insights.
Polaris Market Research uses a clear and structured approach to deliver insights that clients can rely on. The process combines detailed primary and secondary research, including direct communication with industry experts. The detailed information helps build a complete picture of market trends and developments. Secondary data is gathered from credible sources such as industry reports, company filings, government source links, and trusted organization databases. It is then cross-checked through discussions with key stakeholders across the value chain. Market size and forecasts are developed using both bottom-up and top-down methods to ensure accuracy and consistency in the final results.

Project Setup
Step 1 & 2:
- We start every project by clearly understanding the client’s objective or goal, then defining the market scope, and aligning regions, segments, and timelines.
- Once the foundation is set, we collect data from all-around of sources, including company reports, government databases, and paid industry platforms.
- Our research is based on secondary data, which helps us build a strong understanding of the market across regions and industries. Then we validate this information through primary research by speaking directly with industry experts, companies, and stakeholders.
- By combining secondary and primary research, we ensure that our market insights are accurate, practical, and closely aligned with real market conditions.
Data Collection
We gather information from both public and verified sources:

Data Structuring
Step 3:
- All collected data is organized into a consistent format to ensure accurate analysis. Since inputs come from multiple sources, they are standardized and aligned before use.
- The data is segmented by product, application, and region, and mapped across a defined historical period (2020–2024). All values are converted into common units (USD Mn/Bn), and volume and pricing are aligned where required to estimate revenue.
- Any overlaps or inconsistencies are reviewed and adjusted to maintain accuracy (<5% variance threshold).
- The result is a structured dataset that allows for clear comparison across regions and supports reliable analysis and forecasting.
Structured Market Dataset, USD Mn/Bn

4. Data Structuring
Step 4: TOP-DOWN APPROACH
- We start with the overall market size at a global or macro level.
- The market is then narrowed down based on scope and industry relevance.
- We apply penetration rates and split the data by region and segment.
- This helps us estimate the market size for specific segments.
- The numbers are validated through cross-checks to ensure accuracy.

Step 5: BOTTOM-UP APPROACH
- We begin by analyzing data from leading companies in the market.
- Revenue data is collected and mapped across different segments.
- The data is then aggregated to estimate the total market size.
- To fill in any gaps, adjustments are made based on industry standards.
- Validation checks make sure that the results are correct.

5. Data Structuring
Step 6:
At Polaris Market Research, we employ a methodical forecasting strategy. This approach blends the analysis of historical data with real-time market validation. To forecast future trends with precision, we examine past patterns, pricing fluctuations, and the interplay of supply and demand. To ensure our conclusions reflect the present market landscape, we actively seek input from industry experts and key stakeholders.
To refine our predictions, we carefully consider critical elements such as market drivers and restraints, fluctuations in raw material costs, emerging technologies, and the production capabilities of various regions. Furthermore, we assess regulatory frameworks and potential policy shifts to gauge their potential impact on market expansion.
All this information is synthesized to generate precise forecasts for each segment and region. These forecasts illuminate the current state of the market and highlight forthcoming opportunities.

6. Data Structuring
Step 7:
In the final stage, we validate all our estimates using a triangulation method, where data is cross-checked from multiple reliable sources, like company data, primary interviews, and secondary research. This helps us make sure that our numbers are correct and fit with the rest of the market.
This process involves verifying data consistency across various segments and geographic areas. It also requires comparing historical trends with the assumptions support the forecast. Any discrepancies involve adjustments to ensure everything remains aligned and dependable.
Once the data is finalized, we prepare the final outputs, including market size estimates, segment-wise breakdowns, and growth metrics. These are delivered in structured formats such as tables, charts, and data files for easy analysis and use.
We collaborate closely with clients, ensuring the final products align with their requirements. This includes offering tailored adjustments, supplementary data analyses, and continuous assistance. Furthermore, we monitor market trends post-delivery, providing updates and refinements to maintain the insights' relevance as time passes.
Post-delivery, we continue to monitor market shifts, offering updates and adjustments to ensure the insights remain relevant over time.
Validation
Triangulation Framework
- Company-level data
- Primary inputs from industry participants
- Secondary benchmarks and published data
- Variance maintained within ±5-10%
- Adjustments applied to align estimates
- Segment values validated against overall market structure
Quality Check
Data Consistency & Integrity
- Segment totals validated to 100%
- Regional estimates aligned with global market size
- Historical trends compared against forecast outputs
- Assumptions reviewed for cross-segment and regional alignment
Output & Delivery
Final Outputs
- Market size estimates (USD Mn/Bn)
- Segment-wise distribution (%)
- Growth metrics (CAGR %)
- Structured tables and charts
- Segment-level datasets
- Excel-based data files for further analysis
Client Alignment & Support
- Deliverables are aligned with defined client requirements and scope
- Custom data cuts and segment splits are incorporated as required
- Post-delivery queries are addressed through analyst interactions
- Additional clarifications and data support are provided upon request
Client Continuity & Updates
- Market developments are tracked post-delivery to capture changes in key trends
- Updated data and revisions are provided based on new market inputs
- Additional refinements and data cuts are shared as required
- Continued analyst engagement supports evolving client requirements
