

Report Outlook
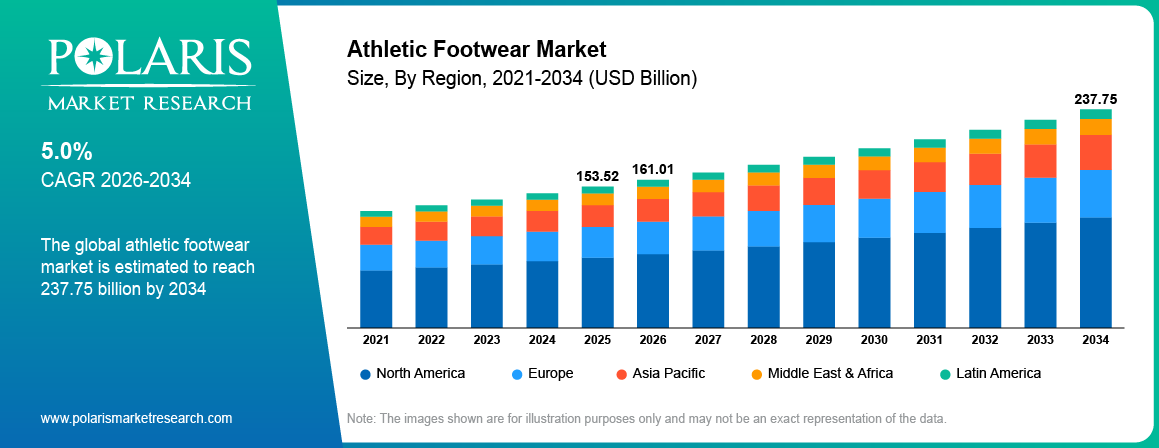
The global athletic footwear market size stood at USD 153.52 billion in 2025. According to our athletic shoes market forecast, the industry is projected to account for a CAGR of 5.0% between 2026 and 2034. This market is continuing to grow steadily, especially as consumer lifestyles increasingly focus on fitness, sports, and sports-fashion clothing. Health awareness, combined with increasing participation in running events, gym memberships, and sports, is creating a strong demand for athletic shoes.
In addition to this, the use of performance technologies such as lightweight cushioning, mesh materials, and energy return midsoles is transforming the sports footwear industry. This is because such technologies help design shoes that improve performance and comfort. They also make shoes more durable.
The shoes made for sports and outdoor activities are referred to as athletic footwear. These shoes are designed to deliver better grip, cushioning, stability, and shock absorption. This enables users to perform various physical activities more effectively. Athletic footwear includes shoes for running, training, trekking, tennis, soccer, basketball, and multipurpose sports shoes for daily use.
Key Insights
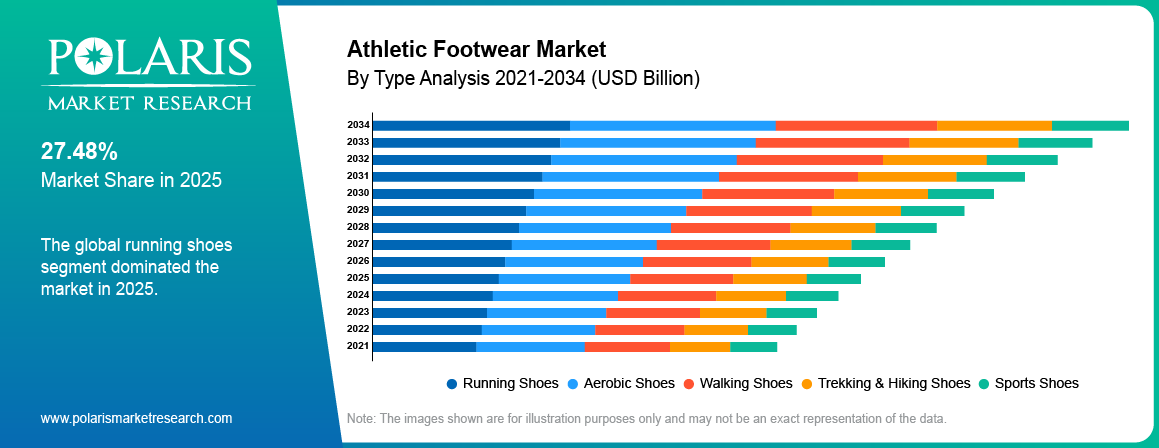
- The running shoes segment led the athletic footwear market in 2025. This is due to their availability in various styles and the growing popularity of outdoor activities.
- Online channels are among the fastest-growing distribution channels, as they allow consumers to choose from a wide range of products from global manufacturers.
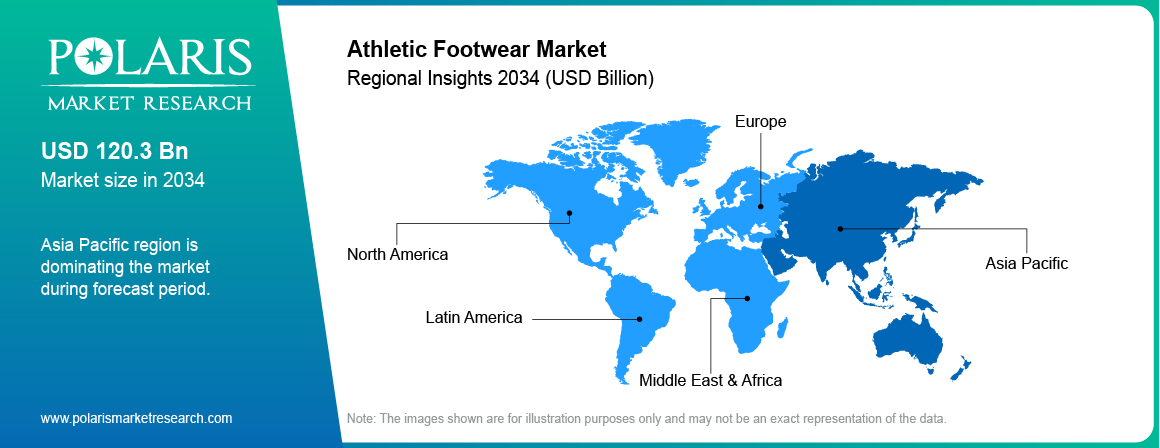
- North America remains one of the largest markets for athletic footwear. The region has a high penetration of major brands and high consumption of sports apparel.
- Asia Pacific is expected to experience the highest growth rate during the forecast period. This is primarily due to urbanization and increasing disposable incomes in the region.
Industry Dynamics
- The growing popularity of outdoor activities is one of the major factors driving the demand for athletic footwear.
- The athletic footwear market benefits from technological innovations in footwear. These include carbon plate running shoes, smart footwear sensors, and AI-designed footwear.
- The rising use of sustainable and eco-friendly materials is expected to create several market opportunities.
- The market growth may be hindered by volatile raw material costs.
Market Statistics
2025 Market Size: USD 153.52 billion
2034 Projected Market Size: USD 237.75 billion
CAGR (2026–2034): 5.0%
Asia Pacific: Fastest Market Growth
Recently, athletic footwear has evolved to move beyond its use as sportswear and has become a common form of casual wear. The rise of sneaker culture footwear has also helped to bridge the gap between athletic wear and fashion, thereby increasing its global consumer base. The rise in fitness centers and gyms has increased the demand for athletic footwear and the performance footwear market. The growth of e-commerce is creating opportunities for businesses to sell their products online and boosting demand for the sector.
An issue facing the athletic footwear market is the cost and availability of materials. Raw materials such as rubber, foam, leather, and synthetic materials are also subject to price fluctuations. This can impact manufacturing costs and profit margins. In addition, disruptions in the global sports footwear supply chain have been caused by geopolitical issues, logistical challenges, and rising labor costs in key production centers such as Vietnam, China, and Indonesia. Another issue affecting established brands is the counterfeit sports footwear market, which impacts brand value and revenue.
To Understand More About this Research:Request a Free Sample Report
Technology Innovations in Sports Footwear
- Running shoes with carbon plates are becoming popular. This is because they can enhance speed and energy return, particularly for running.
- Footwear sensors are used to track performance, steps, and movement. They help users monitor their activity levels.
- AI-designed footwear is being created to improve design, comfort, and fit, as well as performance.
Consumer Behavior in Athletic Footwear
Consumer behavior for the athletic footwear market is also influenced by trends, trust in the brand, and influencers. The sneaker culture is an important factor for the industry, especially for the younger generation. For this group of consumers, the product is considered an accessory as well as a performance item. Limited-edition designs are also an important factor in generating interest and impulsive buying. Social media helps drive awareness and interest.
Many consumers prefer to remain loyal to a brand that they have previously used. If a brand provides good comfort, quality, and style, then customers are likely to purchase from that brand again. This builds trust between a company and its customers. Another factor that affects purchasing decisions is endorsements by athletes. When a brand is endorsed by a popular sportsperson, it makes the product more attractive to potential customers. Many customers are influenced by such endorsements, especially if they are fans of a particular sportsperson, which helps to increase brand awareness.
Industry Dynamics
Athletic Footwear Market Drivers
The ongoing trend of active living is a major driver in the growth of athletic footwear products. Consumers in all age groups are becoming health-conscious and fitness-oriented. This has resulted in increased interest in running, yoga, cycling, and gymming.
Consumers in today’s world want footwear that is not only comfortable but also fashionable and functional. It is prompting athletic footwear brands to launch sneakers suitable for both sports and casual wear.
In addition, the rise in the number of women participating in sports and fitness activities is driving women athletic footwear demand. Manufacturers are designing shoes for women athletes that are ergonomically optimized. This further supports the athleisure footwear market growth.
Sustainability in Athletic Footwear
There is an increase in the use of recycled materials as a way to minimize waste and reduce environmental impact. Eco-friendly footwear is also a new trend, where companies are focusing on green production and green materials. Carbon-neutral shoes are also being developed to minimize overall carbon emissions.
Report Segmentation
By Type Insights
The athletic footwear market segmentation, based on type, includes aerobic shoes, running shoes, walking shoes, trekking & hiking shoes, and sports shoes. The running shoes segment accounted for the largest market share in 2025. Running shoes come in various styles. These shoes can even be worn daily. These factors contribute to their high popularity. The segment also benefits from the growing popularity of outdoor activities. Furthermore, the rising number of marathons and the increased participation of individuals in marathons in emerging economies and developed countries enhances the demand for sports shoes.
By Distribution Channel Insights
Based on distribution channel, the market segmentation includes hypermarkets/supermarkets, specialty stores, brand outlets, and online channels. Online channels are among the fastest-growing distribution channels in the athletic footwear industry. The rapid growth of e-commerce has transformed consumer purchasing behavior, enabling them to choose from a wide range of products from global manufacturers. Similarly, many athletic footwear brands use direct-to-consumer business models, enabling them to market their products directly to customers through their own online platforms. This would help them enhance their brand, increase their profit margins, and develop stronger brand associations.
By End-Use Insights
By end-use, the athletic footwear market segmentation includes men, women, and children. The women segment is projected to hold the largest revenue share. As women's interest in sports continues to rise, particularly in previously untapped countries, women's footwear is increasingly catching up. In general, females of all ages participate less in sports and fitness activities. But over the past few years, more women have started taking part in marathons, running, and jogging, which has greatly aided the industry's expansion. In contrast to developing and underdeveloped nations, most developed countries have more female athletes competing for their countries at major sporting events.
Additionally, compared to underdeveloped countries, industrialized countries have far higher levels of total fitness awareness among women. However, the situation is rapidly changing in emerging nations as governments encourage women to actively participate in sports and other fitness activities. In emerging markets, this is projected to significantly increase the sales of women's athletic footwear.
Regional Analysis
The North America athletic footwear market remains one of the largest markets for athletic footwear. The region accounted for USD 33.5 billion in revenue in 2025. This is because this region has high penetration of major brands and high consumption of sports apparel. In this region, especially in the US, consumers are actively involved in running events and participating in sports such as fitness and outdoor activities.
The Asia Pacific sports footwear market is expected to experience the highest growth rate during this period. This is primarily due to urbanization and increasing disposable incomes in the region. Sports events such as the Asian Games and Cricket World Cups have created a strong market for athletic footwear in Asian countries such as China, India, and Japan.
Brazil is one of the world's largest markets for athletic shoes, driving sales of athletic shoes in Latin America. In addition, in recent years, athletic shoes have increased in Latin America due to growing health awareness, lifestyle changes, a growing desire for comfortable shoes, a growing need for creative shoe design, and rising disposable income levels. Consumers' preference for sneakers is increasing.
Competitive Insights
Major players in this athletic footwear market are investing heavily in research and development to enhance their product portfolios, thereby driving the market. These companies are adopting various strategic initiatives, such as introducing innovative products, establishing global partnerships, increasing investments, and engaging in mergers and acquisitions, to expand their global footprint.
The value chain for athletic footwear production encompasses major manufacturing centers for large volumes of shoes, as well as supply chain operations. Knowledge of the supply chain is essential to helping organizations operate efficiently and deliver their products to market on time.
Nike is an athletic footwear company with global presence. It is known for its positive brand image and innovation. It offers a variety of athletic and lifestyle footwear for different sports and other uses. Nike’s retail and consumer strategy has helped the company sustain its position as a market leader in the athletic footwear market.
Puma SE is a popular sportswear brand. It offers athletic and casual footwear in a variety of categories. The company is known for providing sportswear that is a perfect blend of performance and style. This makes it a favorite among athletes and younger generations alike. Partnerships and growing interest in sustainable practices are helping the company gain more market traction.
List of Key Companies
- Asics Corporation
- Adidas Group
- FILA Korea
- K-Swiss
- Lotto Sport Italia
- Nike
- New Balance Athletics
- Puma SE
- Reebok International Limited
- SKECHERS
- Under Armour
- Vans
- VF Corporation
- Wolverine World Wide
Industry Developments
June 2025: Reebok expanded its footwear range with the Reebok FloatZig 2 running shoe. This shoe is equipped with SuperFloat+ nitrogen-injected foam and a redesigned Zig Tech midsole. This provides better energy return and stability for daily training.
May 2025: Skechers USA Inc introduced the Skechers Aero Tempo. The company stated that the Skechers Aero Tempo is a lightweight and performance-focused running shoe. It is designed with responsive cushioning for runners who want enhanced speed and agility.
May 2025: The North Face launched the Offtrail Hike Collection, a new trail-running and hiking footwear line built for rugged terrain. The range includes the Offtrail Hike GORE-TEX Shoe and Offtrail Hike LT Mid GORE-TEX Boot. They feature CORDURA uppers, SURFACE CTRL outsoles, and PFAS-free GORE-TEX waterproofing.
February 2025: Merrell unveiled the MTL Adapt Matryx trail shoe. The shoe is equipped with a Float Pro Plus midsole, Vibram Megagrip outsole, and a hydrophobic Matryx upper. It provides durability, traction, and comfort for technical and wet trails.
Market Segmentation
By Type Outlook (Revenue, USD Billion, 2021–2034)
- Aerobic Shoes
- Running Shoes
- Walking Shoes
- Trekking & Hiking Shoes
- Sports Shoes
- Tennis Shoes
- Soccer Shoes
- Basketball Shoes
- Cricket Shoes
- Others
By Distribution Channel Outlook (Revenue, USD Billion, 2021–2034)
- Hypermarkets/Supermarkets
- Specialty Stores
- Brand Outlets
- Online Channels
By End-Use Outlook (Revenue, USD Billion, 2021–2034)
- Men
- Women
- Children
By Regional Outlook (Revenue, USD Billion, 2021–2034)
- North America
- US
- Canada
- Europe
- Germany
- France
- UK
- Italy
- Spain
- Netherlands
- Russia
- Rest of Europe
- Asia Pacific
- China
- Japan
- India
- Malaysia
- South Korea
- Indonesia
- Australia
- Vietnam
- Rest of Asia Pacific
- Middle East & Africa
- Saudi Arabia
- UAE
- Israel
- South Africa
- Rest of Middle East & Africa
- Latin America
- Mexico
- Brazil
- Argentina
- Rest of Latin America
Athletic Footwear Market Report Scope
|
Report Attributes |
Details |
|
Market Size in 2025 |
USD 153.52 billion |
|
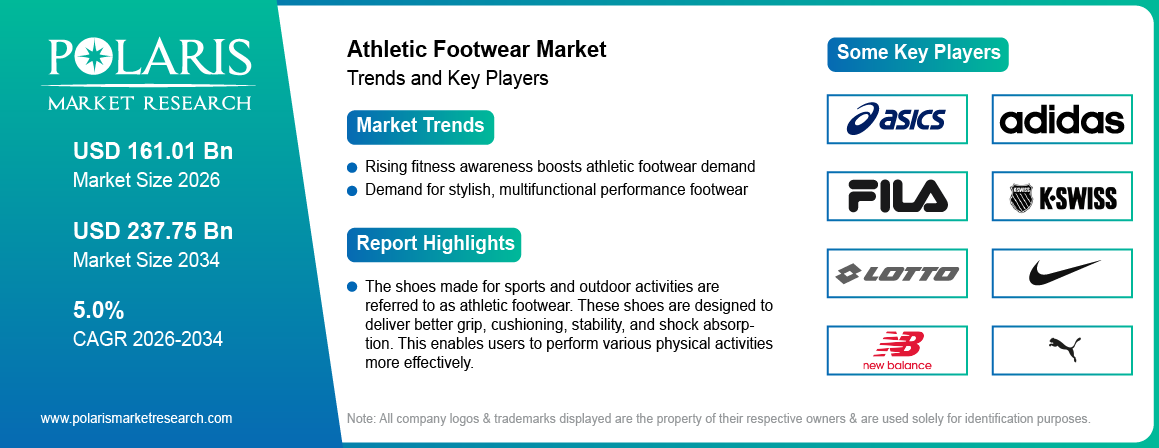
Market Size in 2026 |
USD 161.01 billion |
|
Revenue Forecast by 2034 |
USD 237.75 billion |
|
CAGR |
5.0% |
|
Base Year |
2025 |
|
Historical Data |
2021–2024 |
|
Forecast Period |
2026–2034 |
|
Quantitative Units |
Revenue in USD billion, and CAGR from 2026 to 2034 |
|
Report Coverage |
Revenue Forecast, Market Competitive Landscape, Growth Factors, and Trends |
|
Segments Covered |
|
|
Regional Scope |
|
|
Competitive Landscape |
Athletic Footwear Industry Trend Analysis (2025) Company profiles/industry participants profiling include company overview, financial information, product/service benchmarking, and recent developments |
|
Report Format |
PDF + Excel |
|
Customization |
Report customization as per your requirements with respect to countries, regions, and segmentation. |
FAQ's
The athletic footwear market stood at USD 153.52 billion in 2025. The market is projected to reach USD 237.75 billion by 2034.
The market is projected to account for a CAGR of 5.0% between 2026 and 2034.
The market is driven by the growing popularity of outdoor activities and technological innovations in footwear.
Athleisure is supporting the market expansion. It is making athletic footwear suitable for both sports and everyday wear.
Running shoes account for the largest market share, owing to their wide use across different activities.
A few of the leading companies in the market include Asics Corporation, Adidas Group, FILA Korea, K-Swiss, Lotto Sport Italia, Nike, New Balance Athletics, Puma SE, Reebok International Limited, SKECHERS, Under Armour, Vans, VF Corporation, and Wolverine World Wide.
E-commerce offers wider product choices and convenience. It also provides easy access to global brands. All of this is helping boost sales.
Key market challenges include raw material price fluctuations and supply chain disruptions.
Technology is improving design through better materials and smart features. It is also enabling data-based product development.
Emerging trends in the market include sustainable footwear, smart shoes, and the growing influence of sneaker culture.
Page last updated on:
Jan-2023
Research Methodology
A robust system of research, verification, and forecasting designed to ensure reliable and actionable market insights.
Polaris Market Research uses a clear and structured approach to deliver insights that clients can rely on. The process combines detailed primary and secondary research, including direct communication with industry experts. The detailed information helps build a complete picture of market trends and developments. Secondary data is gathered from credible sources such as industry reports, company filings, government source links, and trusted organization databases. It is then cross-checked through discussions with key stakeholders across the value chain. Market size and forecasts are developed using both bottom-up and top-down methods to ensure accuracy and consistency in the final results.

Project Setup
Step 1 & 2:
- We start every project by clearly understanding the client’s objective or goal, then defining the market scope, and aligning regions, segments, and timelines.
- Once the foundation is set, we collect data from all-around of sources, including company reports, government databases, and paid industry platforms.
- Our research is based on secondary data, which helps us build a strong understanding of the market across regions and industries. Then we validate this information through primary research by speaking directly with industry experts, companies, and stakeholders.
- By combining secondary and primary research, we ensure that our market insights are accurate, practical, and closely aligned with real market conditions.
Data Collection
We gather information from both public and verified sources:

Data Structuring
Step 3:
- All collected data is organized into a consistent format to ensure accurate analysis. Since inputs come from multiple sources, they are standardized and aligned before use.
- The data is segmented by product, application, and region, and mapped across a defined historical period (2020–2024). All values are converted into common units (USD Mn/Bn), and volume and pricing are aligned where required to estimate revenue.
- Any overlaps or inconsistencies are reviewed and adjusted to maintain accuracy (<5% variance threshold).
- The result is a structured dataset that allows for clear comparison across regions and supports reliable analysis and forecasting.
Structured Market Dataset, USD Mn/Bn

4. Data Structuring
Step 4: TOP-DOWN APPROACH
- We start with the overall market size at a global or macro level.
- The market is then narrowed down based on scope and industry relevance.
- We apply penetration rates and split the data by region and segment.
- This helps us estimate the market size for specific segments.
- The numbers are validated through cross-checks to ensure accuracy.

Step 5: BOTTOM-UP APPROACH
- We begin by analyzing data from leading companies in the market.
- Revenue data is collected and mapped across different segments.
- The data is then aggregated to estimate the total market size.
- To fill in any gaps, adjustments are made based on industry standards.
- Validation checks make sure that the results are correct.

5. Data Structuring
Step 6:
At Polaris Market Research, we employ a methodical forecasting strategy. This approach blends the analysis of historical data with real-time market validation. To forecast future trends with precision, we examine past patterns, pricing fluctuations, and the interplay of supply and demand. To ensure our conclusions reflect the present market landscape, we actively seek input from industry experts and key stakeholders.
To refine our predictions, we carefully consider critical elements such as market drivers and restraints, fluctuations in raw material costs, emerging technologies, and the production capabilities of various regions. Furthermore, we assess regulatory frameworks and potential policy shifts to gauge their potential impact on market expansion.
All this information is synthesized to generate precise forecasts for each segment and region. These forecasts illuminate the current state of the market and highlight forthcoming opportunities.

6. Data Structuring
Step 7:
In the final stage, we validate all our estimates using a triangulation method, where data is cross-checked from multiple reliable sources, like company data, primary interviews, and secondary research. This helps us make sure that our numbers are correct and fit with the rest of the market.
This process involves verifying data consistency across various segments and geographic areas. It also requires comparing historical trends with the assumptions support the forecast. Any discrepancies involve adjustments to ensure everything remains aligned and dependable.
Once the data is finalized, we prepare the final outputs, including market size estimates, segment-wise breakdowns, and growth metrics. These are delivered in structured formats such as tables, charts, and data files for easy analysis and use.
We collaborate closely with clients, ensuring the final products align with their requirements. This includes offering tailored adjustments, supplementary data analyses, and continuous assistance. Furthermore, we monitor market trends post-delivery, providing updates and refinements to maintain the insights' relevance as time passes.
Post-delivery, we continue to monitor market shifts, offering updates and adjustments to ensure the insights remain relevant over time.
Validation
Triangulation Framework
- Company-level data
- Primary inputs from industry participants
- Secondary benchmarks and published data
- Variance maintained within ±5-10%
- Adjustments applied to align estimates
- Segment values validated against overall market structure
Quality Check
Data Consistency & Integrity
- Segment totals validated to 100%
- Regional estimates aligned with global market size
- Historical trends compared against forecast outputs
- Assumptions reviewed for cross-segment and regional alignment
Output & Delivery
Final Outputs
- Market size estimates (USD Mn/Bn)
- Segment-wise distribution (%)
- Growth metrics (CAGR %)
- Structured tables and charts
- Segment-level datasets
- Excel-based data files for further analysis
Client Alignment & Support
- Deliverables are aligned with defined client requirements and scope
- Custom data cuts and segment splits are incorporated as required
- Post-delivery queries are addressed through analyst interactions
- Additional clarifications and data support are provided upon request
Client Continuity & Updates
- Market developments are tracked post-delivery to capture changes in key trends
- Updated data and revisions are provided based on new market inputs
- Additional refinements and data cuts are shared as required
- Continued analyst engagement supports evolving client requirements
