
Reports

Audience Analytics Market Size, Growth Analysis Report, 2026-2034
REPORT DETAILS
REPORT DETAILS
ABOUT THIS REPORT
What is the Current Market Size?
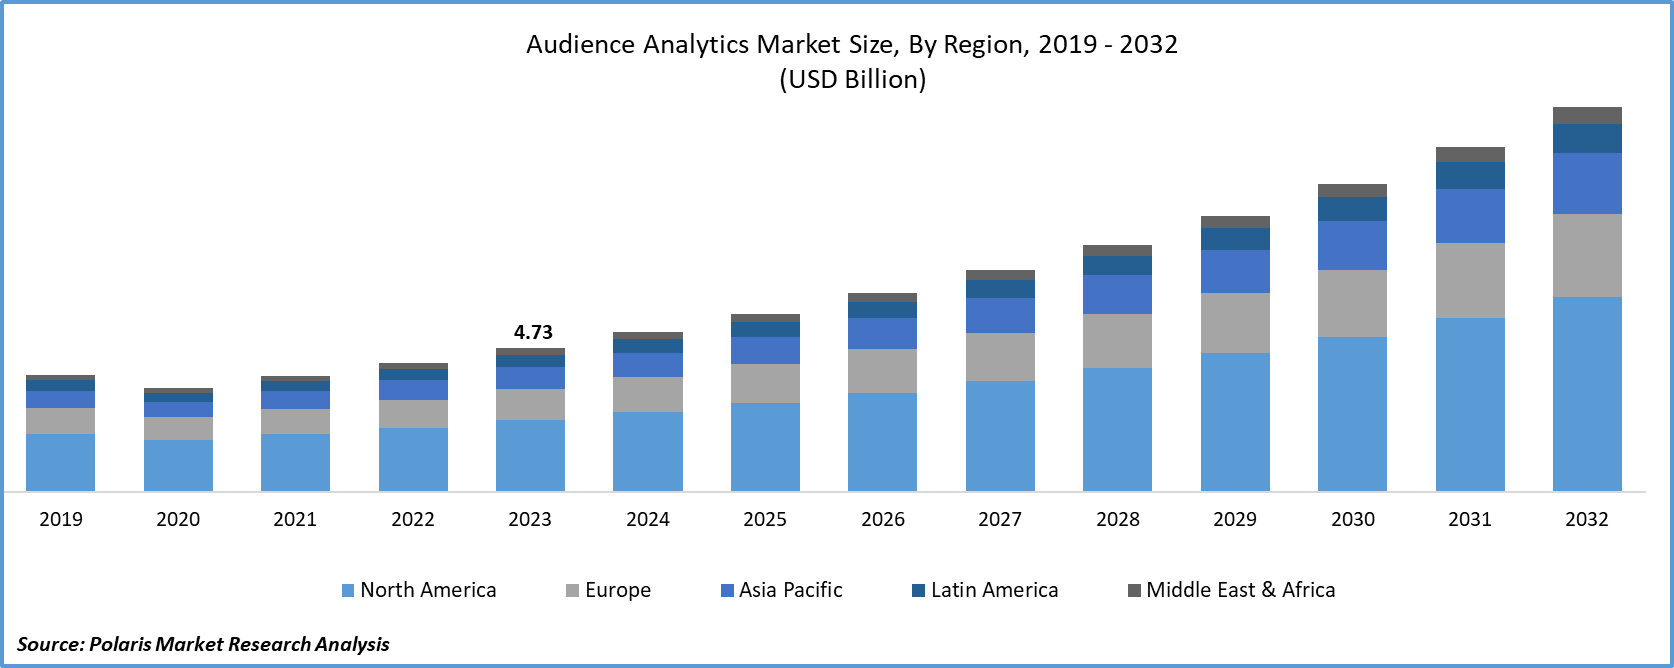
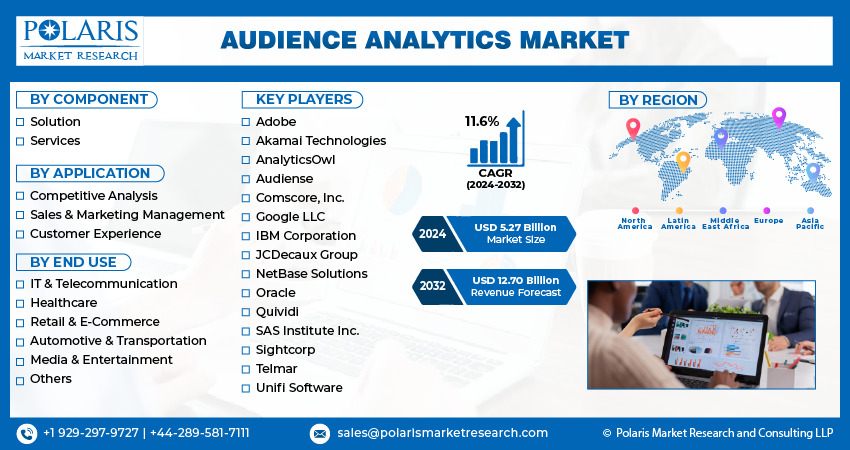
The global audience analytics market was valued at USD 5.89 billion in 2025 and is expected to grow at a CAGR of 11.50% during the forecast period.
Market Statistics
- 2025 Market Size: USD 5.89 billion
- 2034 Projected Market Size: USD 15.68 billion
- CAGR (2026–2034): 11.50%
- North America: Largest market in 2025
The rise of social media has significantly impacted the field of marketing, leading to an increased demand for focused and targeted strategies. Social media platforms serve as valuable sources of data, providing insights into buyer patterns, preferences, and population trends. This wealth of information enables companies to optimize their advertising campaigns and tailor their marketing efforts to specific audience segments. Audience analytics plays a crucial role in this scenario. It involves the collection, analysis, and interpretation of data related to audience behavior. By leveraging audience analytics, businesses can gain a deeper understanding of their target demographic. This includes identifying consumer preferences, behavior patterns, and the factors influencing their purchasing decisions.
To Understand More About this Research: Download Sample Report
The emphasis on tailored and data-driven marketing tactics is driven by the need for precision in reaching the right audience with the right message. With audience analytics, companies can create more personalized and relevant marketing campaigns. This, in turn, enhances customer engagement and loyalty as consumers are more likely to respond positively to content that resonates with their preferences and needs.
The COVID-19 pandemic has had a positive impact on the market, primarily due to the widespread shift to digital platforms. This transition has created a heightened demand for audience analytics solutions, as organizations seek to better understand their customers' behavior and preferences in the digital landscape. The pandemic has underscored the significance of customer service, prompting companies to amplify their adoption of prevailing customer service trends, including contactless transactions and personalized customer experiences.
A study conducted by SAS revealed that one in every seven people became new users of digital platforms during the pandemic, and an impressive 70% expressed their intention to continue using these platforms. Additionally, the study found that 61% of customers would be willing to pay more for a company that delivered an exceptional business experience amid the challenges posed by the pandemic. This underscores the growing importance of providing top-notch customer experiences in the digital realm, as businesses recognize the value that customers place on such services during times of crisis.
For More Details, Request for Report Discount
Growth Drivers
Growing Emphasis on Customer-Centric Strategies
The proliferation of digital platforms has led to a vast and intricate landscape of consumer data. Companies from various sectors are leveraging this data to gain comprehensive insights into their target consumers. However, the complexity of consumer behavior has expanded across multiple interfaces, including web pages, mobile apps, social networks, and Internet of Things (IoT) devices. To navigate this complexity, advanced audience analytics tools have become essential.
These tools are designed to collect, analyze, and interpret data from diverse sources. Given that consumers interact with brands and content through various channels, it is crucial for businesses to have tools that can integrate and make sense of data from web interactions, mobile applications, social media interactions, and IoT devices. This comprehensive approach allows companies to have a holistic view of consumer behavior across the digital landscape. For instance, audience analytics tools can track how users navigate a website, engage with a mobile app, interact on social media, and even utilize connected devices in their daily lives. By understanding these patterns and preferences, businesses can tailor their strategies to meet consumer expectations and provide more personalized experiences.
Provider Capability & Data Source Matrix
| Provider | Primary audience focus | Core capabilities (audience analytics) | Main data sources mentioned | Cross‑platform scope |
| Nielsen | TV, digital, audio, cross‑media audiences | Audience measurement across channels, media planning, marketing ROI optimization; understanding “entire population and its shifting habits” | Measurement data across “all channels and platforms” including streaming TV, podcasts, social; population‑level panels and datasets (described broadly) | Yes – cross‑platform audience and outcomes measurement across TV, digital and other media |
| Comscore | Digital (web/apps), TV, OTT, theatrical | Digital audience measurement, multi‑platform content measurement, advanced audience segments and composition, competitive benchmarking | Massive desktop and mobile panels, Comscore Census Network, digital, linear TV, OTT and theatrical viewership intelligence combined with advanced audience insights | Yes – multi‑screen (digital, linear TV, OTT, theatrical) with deduplicated person‑level insights |
| Google Analytics | Website and app users | Web and app analytics, customer journey analysis, marketing ROI, traffic and engagement measurement | First‑party tracking on websites/apps via tags; integrates with other Google products (AdWords, Tag Manager, etc.) to enrich marketing data | Primarily digital (web and apps), not traditional TV/OTT audience measurement |
| GWI (GlobalWebIndex) | Online consumers and digital audiences | On‑demand consumer research, building audiences, dashboards, charts, crosstabs to understand behaviors and attitudes | Large global survey‑based consumer datasets (implied by “on‑demand consumer research” and audience creation tools) | Digital/consumer insight focused; used to understand online audiences across platforms conceptually, not device‑level ratings |
| Brandwatch | Social and online audiences | Social listening, audience analytics, AI‑driven insights for brand and consumer behavior; part of a “social suite” | Social media and web data, including public online conversations and engagement (implied by social suite positioning) | Digital/social; no linear TV ratings but can reflect multi‑network social presence |
| Audiense | Social, digital and behavioral audiences | Audience segmentation, psychographics, influencer and community identification; used for growth and LTV | “Thousands of sources” including website visits, online behaviors, mobility data, location data, psychographic insights, purchase intent signals | Broad digital and behavioral scope; cross‑device/behavior, not panel‑based TV measurement |
Report Segmentation
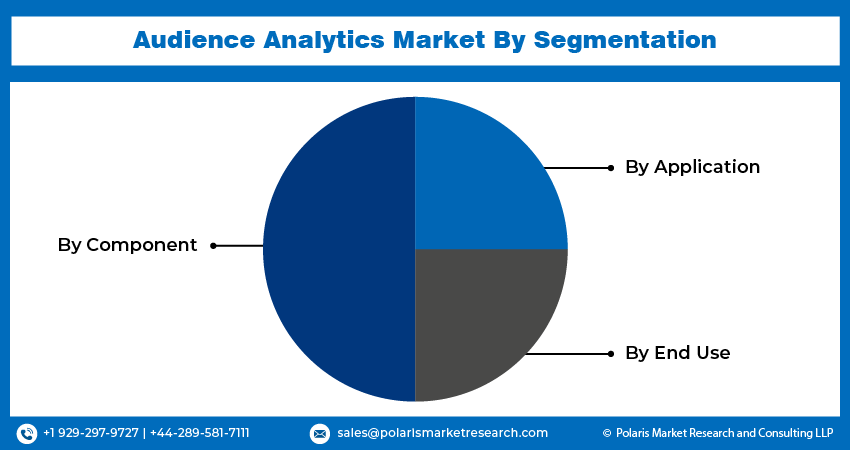
The market is primarily segmented based on component, application, enterprise size, end use, and region.
| By Component | By Application | By End Use | By Region |
|
|
|
|
To Understand the Scope of this Report: Request Customization
By Component Analysis
-
Services segment is expected to witness the highest growth during the forecast period
Solution segment held the largest share. Segment’s growth is primarily due to surge in e-commerce platforms and the escalating use of the internet for purposes like social media engagement and digital marketing. The COVID-19 pandemic played a significant role in accelerating digital transformation, prompting a shift in the retail model from traditional brick-and-mortar stores to e-commerce. Faced with social distancing measures and lockdowns, many businesses transitioned their operations online to ensure uninterrupted service to their customers.
Services segment dominated the audience analytics market. This dominance is primarily due to increased demand for these services is chiefly propelled by the intricate nature of data analytics and the necessity for specialized expertise in deciphering and applying insights obtained from audience analytics tools.
By Application Analysis
-
Customer experience segment registered the largest market share in 2025
Customer experience segment accounted for the largest share. It plays a pivotal role in analyzing customer behavior, feedback, and preferences, providing valuable insights into customers' desires and requirements. This information is crucial for businesses to tailor their products, services, and marketing strategies effectively. Additionally, audience analytics aids in identifying aspects of the customer experience that may lead to frustration or dissatisfaction, such as prolonged wait times, complex interfaces, or insufficient support.
Sales & marketing segment will grow rapidly. The intersection of digital advancements and the widespread use of online platforms has resulted in an un-precedented surge in consumer data. This surge has underscored the necessity for advanced audience analytics solutions designed specifically to meet the needs of the sales and marketing segment. Concurrently, the increasing emphasis on data privacy & the ethical utilization of the consumer data has prompted the development of audience analytics solutions that prioritize the compliance.
By End Use Analysis
-
Media & entertainment segment held the significant market revenue share in 2025
Media & entertainment segment held the largest share. In the entertainment industry, audience analytics finds diverse applications, including comprehending audience responses to content, monitoring viewer preferences, forecasting the success of campaigns, refining advertising strategies, targeting specific audience segments, and more. The COVID-19 pandemic confined individuals to their homes, prompting increased usage of television, laptops, and mobile devices. The heightened reliance on the internet resulted in a substantial surge in content consumption. Over-the-top (OTT) platforms particularly thrived during the lockdown, accumulating a significant volume of data in the process.
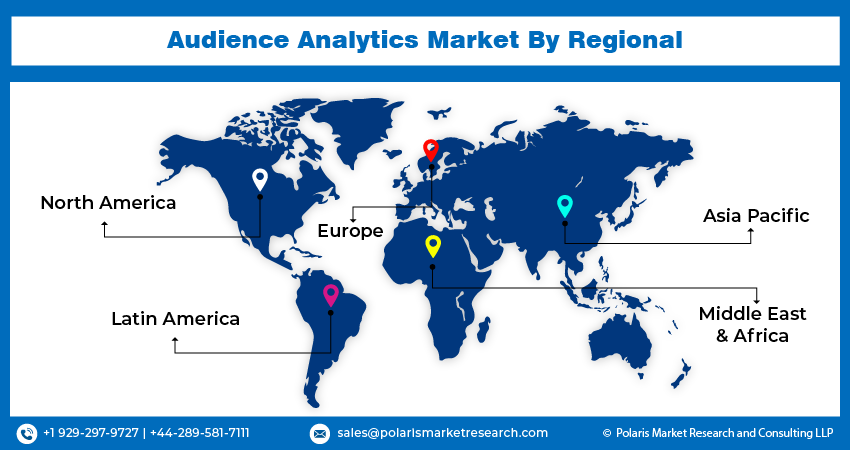
Regional Insights
-
North America region held the largest share of the global market in 2025
The North America region dominated the market. The competitive dynamics in the region's marketplaces, especially in industries like retail, media, and advertising, are fueling the need for audience analytics solutions. Additionally, the region's commitment to stringent regulations concerning privacy and a growing emphasis on consumer data security has played a role in the widespread adoption of audience analytics tools that prioritize adherence to data security standards.
The Asia Pacific region projected to grow at the rapid pace. The region's large population and swift digital transformation have resulted in a substantial increase in data generation, creating a significant opportunity for audience analytics solutions. The widespread adoption of smartphones and internet connectivity across countries has driven the expansion of digital platforms, resulting in a rich and diverse pool of consumer data. This surge in data has heightened the demand for advanced audience analytics tools to extract valuable insights into consumer behavior, preferences, and purchasing patterns.
Key Market Players & Competitive Insights
Some of the major players operating in the global market include:
- Adobe
- Akamai Technologies
- AnalyticsOwl
- Audiense
- Comscore, Inc.
- Google LLC
- IBM Corporation
- JCDecaux Group
- NetBase Solutions
- Oracle
- Quividi
- SAS Institute Inc.
- Sightcorp
- Telmar
- Unifi Software
Recent Developments
- In March 2025: Adobe launched AI agents in Experience Cloud to automate cross-channel experiences and deliver real-time personalization.
- In March 2025: Adobe added Content Analytics to GenStudio to track asset performance and simplify large-scale content workflows.
- In January 2025: Nielsen expanded in India with 3,000 new staff, opening tech centers in Hyderabad and Gurgaon to boost retail and gaming analytics.
- In December 2024: Adobe and AWS extended their partnership, bringing Adobe Experience Platform to AWS for unified data and AI insights.
- In November 2024: Amplitude reported 9% ARR growth in Q3 2024 and introduced “Amplitude Made Easy” to simplify product analytics onboarding.
- In October 2022, Oracle has enhanced its Customer Data Platform (CDP), Oracle Unity, by incorporating 15 foundational artificial intelligence (AI) models. With these advancements, Oracle Unity empowers organizations to access actionable and real-time insights, expand their audience reach, and personalize the customer experience at every stage of the customer journey.
Audience Analytics Market Report Scope
| Report Attributes | Details |
| Market size value in 2025 | USD 5.89 billion |
| Market size value in 2026 | USD 6.54 billion |
| Revenue forecast in 2034 | USD 15.68 billion |
| CAGR | 11.50% from 2026 – 2034 |
| Base year | 2025 |
| Historical data | 2021 – 2024 |
| Forecast period | 2026 – 2034 |
| Quantitative units | Revenue in USD billion and CAGR from 2026 to 2034 |
| Segments covered | By Component, By Application, By End Use, Enterprise Size, By Region |
| Regional scope | North America, Europe, Asia Pacific, Latin America, Middle East & Africa |
| Customization | Report customization as per your requirements with respect to countries, region and segmentation. |
FAQ's
The global audience analytics market size is expected to reach USD 15.68 billion by 2034.
Key players in the market are Adobe, Akamai Technologies, AnalyticsOwl, Audiense, Comscore, Google
North America contribute notably towards the global audience analytics market
The global audience analytics market is expected to grow at a CAGR of 11.50% during the forecast period.
The audience analytics market report covering key segments are component, application, enterprise size, end use, and region.
Download Sample Report of Audience Analytics Market
Please fill out the form to request a customized copy of the research report.
