
Automated Test Equipment Market Research Report, Share and Forecast, 2026– 2034
REPORT DETAILS
Market Statistics
Market Overview
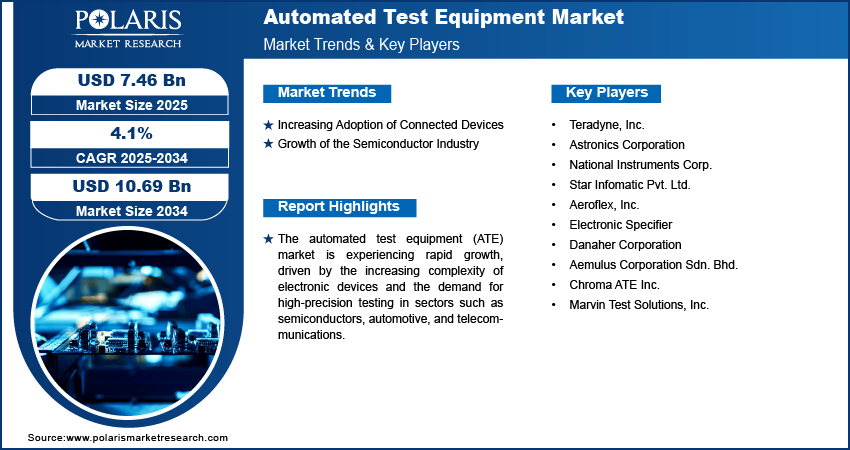
The global automated test equipment market size was valued at USD 8.24 billion in 2025. It is projected to grow at a CAGR of 3.3% during 2026-2034. Advancements in cost-effective quality regulations and enhanced product reliability are driving the market.
The ATE market is further driven by the growing complexity of semiconductor designs and the move toward advanced-node testing. Critical semiconductor testing equipment demands have emerged with chipmakers adopting chiplets, 2.5D, and 3D IC packaging. These factors positively influence the size of the automated test equipment market by enabling higher accuracy, yield, and performance in high-volume manufacturing.
Key Insights
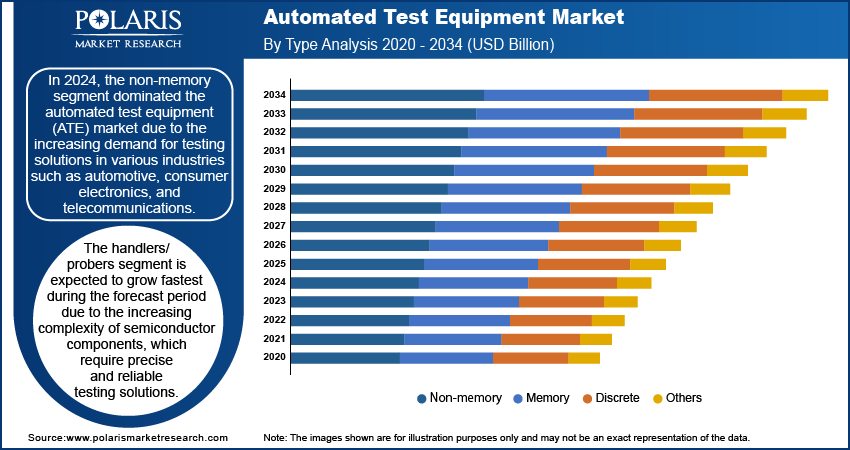
- The non-memory segment dominated the market in 2025.
- The handlers/probers segment is projected to grow fastest as the complexity of semiconductor parts increases, requiring accurate, reliable testing solutions.
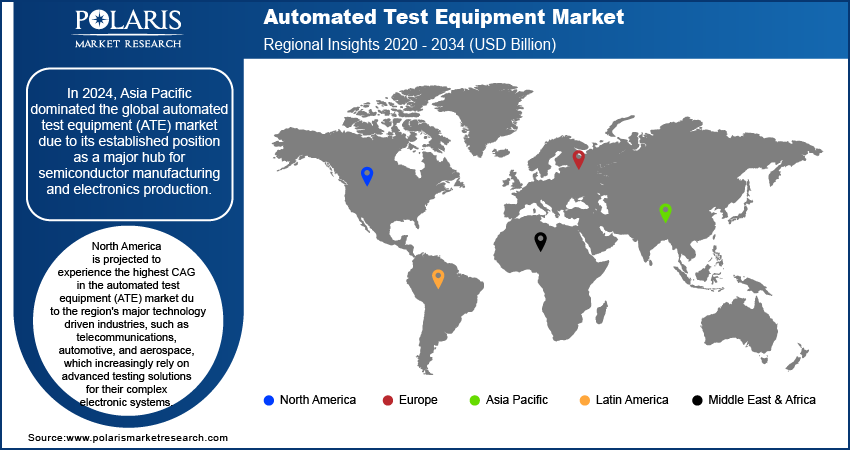
- The Asia Pacific automated test equipment market holds a major share, supported by its role as a global hub for semiconductor manufacturing, electronics production, and Asia Pacific semiconductor testing.
- Non-memory automated test equipment is at the forefront of the market due to strong demand for logic ICs, RF devices, and power devices in the automotive, IoT, and 5G sectors. Furthermore, the requirement for wafer-probing operations in large fabs is also contributing to this trend.
Industry Dynamics
- The growth of IoT, AI devices, and automation has raised the need for complex chips testing. The IoT semiconductor testing and advanced automation testing equipment are, therefore, the major driving forces behind the automated test equipment industry.
- The semiconductor industry is experiencing notable growth, driven by rising demand for electronic components across sectors such as automotive and consumer electronics, which is fueling market expansion.
- The extensive use of automated test equipment across applications such as wireless communication, digital radar, electronic component manufacturing, and testing of electronics, hardware, software, semiconductors, and avionics provides an opportunity for market growth.
- One significant ATE market challenge posed by current chip designs is the complexity of modern chips and the high cost of automated test equipment, both of which slow testing.
Market Statistics
- 2025 Market Size: USD 8.24 billion
- 2034 Projected Market Size: USD 11.40 billion
- CAGR (2025-2034): 3.3 %
- Asia Pacific: Largest Market in 2025
AI Impact on Automated Test Equipment Market
- The use of AI in automated test equipment enhances defect detection by learning to recognize patterns in test data that conventional testing often overlooks. Machine learning applications in semiconductor testing bring about adaptive testing and predictive repairs.
- Predictive analysis using AI technologies reduces downtime by anticipating equipment failures and optimizing maintenance.
- AI-driven adaptive testing dynamically modifies test parameters based on real-time feedback. This helps improve test coverage and efficiency.
- The integration of AI helps in speeding up the time-to-market through the optimization of the development of the test programs in order to minimize human interaction in the processes of validation
 Market.png)
Source: Polaris Market Research Analysis
Want a Deeper Look at Key Market Players? Download Sample Report
The automated test equipment operates on computer principles to test and analyze electronic devices, components, and hardware for functionality, quality, and performance. ATE serves to improve product reliability for the manufacturers while maintaining cost-effective quality control. Some sectors that use ATEs include wireless communication, radar, semiconductors, avionics, and electronics manufacturing. Using ATEs reduces manual labor, increases efficiency, reduces production time, and lowers costs, thereby preventing defective products from reaching the market.
Automated test equipment is an essential part of product quality and reliability. This equipment is an effective way to test 5G smartphones, tablets, and gaming consoles. With the help of ATE, the number of errors made by manpower decreases, allowing companies to produce higher-quality products as customer demand increases. For example, in October 2022, Chroma ATE announced its 3650-S2 high-performance power IC test solution, which supports 768 digital and analog pins and a power supply of up to 3000V/160A per channel.
Market Dynamics
Increasing Adoption of Connected Devices (IoT and AI-Based Technologies)
As more IoT technology is adopted, more devices become IoT-capable, increasing demand for testing solutions. Devices such as smart electronics, industrial systems, and wearable technology require full testing for functionality and reliability. Automated test equipment is required in this process as it can test devices more accurately than manual testing.
Demand for automated test equipment has been rising rapidly as IoT devices are increasingly in use. New innovations in IoT technology, self-driving cars, and advancements in the defense and aerospace industries are driving this demand. However, businesses are also trying to ensure fast time-to-market, improved quality, and lower testing costs for their customers.
For example, in December 2021, Advantest launched the T2000 IP Engine 4, an image-processing engine designed for testing the CIS found in high-resolution mobile devices such as smartphones. The new IP engine offers improved image processing speed, resulting in significantly lower costs and time in the semiconductor industry. The T2000 IP Engine 4 leverages the most advanced computing solutions to simplify and improve the testing of complex image sensors for smartphones.
Growth of Semiconductor Industry
The semiconductor industry is also growing rapidly due to increased demand for components from various industries, such as automotive and consumer electronics. For example, a report issued by NITI Aayog in July 2024 provides an overview of India's vision to make it an electronics production powerhouse in the global market, aiming to reach USD 500 billion by FY30. Its vision is to make in India and move into new industries such as wearables and autos. This will generate 5.5-6 billion jobs and exports of USD 240 billion.
ATE plays a key role in semiconductor manufacturing by checking that chips and other parts meet strict quality standards before use. It helps improve the production process, lowers costs, and reduces the risk of defects by enabling accurate, efficient testing. This pivotal role in quality assurance and efficiency is a key factor in the expansion of automated test equipment revenue.
Source: Polaris Market Research Analysis
Get Full Segment-Level Forecasts & Insights: Download Sample Report
Segment Analysis
By Type Insights
The global automated test equipment market segmentation, based on type, includes non-memory, memory, discrete, and others. The non-memory segment dominated the ATE market in 2025, driven by strong demand from the automotive, consumer electronics, and telecommunications sectors. It is estimated that most semiconductor testing of important logic ICs, power devices, RF components, and SoC solutions should be conducted with a strong emphasis on high accuracy and reliability. Owing to this factor, automotive electronics will require a critical need for ATEs as electric vehicles and ADAS proliferate. Simultaneously, the growing deployment of IoT devices, wearables, and industrial automation further accelerates demand for SoC test systems equipped with advanced technologies, thereby strengthening the market leader's position.
By Component Insights
The global market segmentation by component includes industrial PCs, handlers/probers, mass interconnect, and others. The handlers and probers market is expected to record the highest growth in the coming years, as semiconductor components are becoming more complex and require more accurate testing. Handlers and probers play a crucial role in testing during large-scale IC manufacturing. The market will register increased demand, driven by the growth of major industries such as automotive, telecommunications, and consumer electronics. IoT and 5G technology developments will therefore drive this market's growth.
Source: Polaris Market Research Analysis
Need Granular Data Across All Market Segments? Request Customization
Regional Insights
By region, the study provides insights into North America, Europe, Asia Pacific, Latin America, and the Middle East Africa. In 2025, Asia Pacific automated test equipment market led the global market, driven by its semiconductor manufacturing prowess. With the rising requirement of 5G, IoT, and EV electronics, semiconductor production and ATE in the Asia Pacific region remain unaffected. Nations such as China, Taiwan, South Korea, and Japan, as well as emerging countries including India, are investing heavily in semiconductor fabs, OSAT, and Electronics Manufacturing Clusters, thereby driving increased demand for ATE in the Asia Pacific region. Government initiatives to produce semiconductors in China and export electronics are thus driving increased demand for semiconductor test solutions and ATE.
For instance, the 2020 SPECS Program: Helping India Make its Electronics Future-Proof report from the Ministry of Electronics and Information Technology describes the SPECS program. This program was launched to promote the manufacture of electronics in India. The program provides a 25% subsidy or incentive for investments in key components and semiconductor manufacturing. Additionally, the program provides support for the manufacture of related goods such as the ATMP unit and special sub-assemblies. The scheme is open for five years from the date of acknowledgment of the application and is administered by a designated nodal agency aimed at promoting high-value-added manufacturing.
North America is projected to experience the fastest CAGR during the forecast period. This is due to the region's major technology-driven industries, such as telecommunications, automotive, and aerospace, which increasingly rely on advanced testing solutions for their complex electronic systems. The rapid adoption of next-generation technologies such as 5G, electric vehicles, and IoT devices has further fueled demand for ATE. Also, North America has very strong R&D centers and investment in semiconductor manufacturing. This creates a dominant demand for automated testing solutions. A favorable business environment and government initiatives to encourage local manufacturing are among the major factors driving the growth of the North American automated test equipment market.
Source: Polaris Market Research Analysis
Curious About Regional Market Performance? Request Customization
Key Players & Competitive Analysis Report
The ATE competitive landscape is shaped by both global leaders and regional players competing to expand their share through innovation, strategic partnerships, and geographical diversification. The automated test equipment market players are concentrating on power semiconductor test systems, AI accelerators for validation, and enhanced memory solutions for testing. Such solutions help develop new use cases in the electric vehicle, data center, and edge AI spaces. The next-generation ATE industry is being driven by acquisitions of next-generation platforms. Today, there is an emerging requirement for advanced ATE systems to test next-generation technologies such as 5G, IoT, and autonomous cars. The market is expected to grow significantly due to increased electronics complexity and the need for appropriate testing. The companies are now catering to the domestic market, offering efficient and cost-effective solutions, and then entering the global market. Asia Pacific is likely to see the highest growth in the Automated Test Equipment market. Despite stiff competition, the market is using collaborations, M&As, and innovation. A few major players are Teradyne, Inc., Astronics Corporation, National Instruments Corp., Star Infomatic Pvt. Ltd.; Aeroflex, Inc.; Electronic Specifier; Danaher Corporation, Aemulus Corporation Sdn. Bhd.; Chroma ATE Inc.; Marvin Test Solutions, Inc
Teradyne Inc. is a leader in automatic test equipment and industrial automation. They develop innovative products and introduce them through state-of-the-art testing and robotics, ensuring the best possible results. They have innovative products, such as advanced semiconductor test systems and robots for task performance. Their corporate mission is founded on principles concerning business integrity, customer success, and corporate social responsibility. In March 2024, Teradyne Robotics collaborated with NVIDIA to boost robots with artificial intelligence.
Danaher Corporation is an American multinational conglomerate that was founded in 1984. Headquartered in Washington, D.C., it designs, manufactures, and markets a range of medical, industrial, and other commercial products and services. Its primary operating segments include Life Sciences, Diagnostics, and Environmental & Applied Solutions, for which it applies the powerful Danaher Business System (DBS). Historically, Danaher Corporation has combined acquisitions to meet strategic goals at various junctures, from humble beginnings in industry to becoming an advanced innovator in science and technology; in essence, this represents the evolution of Danaher Corporation.
List of Key Companies
- Teradyne, Inc.
- Astronics Corporation
- National Instruments Corp.
- Star Infomatic Pvt. Ltd.
- Aeroflex, Inc.
- Electronic Specifier
- Danaher Corporation
- Aemulus Corporation Sdn. Bhd.
- Chroma ATE Inc.
- Marvin Test Solutions, Inc.
Automated Test Equipment Industry Developments
- January 2025: Teradyne acquired Infineon's automated test equipment team in Regensburg, Germany, along with 80 employees. This acquisition widens Teradyne's testing capabilities for power semiconductors. This acquisition will also enable Teradyne to test silicon carbide- and GaN-based technologies.
- February 2025: Advantest unveiled the T5801 Ultra-High-Speed DRAM Test System, engineered to support GDDR7, LPDDR6, and DDR6 memory technologies for AI, high-performance computing, and edge applications. The system offers high-speed memory test performance up to 36Gbps PAM3 and 18Gbps NRZ
- January 2024: Rohde & Schwarz and Analog Devices, Inc. (ADI) unveiled their newest automated test platform for wireless battery management systems (wBMS). It is purpose-built for wireless device validation and high-volume production testing, building on established work in wBMS RF robustness evaluation.
- January 2023: Roos Instruments launched the RI8607 50 GHz Test Set, which enhances Cassini's vector measurement system. This versatile instrument expands testing capabilities to 50 GHz, making it suitable for demanding applications in automotive radar and cellular backhaul.
Automated Test Equipment Market Segmentation
By Type Outlook (Revenue USD Billion, 2021–2034)
- Non-Memory
- Memory
- Discrete
- Others
By Component Outlook (Revenue USD Billion, 2021–2034)
- Industrial PCs
- Handlers/Probers
- Mass Interconnect
- Others
By End User Outlook (Revenue USD Billion, 2021–2034)
- Automotive
- Healthcare
- Consumer Electronics
- Aerospace and Defense
- IT and Telecommunication
- Others
By Regional Outlook (Revenue USD Billion, 2021–2034)
- North America
- US
- Canada
- Europe
- Germany
- France
- UK
- Italy
- Spain
- Netherlands
- Russia
- Rest of Europe
- Asia Pacific
- China
- Japan
- India
- Malaysia
- South Korea
- Indonesia
- Australia
- Vietnam
- Rest of Asia Pacific
- Middle East & Africa
- Saudi Arabia
- UAE
- Israel
- South Africa
- Rest of Middle East & Africa
- Latin America
- Mexico
- Brazil
- Argentina
- Rest of Latin America
Automated Test Equipment Report Scope
| Report Attributes | Details |
| Market Size in 2025 | USD 8.24 Billion |
| Market Size in 2026 | USD 8.54 Billion |
| Revenue Forecast by 2034 | USD 11.40 Billion |
| CAGR | 3.3% from 2026 to 2034 |
| Base Year | 2025 |
| Historical Data | 2021–2024 |
| Forecast Period | 2026–2034 |
| Quantitative Units | Revenue in USD billion, 2021–2034, and CAGR from 2026 to 2034 |
| Report Coverage | Revenue Forecast, Market Competitive Landscape, Growth Factors, and Trends |
| Segments Covered |
|
| Regional Scope |
|
| Competitive Landscape |
|
| Report Format |
|
| Customization | Report customization as per your requirements with respect to countries, regions, and segmentation. |
Source: Polaris Market Research Analysis
Automated Test Equipment Market FAQ's
The role of Automated Test Equipment (ATE) is to test electronic components, semiconductors, and printed circuit boards for functionality, performance, and reliability. ATE is a vital part of manufacturing operations across many sectors, including semiconductor manufacturing, automotive electronics, aerospace, telecommunications, and consumer electronics.
The global automated test equipment market size was valued at USD 8.24 billion in 2025. It is expected to reach USD 11.40 billion in 2034, growing at a CAGR of 3.3% from 2026 to 2034.
Key industries driving demand for automated test equipment include semiconductor manufacturing, automotive electronics, consumer electronics, telecommunications, aerospace, and defense. It is in these industry sectors that demand for precise and reliable testing of complex ICs, power devices, RF components, and SoC solutions exists.
The basic categories of automatic test Equipment are non-memory testers, memory testers, discrete testers, wafer testers, and handlers/probers. They offer a range of functionalities to support test requirements across wafer-level, final test, and volume semiconductor manufacturing.
Major automated test equipment suppliers include Teradyne, Inc.; Astronics Corporation; National Instruments Corp.; Star Infomatic Pvt. Ltd.; Aeroflex, Inc.; Electronic Specifier; Danaher Corporation; Aemulus Corporation Sdn. Bhd.; Chroma ATE Inc.; Marvin Test Solutions, Inc. Companies deploy innovation, strategic partnerships, acquisitions, and investments in next-generation ATE platforms as part of their competitive strategies.
The handlers/probers segment is expected to grow fastest during the forecast period.
Download Sample Report of Automated Test Equipment Market
Please fill out the form to request a customized copy of the research report.
