
Backlit Displays Market Share, Global Analysis Report, 2025-2034
REPORT DETAILS
Market Statistics
The global Backlit Displays Market was valued at USD 7.5 billion in 2024 and is expected to grow at a CAGR of 8.30% from 2025 to 2034. Demand for high-visibility screens in automotive and consumer electronics is supporting expansion.
The growing importance of creating brand awareness and increasing companies' focus on conveying their product and service offerings to end users is largely contributing to the demand for the product in the market. Marketers are adopting new technologies for advertising day by day in response to changing consumer interests. This backlit display can assist them in grabbing their target audience's attention even in a large gathering due to its appealing illumination capability. These technologies adoption in laptops and televisions enabled them to display various colors within the compact their size and weight.
Source: Polaris Market Research Analysis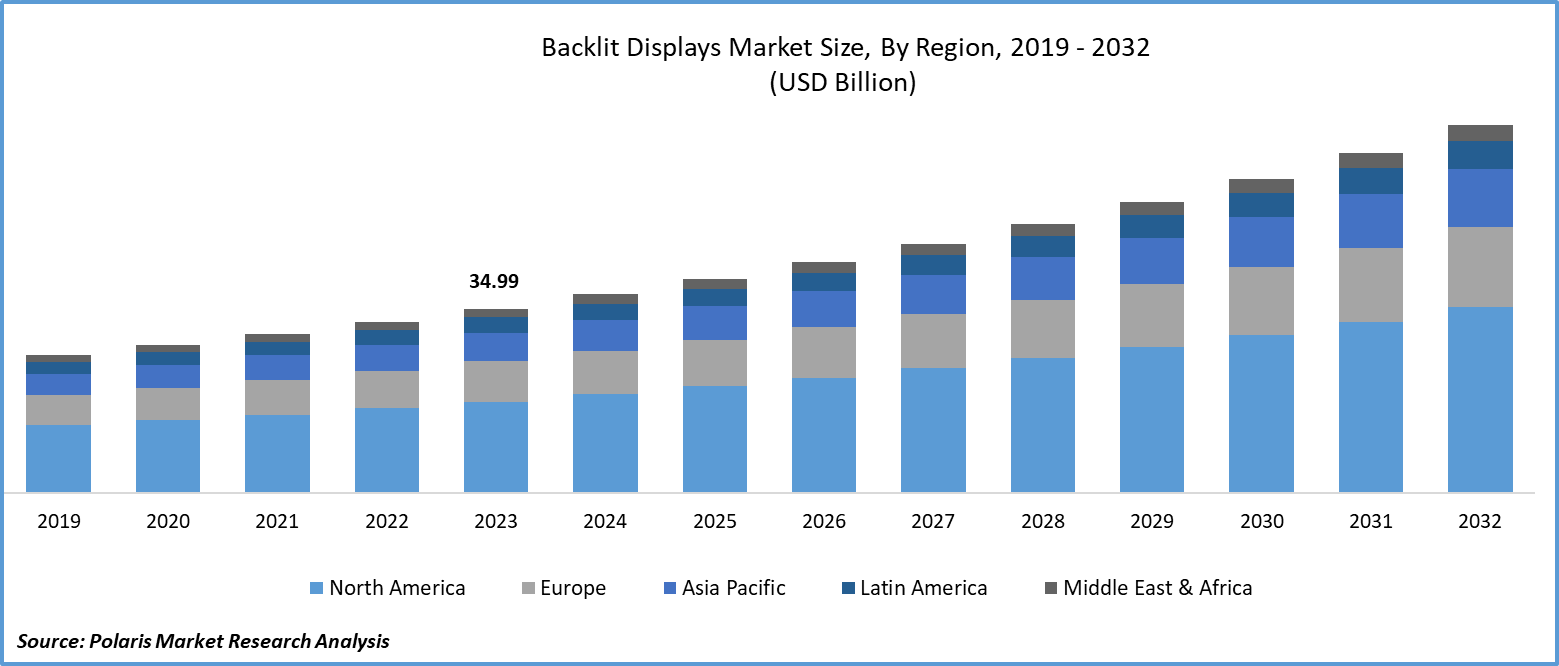
To Understand More About this Research: Download Sample Report
Furthermore, the adoption of backlit displays at the retail forefront is gaining traction nowadays, as creating a better store experience is becoming the key strategy by retailers to withstand competition from e-commerce platforms. These lights can effectively enhance the lighting in retail outlets. In addition, the rising demand for quality visuals in various disciplines, including online gaming, is widening the potential of the backlit market.
- For instance, in June 2022, ViewSonic introduced a range of ViewSonic ELITE professional gaming monitors with the Mini-LED Technology to improve the visual quality, optimize contrast, and provide greater convenience even in dimly lit conditions.
Moreover, backlit display is used in hospitals by management to ensure the safety of hospital staff, patients, and visitors. Interior warning signs, like MRI in use, play a major role in healthcare facilities as they can safeguard people from harmful rays. A variety of messages are used to image equipment rooms and pharmacy windows. These can assist patients in going to the required treatment destination in emergency conditions. However, the higher installation and maintenance costs of backlit displays are likely to deter their adoption by small and medium companies. These displays are used in places with a larger population.
Source: Polaris Market Research Analysis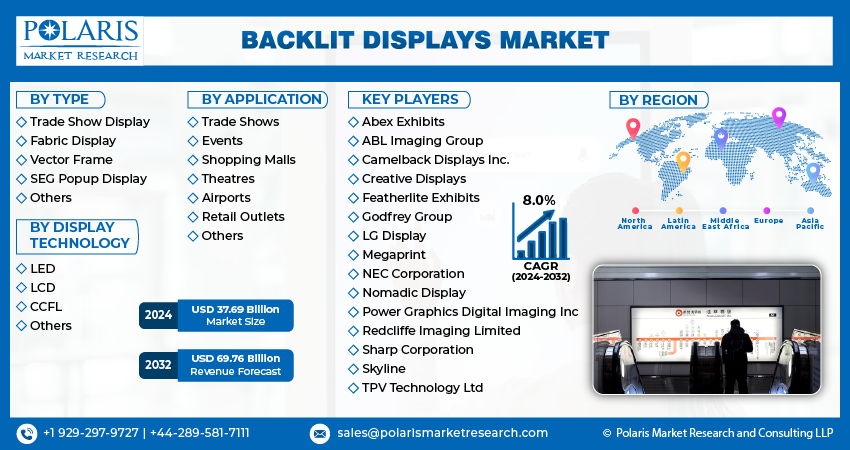
Get Full Segment-Level Forecasts & Insights: Download Sample Report
Growth Drivers
-
Rising use of backlit displays in trade shows is strengthening its adoption
The increasing number of trade shows gained the popularity of backlit displays, as usually they experience presentations of product offerings by a greater number of companies at the same time along with a larger pool of people. Adopting backlit displays is a feasible and optimal option, as they can create attractive booth space with lasting positive impressions on visitors, making them an effective marketing tool at trade shows. Additionally, highly visible content and quality graphics are further enhancing its demand in the marketplace. The increasing number of national and international sports competitions, concerts, trade shows, and exhibitions are expected to boost the demand for backlit displays in the next few years.
Report Segmentation
The market is primarily segmented based on type, display technology, application, and region.
| By Type | By Display Technology | By Application | By Region |
|
|
|
|
Source: Polaris Market Research Analysis
To Understand the Scope of this Report: Request Customization
By Type Analysis
-
SEG popup display segment is expected to witness the highest growth during the forecast period
The SEG popup display segment will grow rapidly, mainly driven by its high-resolution graphics. First impressions play an effective role in driving the adoption of products among consumers at trade shows, retail outlets, and other events. These displays offer a captivating visual look that can contribute to the rise in foot traffic and increased user engagement driven by fascinating graphics. Furthermore, these are known to have a lightweight and simple set-up that one person can complete. This ease of use is expected further to fuel SEG popup display adoption in the coming years.
The trade show display segment led the industry market with a substantial revenue share in 2023, largely attributable to its ability to offer enchanting visuals at trade shows, stadiums, airports, and retail outlets. The rising concerns by companies to gain attention at the larger gatherings are expected to fuel its adoption soon.
By Display Technology Analysis
-
LED segment accounted for the largest market share in 2024
The LED segment held the largest share. Marketers and advertisers are showing interest in adopting LED displays for promotional campaigns and advertisements, attributable to their higher energy efficiency, durability, lower operational cost, and ability to provide colorful and shiny visuals day and night. Furthermore, these lights are used in outer environments due to their reliability and ability to withstand harsh environmental conditions, including sunlight, cold, and heat. Moreover, these are great sources for branding and efficiently drive revenue for businesses as they allow customers to spot their products in the crowd. These factors are expected to boost demand for LED backlit displays in the foreseeable future.
The LCD segment is expected to grow at the fastest rate over the next few years on account of the prevalence of adoption in the market and its potential to offer wide viewing angles, driving adoption in theaters and TVs.
By Application Analysis
-
Shopping malls segment held the significant market revenue share in 2024
The shopping malls segment held a significant share due to the continuous rise in the use of digital displays in shopping malls. Digitalization and technological evolution are making shopping malls adopt effective advertising and marketing tools to increase customer attention by showing their latest offerings and discounts. Due to its clear visibility from longer distances, shopping malls are installing backlit displays in front of their stores. The rapid shift in consumer preference towards outings, primarily shopping, among women is stimulating shopping malls to attract the target audience's attention.
Source: Polaris Market Research Analysis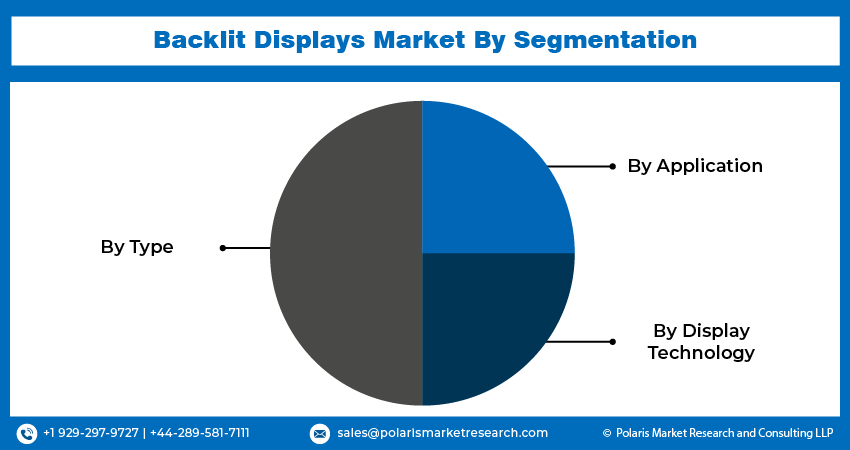
Need Granular Data Across All Market Segments? Request Customization
Regional Insights
-
North America region registered the largest share in global market in 2024
The North America region held the global backlit displays market with the largest market share in 2024 and is expected to continue its dominance over the study period. The presence of larger players and increasing global expansion activities by key market players are creating new growth opportunities in the region. For instance, in 2023, LG unveiled its new headquarters in North America, highlighting the power and versatility of advanced display technologies.
The Asia Pacific region is expected to be the fastest-growing region, with a healthy CAGR during the projected period, owing to the increasing adoption of digital gadgets in the region. This region has a larger population and is expected to continue this trend in the future, contributing to the demand for digital gadgets. The COVID-19 pandemic stimulated the need for laptops due to stringent lockdown regulations, which led to a rise in work-from-home culture and online classes. According to the Just Dial Consumer Report in 2022, the y-o-y demand for laptops in tier 2 cities in India roe by nearly 28%, while tier 1 is at 9%. The ongoing demand for laptops is expected to create new growth potential for backlit displays in the region during the forecast period.
Source: Polaris Market Research Analysis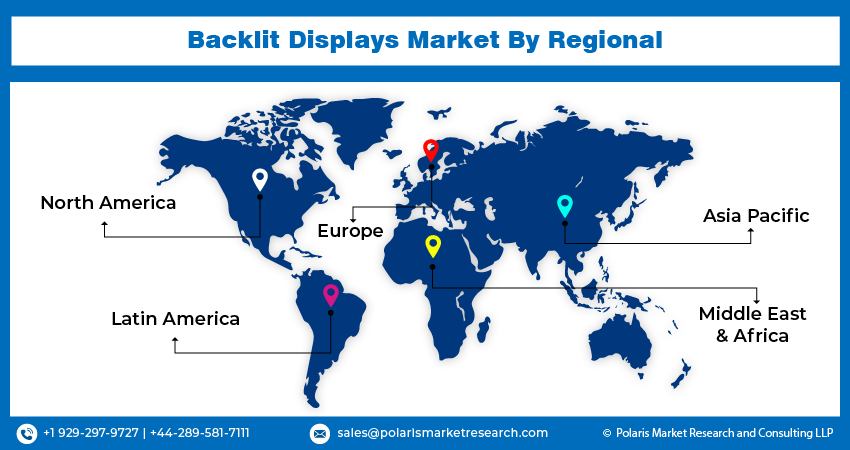
Curious About Regional Market Performance? Request Customization
Key Market Players & Competitive Insights
The backlit display market is witnessing higher competition due to the presence of several market players, along with the ongoing product innovations in the marketplace. The rising technological advancements in the printing sector are driving the application of backlit in numerous areas. For instance, Opti-Luxx introduced a new backlit illuminated LED retroreflective school bus sign in 2024. The increasing focus of companies on improving visual quality and appealing interfaces for advertising, digital gadgets, and signage is contributing to the expansion of the market.
Some of the major players operating in the global market include:
- Abex Exhibits
- ABL Imaging Group
- Camelback Displays Inc.
- Creative Displays
- Featherlite Exhibits
- Godfrey Group
- LG Display
- Megaprint
- NEC Corporation
- Nomadic Display
- Power Graphics Digital Imaging Inc
- Redcliffe Imaging Limited
- Sharp Corporation
- Skyline
- TPV Technology Ltd
Recent Developments
- In April 2025, Samsung plans to launch a 115-inch RGB microLED-backlit LCD TV by late 2025, offering better color and contrast than miniLEDs, though it’s not a true emissive microLED display.
- In May 2022, Eyesafe introduced its latest innovation of blue light management technology for LED backlit displays, Eyesafe DTX. It has the potential to reduce the toxicity of blue light, maintain white points, and provide tools that enhance luminance and color gamut.
Backlit Displays Market Report Scope
| Report Attributes | Details |
| Market size value in 2025 | USD 8.1 billion |
| Revenue forecast in 2034 | USD 15.2 billion |
| CAGR | 8.30% from 2025 – 2034 |
| Base year | 2024 |
| Historical data | 2020 – 2023 |
| Forecast period | 2025 – 2034 |
| Quantitative units | Revenue in USD billion and CAGR from 2025 to 2034 |
| Segments covered | By Type, By Display Technology, By Application, By Region |
| Regional scope | North America, Europe, Asia Pacific, Latin America, Middle East & Africa |
| Customization | Report customization as per your requirements with respect to countries, region and segmentation. |
Source: Polaris Market Research Analysis
Backlit Displays Market FAQ's
The global backlit displays market size is expected to reach USD 15.2 billion by 2034
Key players in the market are Abex Exhibits, ABL Imaging Group, Camelback Displays, Creative Displays
North America contribute notably towards the global backlit displays market
The global backlit displays market is expected to grow at a CAGR of 8.30% during the forecast period.
The backlit displays market report covering key segments are type, display technology, application, and region.
Download Sample Report of Backlit Displays Market
Please fill out the form to request a customized copy of the research report.
