
Bakery Products Market Size, Challenges , Growth Factor, 2025 - 2034
REPORT DETAILS
What is the Current Market Size?
The global bakery products market size and share was valued at USD 517.17 billion in 2024 and is expected to grow at a CAGR of 5.2% during the forecast period. Key factors driving the demand includes rising ready-to-eat food demand due to busy lifestyles, growing health-conscious consumer choices favoring artisanal products, and the escalating per-capita income.
Key Insights
- By distribution channel, the specialty store segment held the largest share in 2024 due to the increasing awareness of health considerations.
- By product, the bread and rolls subsegment held the largest share in 2024 due to bread being a staple food in many cultures worldwide.
- By region, Europe held the largest share in 2024 as it is largely fueled by a deep-rooted baking tradition and cultural affinity for various baked goods.
- Asia Pacific is expected to witness the fastest growth due to the escalating population and the concurrent rise in per-capita income levels.
Industry Dynamics
- Growing demand for convenient and ready-to-eat food options is a major driver, as modern, fast-paced lifestyles and increasing urbanization lead consumers to seek quick and easy meal or snack choices.
- The increasing focus on health and wellness among consumers significantly propels innovation and demand for healthier baked goods alternatives.
- Rising disposable incomes and rapid global urbanization are boosting consumer spending on diversified and premium baked items, especially in developing economies.
Market Statistics
- 2024 Market Size: USD 517.74 billion
- 2034 Projected Market Size: USD 860.08 billion
- CAGR (2025-2034): 5.2%
- Europe: Largest market in 2024
AI Impact on Market
- Raise labor productivity by automating routine tasks and improving decision-making through advanced analytics.
- Changing the competitive landscape. In some cases, it can lower the barriers to entry for new companies by providing tools that help them compete with established businesses.
- Taking over repetitive tasks, which leads to a shift in the kinds of skills needed in the labor market.
What Does the Current Market Landscape Look for Bakery Products?
The success of Thai and Mexican cuisine has sparked a heightened interest in exploring new culinary experiences, and bakery products have emerged as a natural accompaniment to these flavorful dishes. This surge in demand for bakery items is driven by consumers seeking to recreate the full spectrum of flavors and textures associated with these ethnic cuisines, ultimately enriching their dining experiences.
Bakery products are food items that are made and marketed by bakery firms specializing in baking and vending baked goods. These products contain a broad range of items, usually produced from sugar, flour, eggs, and other ingredients. Some of the bakery products contain cakes, bread, cookies, pastries, bagels, muffins, and croissants. Also, these products are an essential part of different cultures worldwide. They serve various preferences and tastes, and their popularity continues to expand due to their tasty flavors and versatility, which is increasing the bakery products market trend.
Furthermore, convenient, ready-to-eat bakery products are becoming more and more popular among customers as their dietary habits and lifestyles change. Also, there has been a noticeable rise in the desire for healthier products like whole-grain bread and low-sugar pastries. And, as people's lives become more hectic and urbanized, there is a growing need for packaged and portable bakery goods that fit their fast-paced lifestyles. As a result, the bakery products market size is growing.
Baked products are excessively consumed nowadays and configure as an intrinsic part of the everyday diet. They extend from yeast-elevated commodities such as bread, baguettes, rolls, and pizza bases to sweets involving cakes, muffins, and cookies. For a long time, enzymes have been assumed as organic catalysts to assist bakers in acquiring the greatest from their raw materials. Presently, they not only have to be nutritious, but also they should savor fresh for many days and look tempting.
Consumers want bread that looks, savors, and gets a sniff of being freshly baked even after having been reserved for some time. Therefore, bread frequently transcends the list of unnecessary food waste. The bakery products market demand is on the rise as freshness can be specifically hard to obtain in frozen and pre-baked commodities as well as in par-baked commodities that are baked doubly and so lose track of moisture. Baking enzymes assist in tackling this as they transform starch into glucose, which caters to the yeast and provides the bread with superior volume and crust color.
Source: Polaris Market Research Analysis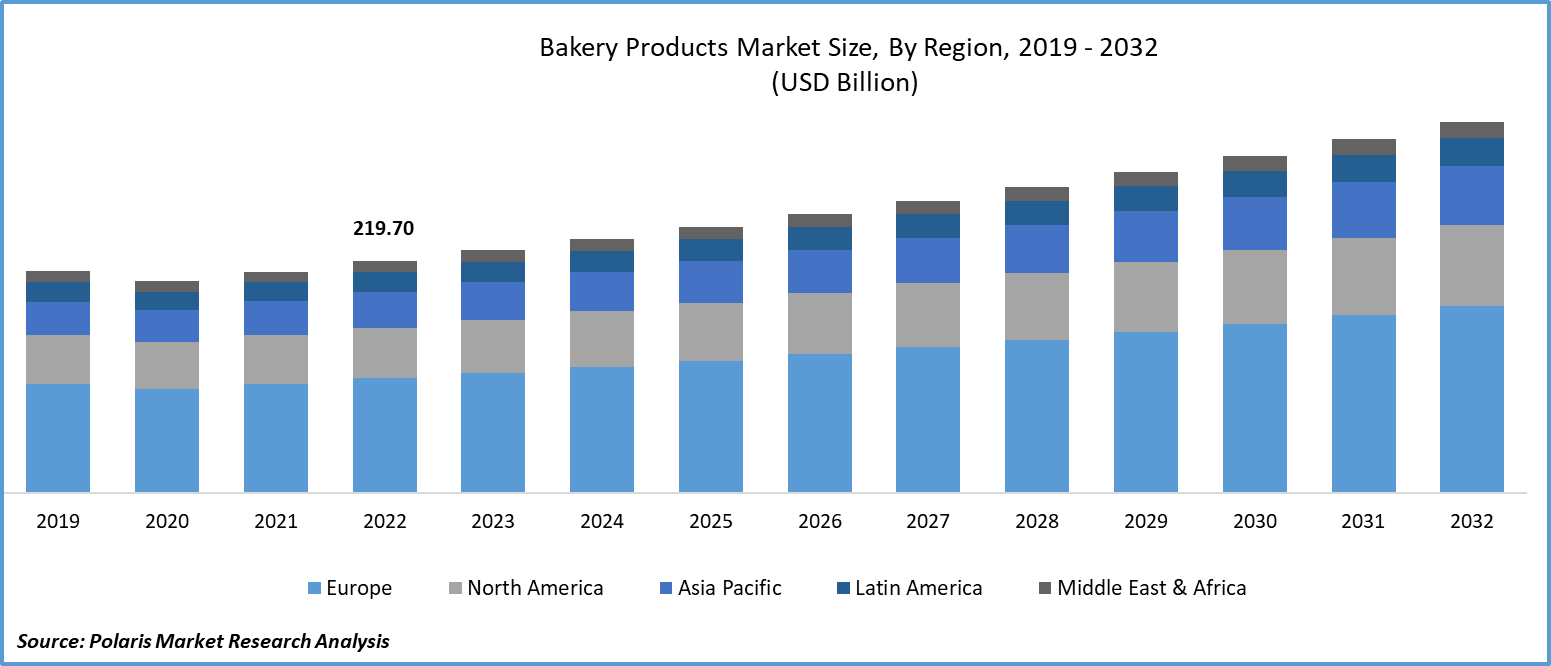
To Understand More About this Research: Download Sample Report
The escalating per-capita income within these nations is poised to contribute to the expansion of the regional market significantly. The foundational raw materials essential to produce bakery products encompass a range of components, including milk, emulsifiers, fats, stabilizers, flavors, sugar, and flour. The pricing dynamics of bakery products are intricately linked to the costs and availability of these raw materials. The equilibrium between supply and demand, as well as the inherent uncertainties, have prompted several companies, like Associated British Foods, Dawn Foods, and Bakels, to adopt backward integration strategies. This strategic approach aids in managing potential supply disruptions and market fluctuations.
It's important to note that the bakery product market involves a substantial utilization of energy, along with significant costs associated with logistics and storage. This is attributed to the necessity of transporting these products using specialized automotive components equipped with advanced refrigeration capabilities to ensure product quality and safety. These factors, while integral to maintaining product integrity, may pose certain constraints on the growth of the market.
Source: Polaris Market Research Analysis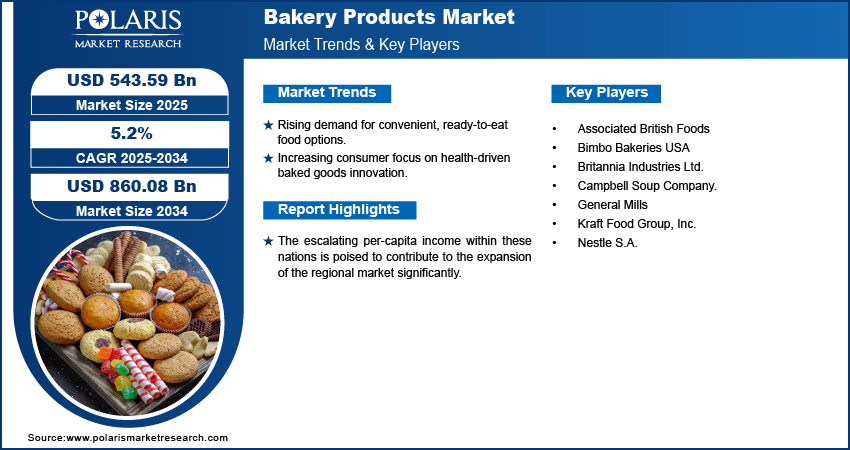
Get Full Segment-Level Forecasts & Insights: Download Sample Report
Industry Dynamics
Growth Drivers
What are the Factors Driving the Demand?
Rising ready-to-eat food demand due to busy lifestyles
The global trend of escalating consumption of ready-to-eat foods can be attributed to the prevailing fast-paced lifestyles that individuals lead. This shift in dietary preferences is poised to act as a driving force behind the demand for these products throughout the projected years. The convenience and time efficiency offered by ready-to-eat options cater to the demands of modern life, making them an increasingly popular choice among consumers.
Furthermore, the rise in the preference for ethnic cuisines has significantly impacted the culinary landscape. This is especially evident in the European market, where ethnic foods like Thai and Mexican cuisines have achieved notable success in various restaurants and food outlets. As a result, there has been a notable increase in the demand for bakery products that complement these ethnic flavors.
Report Segmentation
The market is primarily segmented based on product, distribution channel, and region.
| By Product | By Distribution Channel | By Region |
|
|
|
Source: Polaris Market Research Analysis
To Understand the Scope of this Report: Request Customization
Product Analysis
Which Segment by Product Accounted for the Largest Market Share?
The bread and rolls segment accounted for the largest market share, primarily driven by a substantial surge in demand for these products across key regions. The cake and pastries segment will grow at a steady pace. This projection is primarily attributed to the introduction of innovative flavors that resonate with consumers and the simultaneous uptick in disposable income levels among the consumer base. Additionally, the expanding population in the emerging region offers a promising landscape for industry players, presenting enduring opportunities for long-term growth and engagement.
Distribution Channel Analysis
Why Specialty Stores Segment Dominated the Market?
The specialty stores segment dominated the market and is projected to register the highest growth rate over the study period. This growth is primarily due to the increasing awareness of health considerations, which has prompted bakery producers to incorporate functional elements into their offerings. This includes the integration of ingredients like legumes, oats, probiotics, fortified margarine, and cereals. As a result, the consistent pursuit of innovative product development stands as a driving force that has the potential to amplify the growth trajectory of the industry greatly.
Source: Polaris Market Research Analysis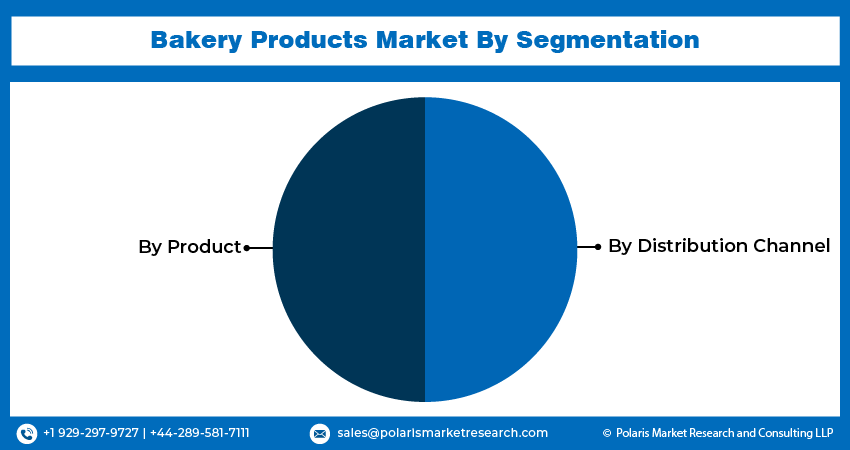
Need Granular Data Across All Market Segments? Request Customization
Regional Insights
Which Region Held the Largest Share of the Market?
Europe held the largest share. This prominence is attributed to the robust demand observed for a diverse range of baked products within the region. Notably, products like gluten-free options, high-fiber selections, and Trans-fat-free items are capturing significant attention due to their status as staple foods in European diets.
The escalating demand for these baked goods is closely aligned with the prevailing health-conscious trends among consumers. Gluten-free options cater to individuals with gluten sensitivities or celiac disease. At the same time, high-fiber products align with the growing awareness of the importance of dietary fiber in promoting digestive health and overall wellness. Moreover, the avoidance of Trans fats resonates with health-conscious consumers aiming to minimize their intake of unhealthy fats linked to adverse health effects.
Given the central role of baked goods in European diets and the simultaneous shifts in dietary preferences, the market for these specialized products is experiencing substantial growth. This dynamic underscores the significance of the region as both a dominant force and a rapidly advancing player within the baked goods industry. The industry's responsiveness to evolving dietary preferences, coupled with the demand for staple baked products, underscores the intricate relationship between food trends and market dynamics.
What are the Factors Contributing to the Growth Opportunities of Asia Pacific?
Asia Pacific is expected to witness the fastest growth. This projection is grounded in the strategic presence of prominent companies within emerging economies, notably China, India, Singapore, and Japan. These countries' pivotal roles within the region serve as significant catalysts for the anticipated growth trajectory. The burgeoning markets of the region hold tremendous growth potential, predominantly due to two key factors: the escalating population and the concurrent rise in per-capita income levels. This synergy creates a fertile ground for the expansion of various industries, including the bakery products market.
Additionally, a noteworthy driver of the market's growth within the region stems from the heightened demand observed for breakfast grains and cereals, particularly in countries like China and India. These staple food items hold immense cultural significance and cater to the dietary preferences of the local populations. The growing awareness of the importance of a nutritious breakfast, coupled with the convenience offered by these products, further fuels their demand.
Source: Polaris Market Research Analysis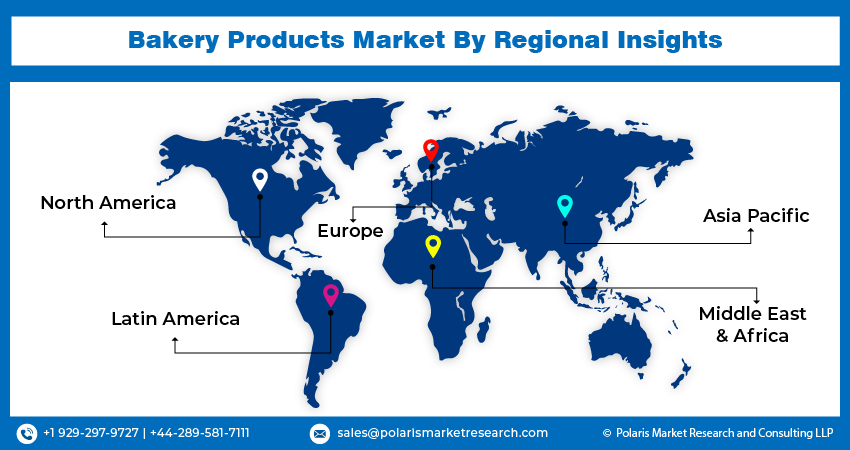
Curious About Regional Market Performance? Request Customization
Key Market Players & Competitive Insights
Significant hurdles in the form of high entry barriers, stemming from strong brand loyalty and substantial capital requirements, are expected to sustain a fiercely competitive environment within the industry. Prominent companies within the sector are committed to achieving optimal business expansion through the implementation of diverse growth strategies. These strategies encompass forging joint ventures, executing mergers and acquisitions, establishing strategic partnerships with regional manufacturers, and broadening the scope of distribution channels.
Some of the major players operating in the global market include:
- Associated British Foods
- Bimbo Bakeries USA
- Britannia Industries Ltd.
- Campbell Soup Company.
- General Mills
- Kraft Food Group, Inc.
- Nestle S.A.
Recent Developments
- March 2025: Vandemoortele and Délifrance announced their plan to merge, forming a global leader in the frozen bakery sector with a combined estimated turnover of €2.4 billion.
- April 2025: Commercial Bakeries Corp finalized the strategic acquisition of Hollandia Bakeries Ltd. and the Good Food Company Inc., broadening its presence in the North American private-label cookie market and expanding its overall bakery network.
- January 2023: Sara Lee Bread unveiled a fresh addition to its lineup – a new white bread infused with vegetables. This 18-ounce loaf delivers a delectable flavor and also boasts the inclusion of one cup of vegetables. Packed with essential vitamins A, D, and E, the bread offers a smooth texture and balanced nutrition. Importantly, it is crafted without the addition of artificial colors, flavors, or high fructose corn syrup.
- July 2022: Britannia introduced its newest offering, the Biscafe cracker, which boasts a delightful coffee flavor. This innovative product is strategically aimed at capturing the interest of a younger demographic.
Bakery Products Market Report Scope
| Report Attributes | Details |
| Market size value in 2024 | USD 517.74 billion |
| Market size value in 2025 | USD 543.59 billion |
| Revenue Forecast in 2034 | USD 860.08 billion |
| CAGR | 5.2% from 2025 – 2034 |
| Base year | 2024 |
| Historical data | 2020 – 2023 |
| Forecast period | 2025 – 2034 |
| Quantitative units | Revenue in USD billion and CAGR from 2025 to 2034 |
| Segments Covered | By Product, By Distribution Channel, By Region |
| Regional scope | North America, Europe, Asia Pacific, Latin America; Middle East & Africa |
| Customization | Report customization as per your requirements with respect to countries, regions, and segmentation. |
Source: Polaris Market Research Analysis
Browse for Our Top Selling Reports
Disposable Medical Sensors Market Size & Share
Portable Dishwasher Market Size & Share
Dental Service Organization Market Size & Share
Quick Commerce Market Size & Share
Amusement Parks Market Size & Share
Explore the market dynamics of the 2024 bakery products sector, encompassing market share, size, and revenue growth rate, meticulously examined in the insightful reports crafted by Polaris Market Research Industry Reports. The analysis of the bakery products market extends to a comprehensive market forecast up to 2032, coupled with a retrospective examination. Avail yourself of a Download Sample Report.
Bakery Products Market FAQ's
• The global market size was valued at USD 517.74 billion in 2024 and is projected to grow to USD 860.08 billion by 2034.
• The global market is projected to register a CAGR of 5.2% during the forecast period.
• Europe dominated the market in 2024.
• A few of the key players in the market are Associated British Foods; Bimbo Bakeries USA; Britannia Industries Ltd.; Campbell Soup Company; General Mills; Kraft Food Group, Inc.; Nestle S.A.
• The supermarkets and hypermarkets segment held the largest share in 2024.
Download Sample Report of Bakery Products Market
Please fill out the form to request a customized copy of the research report.
