
Bus Market Size, Share, Growth, Trends Report, 2026-2034
REPORT DETAILS
Market Statistics
Bus Market Overview
The global bus market size was valued at USD 96.92 billion in 2025, growing at a CAGR of 3.7% from 2026 to 2034. Key factors driving demand for bus include expansion of urban areas and rising urbanization, government initiatives aimed at promoting sustainable public transport, decline in battery costs, combined with advancements in electric vehicle (EV) technology, and growth in tourism and intercity travel.
Key Insights
- Asia Pacific captured 48.58% of the global market in 2025, driven by rapid urbanization, growing populations, and increasing reliance on public transportation.
- India represented 21.69% of the Asia Pacific market in 2025, largely due to its strong dependence on buses as an affordable and widely used mass transit option.
- North America held a 14.58% share of the global bus market in 2025, supported by its well-developed transportation infrastructure and widespread adoption of advanced mobility solutions.
- The 6-meter segment held 34.93% of revenue in 2025 as it is well-suited for navigating busy city streets and providing efficient last-mile connectivity.
- The electric segment is expected to grow the fastest, with an 11.1% CAGR during the forecast period. The growth is fueled by the global push toward cleaner and more sustainable transportation options.
- The 31 to 50 segment held a 33.06% share in 2025, mainly because it strikes a good balance between passenger capacity and operational efficiency.
Industry Dynamics
- Cheaper batteries and better EV tech are driving electric bus adoption. Lower costs make them more affordable for cities and operators, speeding up the shift from diesel to electric.
- More tourism and intercity trips are boosting bus demand. Buses offer budget-friendly travel for groups and routes where trains or planes aren’t practical.
- High upfront costs of electric buses remain a barrier, especially for smaller operators, despite long-term savings. Charging infrastructure gaps also slow adoption in developing regions.
- Government incentives and falling battery prices are accelerating the shift to electric buses, creating growth potential for manufacturers and clean-energy transit solutions.
Market Statistics
- 2025 Market Size: USD 96.92 billion
- 2034 Projected Market Size: USD 134.22 billion
- CAGR (2026–2034): 3.7%
- Asia Pacific: Largest market in 2025
AI Impact on Bus Market
- AI improves bus scheduling and routing using real-time traffic data, reducing delays and fuel costs while enhancing service reliability for passengers.
- AI tools monitor vehicle health to detect issues early, minimizing breakdowns and repair costs, ensuring higher fleet uptime and operational efficiency.
- AI analyzes travel patterns to adjust bus frequency and capacity, optimizing resource use and reducing overcrowding or empty runs.
- AI enables self-driving bus pilots, cutting labor costs and improving safety, though regulatory and infrastructure challenges remain for full-scale adoption.
A bus serves as a cornerstone of modern public transportation systems. The expansion of urban areas and rising urbanization have greatly fueled the demand for buses, as cities face increasing population densities and growing traffic congestion. There is an increasing need for efficient and cost-effective transit solutions that can move large numbers of commuters while minimizing road congestion, as more people migrate to urban centers. This need aligns directly with the increasing reliance on public transit, as buses offer flexibility, affordability, and connectivity across diverse urban and suburban routes. Consequently, urbanization positions buses as a sustainable mobility solution in crowded metropolitan landscapes.
Source: Polaris Market Research Analysis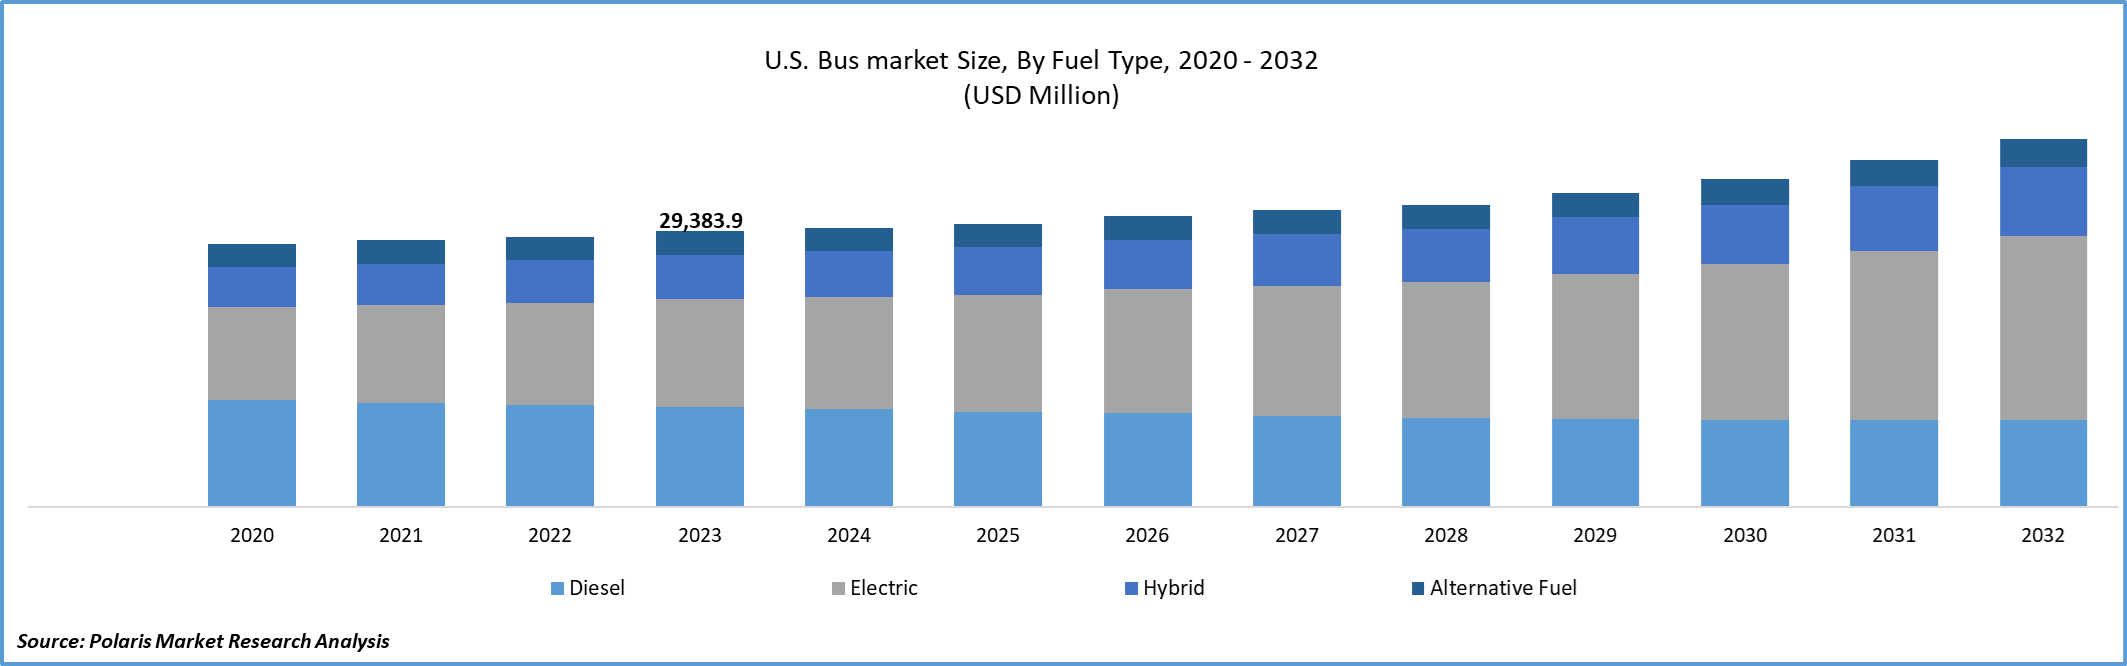
Want a Deeper Look at Key Market Players? Download Sample Report
The growing focus on government initiatives aimed at promoting sustainable public transport further contributes to the growth opportunities. Many governments worldwide are focusing on reducing carbon emissions, improving air quality, and addressing environmental concerns by investing in eco-friendly bus fleets, such as electric and hybrid models. For instance, in April 2025, the UK Department for Transport allocated USD 48.5 million to support 12 local authorities in deploying 319 zero-emission buses by 2027. The funding aims to expand electric and hydrogen fleets under the Confederation of Passenger Transport's initiative. Additionally, policy support, subsidies, and infrastructure development, such as EV charging stations and dedicated bus lanes, further strengthen this push toward sustainable mobility. These initiatives enhance the adoption of buses as a cleaner, safer, and more efficient alternative by encouraging a shift from private vehicle use to mass transit systems. This regulatory focus accelerates the transition to greener fleets and also ensures that buses remain a central component of future urban mobility frameworks.
Drivers & Opportunities
Declining Battery Costs & Advancements in EV Technology: The decline in battery costs, combined with advancements in electric vehicle (EV) technology, has emerged as a major contributor to the growth opportunities. Falling battery prices are making electric buses increasingly affordable for both manufacturers and transit authorities, lowering the overall cost of ownership and encouraging adoption. At the same time, improvements in battery efficiency, charging infrastructure, and vehicle range are enhancing the reliability and operational capabilities of electric buses. For instance, in September 2024, Contemporary Amperex Technology Co., Limited (CATL) launched its TECTRANS battery system for commercial vehicles, featuring high energy density and fast-charging capabilities. The lineup includes heavy-duty truck versions with ultra-fast charging, achieving 70% charge in 15 minutes, and extended lifespan, aiming to improve fleet efficiency and range. These technological advancements reduce dependency on fossil fuels and also support the global push for cleaner and more sustainable urban mobility. As a result, declining battery costs and EV innovations are accelerating the transition of bus fleets toward electrification, strengthening their position as a viable long-term solution in public transport.
Growth in Tourism & Intercity Travel: The growth in tourism and intercity travel contributes to the expansion opportunities, as buses remain one of the most practical and economical modes of transport for long-distance and group travel. Increasing domestic and international tourism is boosting demand for comfortable, safe, and cost-effective mobility options, particularly for routes that are less accessible by rail or air. A 2024 Ministry of Tourism annual report stated that in 2024, India recorded 9.66 million foreign tourist arrivals, generating USD 33.3 billion in foreign exchange earnings, a 19.8% growth. Domestic tourism remained strong with 2.51 billion visits in 2023, reflecting strong growth opportunities. Intercity bus services bridge this gap, offering flexibility, affordability, and direct connectivity across regions. Moreover, the expansion of tourism infrastructure, along with a rising preference for organized travel experiences, further boosts the demand for modern, well-equipped bus fleets. This expansion reinforces the importance of buses as a means of daily commuting and also as a cornerstone of regional connectivity and tourism growth.
Source: Polaris Market Research Analysis
Get Full Segment-Level Forecasts & Insights: Download Sample Report
Segmental Insights
Length Analysis
Based on length, the segmentation includes below 6m, 6-8m, 8-10m, 10-12m, and above 12m. The below 6m segment accounted for 34.93% revenue share in 2025 due to its suitability for navigating congested city streets and offering efficient last-mile connectivity. These compact buses are widely adopted in urban areas with narrow roads, where maneuverability and lower operating costs are critical. Their affordability and ability to cater to shorter routes make them particularly attractive for public and private fleet operators. Additionally, growing demand for feeder services that connect passengers to larger transit networks has strengthened the adoption of this segment, further consolidating its strong market presence.
The 6-8m segment is expected to grow at a significant pace with a CAGR of 3.2% supported by its balanced size and versatility. These buses strike a middle ground between compact models and larger vehicles, making them suitable for both short-distance and medium-distance routes. Their adaptability is particularly useful in semi-urban areas, tier-two cities, and for specific services such as staff transport and shuttle operations. Moreover, improvements in seating comfort, fuel efficiency, and capacity optimization have increased their attractiveness among fleet operators. Therefore, as cities expand and demand rises for flexible yet efficient mobility solutions, this segment is projected to witness consistent growth.
Fuel Type Analysis
In terms of fuel type, the segmentation includes diesel, electric, hybrid, and alternative fuel. The diesel segment dominated the revenue share with 74.82% in 2025 due to its established infrastructure, cost-effectiveness, and reliability for long-distance and high-capacity transport. Diesel engines are widely recognized for their durability, high power output, and ability to perform efficiently in diverse terrains and weather conditions. The extensive availability of refueling networks further supports the dominance of diesel buses, especially in regions where alternative fuel infrastructure remains limited. Their proven track record and lower upfront cost compared to newer technologies continue to make them a preferred choice for operators.
The electric segment is projected to witness the highest CAGR of 11.1% during the forecast period, driven by the global shift toward cleaner and more sustainable transportation solutions. Increasing environmental concerns, coupled with advancements in battery efficiency and charging infrastructure, are making electric buses more practical and cost-competitive. Governments are also offering subsidies and incentives to encourage fleet electrification, further supporting the segment’s expansion. Additionally, reduced operational costs and lower emissions make electric buses an attractive alternative to diesel models, positioning this segment as the future of sustainable public transit.
Comparison Matrix: Diesel vs Electric vs Hybrid Buses
| Parameter | Diesel Bus | Electric Bus | Hybrid Bus |
| Power Source | Internal combustion engine using diesel fuel | Battery-powered electric motor | Combination of diesel engine + electric motor |
| Initial Cost | Lower upfront cost | High upfront cost due to battery systems | Moderate to high upfront cost |
| Operating Cost | High due to fuel consumption and maintenance | Lower due to reduced fuel and fewer moving parts | Moderate; fuel savings better than diesel |
| Maintenance | Frequent engine, transmission, and exhaust maintenance | Lower maintenance; fewer moving parts and regenerative braking | Moderate maintenance; both engine and battery systems require service |
| Emissions | High CO₂ and NOx emissions | Zero tailpipe emissions | Lower emissions than diesel but not zero |
| Noise Level | Higher engine noise | Very quiet operation | Quieter than diesel, but louder than electric |
| Range | Long range; suitable for intercity routes | Limited by battery range; best for urban routes | Better range than electric; suitable for mixed routes |
| Charging/Fuel Infrastructure | Widely available diesel fueling stations | Requires charging stations and grid support | Uses fuel stations; limited charging dependency |
| Key Use Case | Long-distance and rural transport | Urban public transport and smart cities | City routes with stop-and-go traffic |
| Sustainability | Low | Very high | Medium to high |
Source: Polaris Market Research Analysis
Seating Capacity Analysis
The segmentation, based on seating capacity, includes below 15, 15 to 30, 31 to 50, and above 50. The 31 to 50 segment accounted for a 33.06% share in 2025 primarily due to its ability to balance passenger volume and operational efficiency. These buses are widely used in both intra-city and intercity applications, offering sufficient capacity without compromising on maneuverability. Their adaptability makes them suitable for transit buses, school transport, and tourist services, where medium capacity is often in high demand. Operators favor this range for its cost-effectiveness and flexibility, ensuring that it remains the most widely adopted seating category in the market.
The 15 to 30 segment is expected to grow at a significant CAGR of 3.7% during the forecast period, driven by increasing demand for shuttle services, staff transportation, and school buses. These buses are compact yet capable of carrying a moderate number of passengers, making them an efficient choice for short to medium-distance travel. Their versatility and ease of operation also make them suitable for routes in semi-urban and suburban areas. Rising demand for corporate mobility solutions and localized travel needs further support growth in this segment, highlighting its role in expanding transport networks beyond major cities.
Application Analysis
Based on application, the segmentation includes transit bus, intercity/motor coaches, school bus, tourist bus, staff pickup/hotel shuttle, and others. The transit bus segment accounted for 31.69% share in 2025 due to the rising reliance on public transport in urban areas facing congestion and population growth. Transit buses provide high-frequency, cost-effective solutions that serve as the backbone of city transport systems. Their ability to accommodate large numbers of passengers while reducing the number of private vehicles on roads enhances urban mobility efficiency. Additionally, ongoing investments in public transit infrastructure by municipal bodies are reinforcing the demand for this segment, ensuring its continued market leadership.
The intercity/motor coaches segment is expected to witness robust growth at a CAGR of 3.8% during the forecast period, owing to increasing demand for comfortable and economical long-distance travel. These buses are designed with enhanced seating capacity, luggage space, and amenities, making them attractive alternatives to rail and air travel for regional connectivity. Growing tourism, along with rising intercity commuting, is further driving the adoption of motor coaches. This segment is positioned to capture strong growth with advancements in design and passenger comfort, particularly in regions where intercity transport networks are expanding.
Source: Polaris Market Research Analysis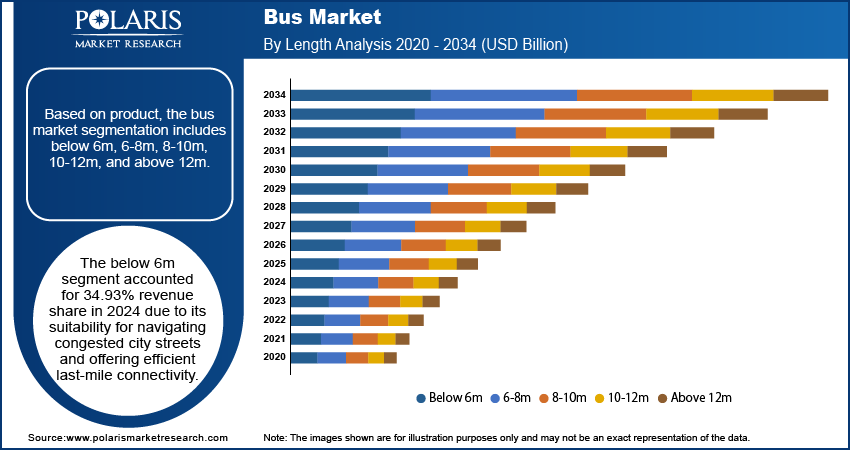
Need Granular Data Across All Market Segments? Request Customization
Regional Analysis
The North America bus market accounted for a substantial market share in 2025. This dominance is attributed to the region’s well-established transportation infrastructure and strong adoption of advanced mobility solutions. The widespread use of buses for school transport, public commuting, and intercity travel highlights their central role in the region’s mobility ecosystem. Additionally, the presence of leading manufacturers and continuous investments in fleet modernization, such as the integration of electric and hybrid models, strengthens North America’s position. High government support for sustainable public transit initiatives, combined with consumer preference for reliable and efficient transport options, further consolidates the region’s growth.
U.S. Bus Market Insights
The U.S. held a significant market share in North America bus landscape in 2025 due to its vast reliance on buses for school transportation, urban commuting, and intercity travel. Strong government initiatives toward upgrading fleets with electric and hybrid models, coupled with the presence of leading manufacturers, further strengthen the market. Additionally, robust infrastructure and continuous investment in modernizing public transit systems have reinforced the country’s growth within the region.
Asia Pacific Bus Market Trends
The market in Asia Pacific accounted for a 48.58% share in 2025 owing to rapid urbanization, expanding population bases, and increasing dependence on public transport. Rising demand for cost-effective commuting solutions in densely populated cities is boosting the adoption of buses as a primary mode of daily transport. Furthermore, investments in smart city projects and regional infrastructure development are encouraging the integration of modern and sustainable bus fleets. The region also benefits from growing focus on reducing traffic congestion and pollution, which supports the shift toward efficient and eco-friendly mass transit systems. In May 2025, the Asian Development Bank announced a USD 800,000 technical assistance grant to support green transportation initiatives across the Asia Pacific. The project aims to advance sustainable mobility solutions in the region. These factors position Asia Pacific as a major growth hub for the global industry.
India Bus Market Overview
The market in India captured 21.69% share of the Asia Pacific landscape in 2025 due to its heavy dependence on buses as the primary mode of affordable mass transit. Rapid urbanization, combined with a large and growing population, has increased the demand for efficient public mobility solutions. Furthermore, the government's increasing focus on improving connectivity and expanding public transport infrastructure has accelerated the adoption of buses across both urban and rural areas.
Europe Bus Market Trends
The bus industry in Europe is projected to hold a substantial share in 2034 due to the region’s strong focus on sustainability and stringent environmental regulations. European cities are at the forefront of adopting electric and hybrid buses, aligning with their commitment to reducing emissions and promoting green urban mobility. According to a March 2025 European Federation for Transport and Environment AISBL report, 49% of new city buses registered in the EU in 2024 were zero-emission vehicles, marking significant progress in the transition to cleaner public transportation across European urban centers. Additionally, well-organized public transportation networks and consistent government funding for cleaner mobility options highlight steady growth. The cultural focus on shared and sustainable transport further enhances the demand for buses across various applications, such as transit, intercity travel, and tourism. Europe’s long-term focus on innovation and sustainability ensures its continued contribution to the global market.
UK Bus Market
The UK market is expected to witness a substantial CAGR of 3.2% during the forecast period, attributed to its strong focus on sustainable and environmentally friendly transport solutions. The country is increasingly adopting electric and hybrid buses as part of its de-carbonization efforts, supported by favorable government policies. In addition, investments in modern public transit networks and a cultural preference for organized and reliable mobility options further drive growth opportunities.
Source: Polaris Market Research Analysis
Curious About Regional Market Performance? Request Customization
Key Players & Competitive Analysis
The bus industry is witnessing a transformation, driven by emerging technologies and sustainable value chains, with electric and hydrogen-powered buses gaining traction globally. Competitive intelligence and strategy reveal that companies are focusing on strategic investments in zero-emission fleets to capitalize on revenue opportunities in both developed markets and high-growth regions. Industry trends indicate a shift toward smart mobility solutions, with disruptions and trends such as autonomous driving and connected fleets reshaping operations. Economic and geopolitical shifts are influencing expansion opportunities, particularly in regions prioritizing green transportation policies. Vendor strategies highlight partnerships with battery manufacturers and charging infrastructure providers to strengthen future development strategies. Growth projections suggest rising demand for efficient public transit, creating latent demand and opportunities for small and medium-sized businesses in niche segments. Expert insights highlight the need for region-wise market estimates to optimize market entry strategies, while technological advancements in energy storage and fleet management systems enhance revenue growth analysis. Industry-leading competitive intelligence will be crucial for stakeholders navigating this evolving landscape as macroeconomic trends drive urbanization.
A few major companies operating in the bus industry include AB Volvo; Anhui Ankai Automobile Co., Ltd; Beiqi Foton Motor Co., Ltd.; BYD Company Limited; Daimler Truck Holding AG; Ebusco; Golden Dragon (Xiamen Golden Dragon Bus Co., Ltd.); Higer Bus Company Limited; Iveco Group N.V.; MAN Truck & Bus; Renault Group; Scania AB; Shanghai Sunwin Bus Co., Ltd.; Solaris Bus & Coach sp. z o.o.; Sunlong Automobile; TEMSA; Xiamen King Long United Automotive Industry Co., Ltd.; Yutong Bus Co., Ltd.; and Zhongtong Bus Holding Co., Ltd.
Key Players
- AB Volvo
- Anhui Ankai Automobile Co., Ltd
- Beiqi Foton Motor Co., Ltd.
- BYD Company Limited
- Daimler Truck Holding AG
- Ebusco
- Golden Dragon (Xiamen Golden Dragon Bus Co., Ltd.)
- Higer Bus Company Limited
- Iveco Group N.V.
- MAN Truck & Bus
- Renault Group
- Scania AB
- Shanghai Sunwin Bus Co., Ltd.
- Solaris Bus & Coach sp. z o.o.
- Sunlong Automobile
- TEMSA
- Xiamen King Long United Automotive Industry Co., Ltd.
- Yutong Bus Co., Ltd.
- Zhongtong Bus Holding Co., Ltd.
Bus Industry Developments
-
March 2026: Toledo Public Schools (TPS) announced the addition of 12 new Type C electric school buses and chargers. The investment reflects the district's long-term commitment to advance transportation innovation. (Source: PRNewswire)
-
December 2025: In a historic agreement, MAN Truck & Bus secured its largest-ever order, committing to supply more than 3,000 buses to Deutsche Bahn in Germany between 2027 and 2032. A substantial share of the fleet will be fully electric, supporting regional transport services operated by DB Regio AG across the country. (Source: press.mantruckandbus.com)
-
December 2025: Deutsche Bahn entered a framework agreement with BYD for the procurement of 200 large battery-electric buses. The contract covers four adaptable models—B12.b, B12.b LE, B13.b, and B15—designed to meet both urban transit and intercity passenger transportation requirements. (Source: chinabuses.org)
Future of Bus Market
The future of the bus market is strongly driven by the rapid adoption of electric buses. Governments are taking various initiatives to reduce emissions and improve urban transportation. Smart fleet management systems that use IoT and AI for route optimization are improving efficiency. They are also lowering fuel costs and enhancing the passenger experience. Technologies for autonomous driving and connected transport infrastructure will transform public transit systems. Ongoing investments in sustainable mobility, charging infrastructure, and green public transport policies will accelerate growth in the global market.
Bus Market Segmentation
By Length Outlook (Volume, Units; Revenue, USD Billion, 2021–2034)
- Below 6m
- 6-8m
- 8-10m
- 10-12m
- Above 12m
By Fuel Type Outlook (Volume, Units; Revenue, USD Billion, 2021–2034)
- Diesel
- Electric
- Hybrid
- Alternative Fuel
By Seating Capacity Outlook (Volume, Units; Revenue, USD Billion, 2021–2034)
- Below 15
- 15 to 30
- 31 to 50
- Above 50
By Application Outlook (Volume, Units; Revenue, USD Billion, 2021–2034)
- Transit Bus
- Intercity/Motor coaches
- School Bus
- Tourist Bus
- Staff Pickup/Hotel Shuttle
- Others
By Regional Outlook (Volume, Units; Revenue, USD Billion, 2021–2034)
- North America
- U.S.
- Canada
- Europe
- Germany
- France
- UK
- Italy
- Spain
- Netherlands
- Russia
- Rest of Europe
- Asia Pacific
- China
- Japan
- India
- Malaysia
- South Korea
- Indonesia
- Australia
- Vietnam
- Rest of Asia Pacific
- Middle East & Africa
- Saudi Arabia
- UAE
- Israel
- South Africa
- Rest of Middle East & Africa
- Latin America
- Mexico
- Brazil
- Argentina
- Rest of Latin America
Bus Market Report Scope
| Report Attributes | Details |
| Market Size in 2025 | USD 96.92 Billion |
| Market Size in 2026 | USD 101.34 Billion |
| Revenue Forecast by 2034 | USD 134.22 Billion |
| CAGR | 3.7% from 2026 to 2034 |
| Base Year | 2025 |
| Historical Data | 2021–2024 |
| Forecast Period | 2026–2034 |
| Quantitative Units | Volume, Units; Revenue in USD Billion and CAGR from 2026 to 2034 |
| Report Coverage | Revenue Forecast, Competitive Landscape, Growth Factors, and Industry Trends |
| Segments Covered |
|
| Regional Scope |
|
| Competitive Landscape |
|
| Report Format |
|
| Customization | Report customization as per your requirements with respect to countries, regions, and segmentation. |
Source: Polaris Market Research Analysis
Bus Market FAQ's
The global market size was valued at USD 96.92 billion in 2025 and is projected to grow to USD 134.22 billion by 2034.
The global market is projected to register a CAGR of 3.7% during the forecast period.
The market in Asia Pacific accounted for a 48.58% share in 2025.
A few of the key players in the market are AB Volvo; Anhui Ankai Automobile Co., Ltd; Beiqi Foton Motor Co., Ltd.; BYD Company Limited; Daimler Truck Holding AG; Ebusco; Golden Dragon (Xiamen Golden Dragon Bus Co., Ltd.); Higer Bus Company Limited; Iveco Group N.V.; MAN Truck & Bus; Renault Group; Scania AB; Shanghai Sunwin Bus Co., Ltd.; Solaris Bus & Coach sp. z o.o.; Sunlong Automobile; TEMSA; Xiamen King Long United Automotive Industry Co., Ltd.; Yutong Bus Co., Ltd.; and Zhongtong Bus Holding Co., Ltd.
The below 6m segment accounted for 34.93% revenue share in 2025.
The electric segment is projected to witness the highest CAGR of 11.1% during the forecast period.
Download Sample Report of Bus Market
Please fill out the form to request a customized copy of the research report.
