
Construction Chemicals Market Drivers, Growth, Trends, 2026 - 2034
REPORT DETAILS
Market Statistics
Construction Chemicals Market Overview
The global construction chemicals market size was valued at USD 55.58 billion in 2025. According to our global construction chemicals market forecast, the industry is projected to account for a CAGR of 7.58% between 2026 and 2034. Key construction chemicals demand growth drivers include rising new building projects, innovations in product development, and the rapid urbanization observed in many developing regions.
Key Insights
- Asia Pacific accounted for the largest construction chemicals market share of 49.80% in 2025. This is due to significant investments in infrastructure development, combined with rising disposable income levels among consumers in the region.
- Europe is expected to witness the fastest growth, at a 8.2% CAGR. The expansion of the construction industry drives market growth in Europe.
- The concrete admixtures segment accounted for the largest market share of 37.5% in 2025. The role of concrete admixtures as the primary binding material contributes to their leading market position.
- The non-residential & infrastructure segment accounted for a 62.0% revenue share in 2025. Construction chemicals are important in protecting buildings against moisture, dust, and heat.
- The protective coatings segment is expected to grow at the fastest rate, with a CAGR of 7.64% during 2026 to 2034. This growth is supported by increasing need for durability and resistance in construction structures.
Market Statistics
- 2025 Market Size: USD 55.58 billion
- 2034 Projected Market Size: USD 107.25 billion
- CAGR (2026-2034): 7.58%
- Asia Pacific: Largest market in 2025
Industry Dynamics
- The rise in demand for construction products has led to increased cement use, which, in turn, has driven up usage of various building chemicals.
- The construction chemicals market is also driven by the introduction of advanced product offerings designed to enhance performance.
- Strict regulations and fluctuating raw material prices challenge profit margins.
- Green construction drives demand for high-performance, eco-friendly products.
Source: Polaris Market Research Analysis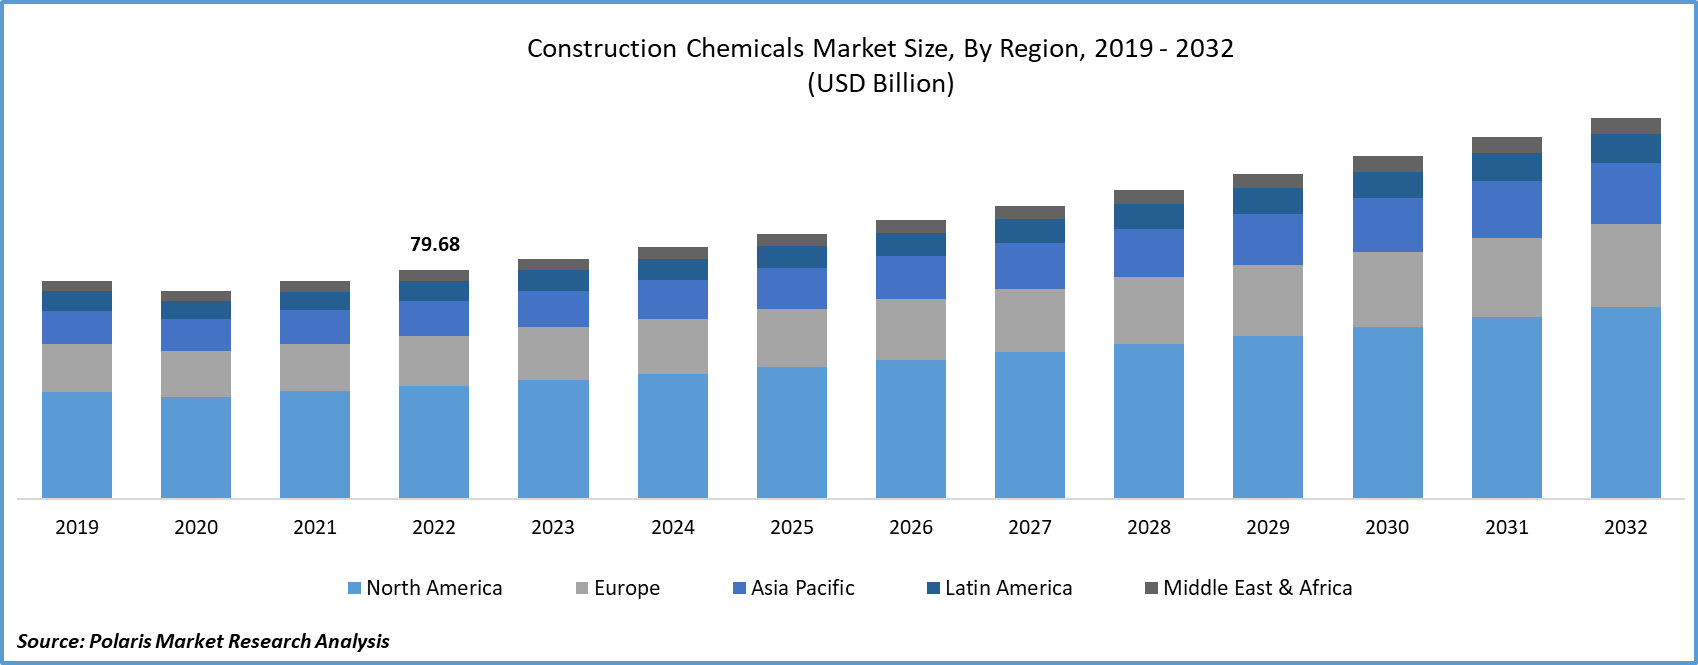
To Understand More About this Research:Download Sample Report
AI Impact on Construction Chemicals Market
- AI helps companies create better construction chemical formulas faster, improving product quality and performance.
- It supports quality checks during production, helping reduce defects and maintain consistent standards.
- AI in chemicals helps predict demand and manage supply chains, ensuring materials are available when needed.
- It also helps monitor how materials perform in real projects, allowing companies to improve durability and reduce maintenance needs.
What are Construction Chemicals?
Construction chemicals are chemical formulations used along with cement and concrete to improve strength, durability, and overall performance of structures. These include admixtures, adhesives, sealants, and coatings that support enhance workability, resistance to environmental conditions, and lifespan of buildings and infrastructure.
Construction chemicals have always played a crucial role in virtually all construction endeavors, whether industrial, residential, or commercial. These chemicals are frequently used in various sections of projects to achieve key qualities such as functionality and longevity. Construction chemicals are available in several configurations from numerous manufacturers worldwide. They are chemical formulations used with masonry materials, cement, concrete, and other construction materials at the time of construction to hold the materials together.
Some advantages of construction chemicals include enhanced functionality. They can be used to reduce mixing time and provide a simple-to-mix function for elevated operational concrete. Chemical admixtures are predominantly used to enhance concrete performance. The construction chemicals market is seeing soaring sales as they also help accelerate the momentum of construction work. Another advantage is that they increase productivity and effectiveness by reducing water intake, tumble loss, and depletion, and by regulating alkali-aggregate reaction.
The construction chemicals market is expected to grow significantly. The market is fueled by rising construction, building, and infrastructure development activity. The trend is further fueled by rapid urbanization across the globe, especially in developing countries. Given that the market is affected by various regulatory factors, key market players are focusing on research and development initiatives to create innovative bio-based products.
Construction chemicals used in building projects may emit toxic volatile organic compounds (VOCs). These toxic VOCs have been linked to health effects such as asthma, skin irritations, migraines, disorientation, and eye irritations. Government regulations on controlling the use of construction chemicals owing to VOC emissions have impacted the growth potential of the construction chemicals market to some extent. These regulations are necessary to control the health and environmental risks related to VOC emissions. These regulations reflect a balance between construction industry requirements and health considerations.
Major players in the construction industry are focusing on improving safety for underground structures, along with integrating green, eco-friendly materials. This includes polycarboxylate ether-based green additives, as well as other methods for building protection. Furthermore, cool roof technologies are being utilized to promote construction chemicals sustainability. The use of these green technologies highlights the construction industry's commitment to addressing construction chemicals regulatory challenges.
Market Dynamics
Rising New Building Projects
The construction products industry in emerging nations is set to thrive due to growth in new building projects and in the maintenance and rehabilitation sectors. Economies like India, China, and South Korea are experiencing substantial population growth. This has created a significant need for both residential and non-residential structures. This robust demand has led to increased cement usage. It is driving the usage of various building chemicals, such as cement additives, admixtures, sealants, and adhesives.
Technology Advancements in Construction Chemicals
The global market for construction chemicals is expected to grow due to the development of new and advanced products. Examples include specialty additives such as silicone caulks and mortars. These additives help enhance the structure and durability of buildings. They also provide corrosion resistance.
The market is also witnessing innovations in construction chemicals. The market is also witnessing new innovations in construction chemicals. Smart chemicals are becoming popular as they can sense changes in temperature and moisture levels. Moreover, self-healing concrete and IoT-enabled chemicals are being increasingly used. Smart chemicals play a vital role in reducing maintenance requirements and extending the lifespan of structures in construction.
Types of Construction Chemicals
| Type | Use | Key Benefit | Common Materials |
| Admixtures | Added during concrete mixing | Improves strength and workability | SNF, ligno-based, polymers |
| Waterproofing | Prevents water entry | Protects from leakage and dampness | Bitumen, acrylic, PU |
| Coatings | Applied on surface | Protects from chemicals and corrosion | Epoxy, polyurethane |
| Sealants | Fills joints and gaps | Prevents air, water, dust entry | Silicone, polysulfide
|
Source: Polaris Market Research Analysis
Source: Polaris Market Research Analysis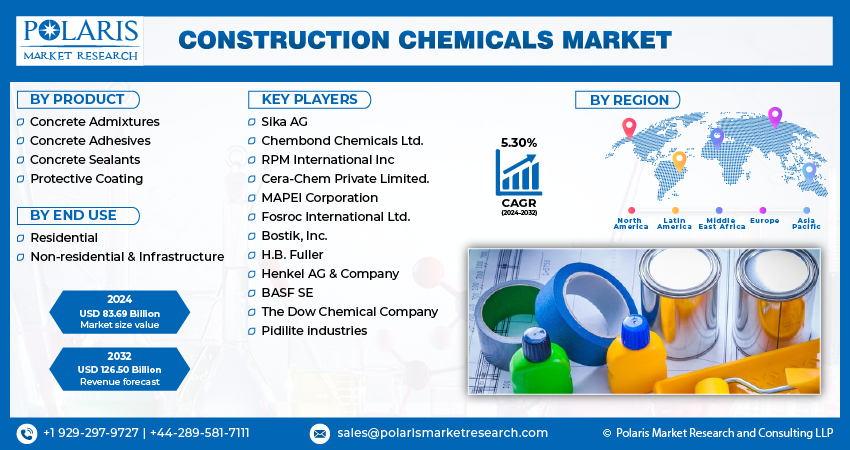
Get Full Segment-Level Forecasts & Insights: Download Sample Report
Segment Insights
Product Analysis
Based on product, the construction chemicals market is segmented into concrete admixtures, concrete adhesives, concrete sealants, and protective coating. The concrete admixtures segment accounted for the largest market share of 37.5% in 2025. Cement is the main bonding agent in concrete. Concrete is prepared by mixing cement with crushed rocks (aggregate), sand, and water. For a smooth finish and high strength, ad-mixtures are added to the concrete while mixing. These admixtures have different uses. They can be used to reduce the water content in concrete and increase its durability. There are different admixtures used in the construction industry. These ad-mixtures include ligno-based admixtures, sulfonated naphthalene formaldehyde (SNF), and sulfonated melamine formaldehyde. Among the admixtures, ligno-based admixtures were the first to be used in concrete.
In line with evolving concrete admixtures market trends, there is a growing shift towards advanced products, such as polymer-based construction chemicals. These provide superior bonding, flexural, and environmental stress resistance. At the same time, green additives in construction chemicals are becoming popular as the industry moves towards sustainable construction.
The construction adhesives segment is expected to grow at a steady rate. These adhesives are manufactured using high-quality materials like cement, epoxy, and polymers. It increases the lifespan of adhesives as well as their adhesive capacity. Cement-based adhesives are commonly used for fixing tiles on the floors and walls. These adhesives are usually made up of water-resistant cement or polymer-modified cement. This allows their use in both internal and external applications. On the other hand, epoxy-based adhesives are characterized by cold-curing properties. These adhesives can withstand a wide range of chemicals, including water, oil, alkali, and various solvents.
Protective coatings have shown significant importance in both construction projects and repair works. They provide protection against various chemicals like oil, acids, solvents, and different fuels. Among the various chemicals used in protective coatings, some significant ones include epoxy, urethane, polyester, & polyurea. The segment is also witnessing the development and implementation of advanced protection products like anti-corrosive coating. This is useful to enhance the lifespan of structures exposed to harsh environmental conditions.
End Use Analysis
Based on end use, the market is segmented into residential and non-residential & infrastructure. The non-residential & infrastructure segment held the majority market share of 62.0% in 2025. In these sectors, construction chemicals are generally employed to provide sealing, especially to joints and cracks. Besides, sealants play a critical role in protecting against moisture, dust, and heat, making them adaptable for use in various commercial and residential properties. In addition, the development of modern office spaces, urbanization, and lifestyles have been pivotal factors in the growth of this segment.
This segment is increasingly driven by the growth of smart city projects, which use advanced construction chemicals to support infrastructure development. These chemicals help facilitate the development of eco-friendly buildings by using energy-efficient materials, self-cleaning technologies, and durability-enhancing additives.
At the same time, an increase in large infrastructure projects, such as airports, stadiums, skyscrapers, and commercial centers, is driving demand for high-performance products. These products must be robust and dependable to withstand high usage and harsh environmental factors.
The increased emphasis on sustainability is also positively influencing the use of green building products and eco-friendly building chemicals. LEED and BREEAM have been encouraging the use of low-carbon products, which are energy-efficient and suitable for non-residential buildings.
The housing market in emerging countries like China, India, South Africa, and Turkey is expected to have a promising future. The positive outlook is likely to be one of the key contributors to the market in the coming years. The growing demand for single-family housing schemes aligns with consumers' rising financial capabilities in these emerging countries.
Real-World Applications of Construction Chemicals
- Bridges – Protective coatings are used to resist corrosion from water, chemicals, and environmental exposure. They support extend structure life in harsh conditions.
- Roads – Admixtures are added in concrete to improve strength and reduce water content. This helps in better durability and long-term performance.
- Tunnels – Sealants are used in joints and cracks to control water leakage. They act as shield against moisture and chemicals.
- Residential buildings – Adhesives are used for fixing tiles on floors and walls. They provide strong bonding.
- Commercial infrastructure – Sealants and coatings are used to prevent from dust, heat, and moisture. These materials support durability in high-usage environments.
- Airports and stadiums – High-performance chemicals are used to handle heavy load and environmental stress. They ensure reliability and structural stability.
- Skyscrapers – Advanced coatings and additives are used to improve resistance and lifespan. They support structures withstand harsh weather and pollution.
Source: Polaris Market Research Analysis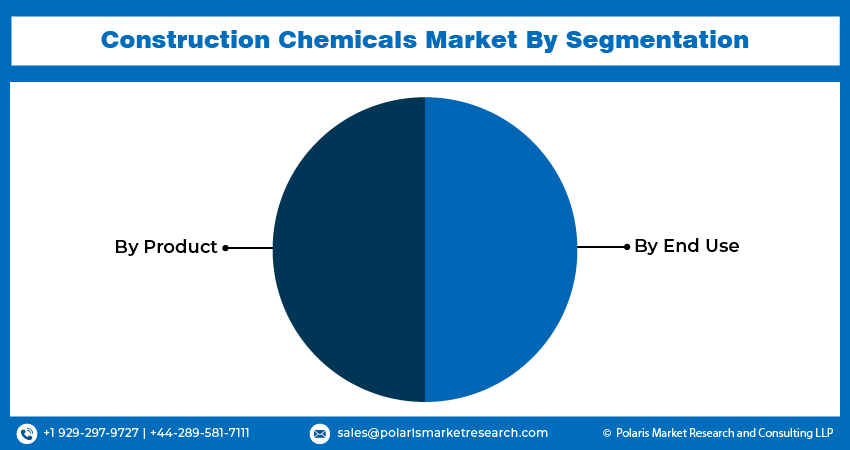
Need Granular Data Across All Market Segments? Request Customization
Regional Insights
Asia Pacific led the market with a 49.80% revenue share in 2025. This dominance can be attributed to substantial infrastructure investments and rising disposable incomes in the region. Indonesia, the Philippines, & Malaysia are in the midst of rapid economic development. This economic development is expected to have a positive impact on the construction industry. For instance, these countries are witnessing a surge in infrastructure project demand, thereby driving the need for construction chemicals in APAC.
In India, there is a high rate of population growth. This is resulting in rapid urbanization. According to UNDP estimates, 50% of the population will be living in urban areas by 2046. This will mean a greater demand for housing units, offices, and other properties. The country will also have many cities with a population of over 10 million. This is expected to further contribute to construction activity.
Urbanization in APAC countries, particularly in the India construction chemicals market, is also driven by the development of tier 2 and tier 3 cities. This is due to improved infrastructure and connectivity, as well as increased investments in these areas. This has led to increased development in residential, commercial, and smart infrastructure projects. It is driving demand for construction chemicals. Steady economic growth is encouraging the use of more robust and advanced construction materials.
Europe is expected to witness steady growth, at a 8.2% CAGR. The expansion of the construction industry primarily influences the market. In Western European nations such as the U.K., Germany, the Netherlands, and France, there is an expectation of moderate growth throughout the forecast period. Economic and political policies in these countries are also expected to exert substantial influence on market development.
Source: Polaris Market Research Analysis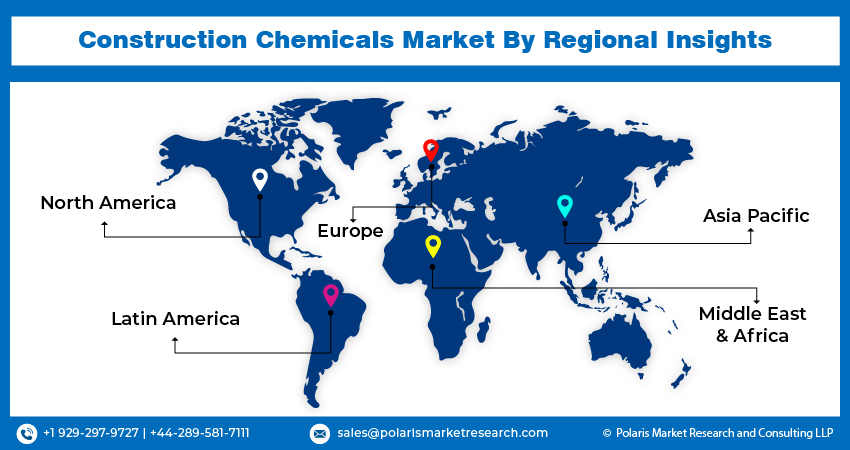
Curious About Regional Market Performance? Request Customization
Key Industry Players and Competitive Analysis
The construction chemicals market is highly competitive, with a handful of major players controlling a large share of the market. To adhere to strict environmental policies, the industry's major players are focusing on researching and developing alternative products, especially bio-based construction chemicals.
The market for construction chemicals is becoming increasingly competitive with the entry of emerging players in construction chemicals, especially in developing countries. These new entrants are focusing on cost-effective products to gain market share in the competitive market.
Regional players in construction chemicals are also strengthening their presence in the construction chemicals market, particularly in the Asia Pacific and Latin America. Regional players are benefiting from their local presence and market understanding, thereby gaining market share for their products.
At the same time, top construction chemical manufacturers are focusing on partnerships, mergers, and acquisitions to expand their market presence. They are investing more in research and development to develop sustainable products for the construction industry.
BASF SE is a major company in the construction chemicals business. It offers a range of products, including concrete admixtures, waterproofing agents, and protective coatings. It aims to offer sustainable, high-quality products to meet the changing requirements of the construction industry. It is also focused on R&D to improve the quality of its products and promote eco-friendly construction.
Sika AG is a major player in the construction chemicals industry with a strong global presence. It offers various products, including sealants, adhesives, concrete admixtures, and waterproofers. It aims to be innovative in its business and introduce new products to improve construction quality. It also aims to expand its market presence through collaboration and acquisitions.
Some of the top companies operating in the global market are:
- BASF SE
- Bostik, Inc.
- Cera-Chem Private Limited.
- Chembond Chemicals Ltd.
- Fosroc International Ltd.
- H.B. Fuller
- Henkel AG & Company
- MAPEI Corporation
- Pidilite industries
- RPM International Inc
- Sika AG
- The Dow Chemical Company
Industry Developments
- March 2025: BASF and Sika introduced Baxxodur EC 151 for epoxy flooring. It is a high-performance hardener. It helps reduce VOC levels significantly and supports curing at lower temperatures. (Source: sika.com)
- January 2025: Master Builders Solutions announced its strategic expansion in the Indian market. The company revealed that the expansion strategy is geared towards meeting the rising demand for high-performance and sustainable products in the country. (Source: masterbuilderssolution.com)
- April 2024: Mapei introduced the Mapeflex MS 55 hybrid adhesive and sealant with high modulus of elasticity. The company stated that the product is an ideal solution for daily use in both professional and domestic environments. (Source: mapei.com)
Market Segmentation
By Product Outlook (Revenue, USD Billion, 2021–2034)
- Concrete Admixtures
- Concrete Adhesives
- Concrete Sealants
- Protective Coating
By End Use Outlook (Revenue, USD Billion, 2021–2034)
- Residential
- Non-residential & Infrastructure
By Regional Outlook (Revenue, USD Billion, 2021–2034)
- North America
- US
- Canada
- Europe
- Germany
- France
- UK
- Italy
- Spain
- Netherlands
- Russia
- Rest of Europe
- Asia Pacific
- China
- Japan
- India
- Malaysia
- South Korea
- Indonesia
- Australia
- Vietnam
- Rest of Asia Pacific
- Middle East & Africa
- Saudi Arabia
- UAE
- Israel
- South Africa
- Rest of Middle East & Africa
- Latin America
- Mexico
- Brazil
- Argentina
- Rest of Latin America
Construction Chemicals Market Report Scope
| Report Attributes | Details |
| Market Size in 2025 | USD 55.58 billion |
| Market Size in 2026 | USD 59.72 billion |
| Revenue Forecast by 2034 | USD 107.25 billion |
| CAGR | 7.58% |
| Base Year | 2025 |
| Historical Data | 2021–2024 |
| Forecast Period | 2026–2034 |
| Quantitative Units | Revenue in USD billion, and CAGR from 2026 to 2034 |
| Report Coverage | Revenue Forecast, Market Competitive Landscape, Growth Factors, and Trends |
| Segments Covered |
|
| Regional Scope |
|
| Competitive Landscape | Construction Chemicals Industry Trend Analysis (2025) Company profiles/industry participants profiling include company overview, financial information, product/service benchmarking, and recent developments |
| Report Format | PDF + Excel |
| Customization | Report customization as per your requirements with respect to countries, regions, and segmentation. |
Source: Polaris Market Research Analysis
Construction Chemicals Market FAQ's
The market for construction chemicals was valued at USD 55.58 billion in 2025. It is projected to reach USD 107.25 billion by 2034.
The global market is projected to register a CAGR of 7.58% during the forecast period.
The market is primarily driven by the rapid growth in new building projects and increasing demand for sustainable solutions.
The concrete admixtures segment held the largest market share in 2025. This is owing to their essential role in improving concrete durability and workability.
Asia Pacific accounted for the largest construction chemicals market share in 2025. This is due to significant investments in infrastructure development and urbanization in emerging markets.
Key challenges include regulatory pressures and volatile raw material prices.
They improve strength and lifespan of structures. They help resist moisture, chemicals, and environmental damage.
Cost depends on raw materials, product type, and project size. Advanced and high-performance products usually cost high.
Download Sample Report of Construction Chemicals Market
Please fill out the form to request a customized copy of the research report.
