
Crop Protection Chemicals Market Size, Share & Global Forecast, 2026-2034
REPORT DETAILS
Market Statistics
Market Overview
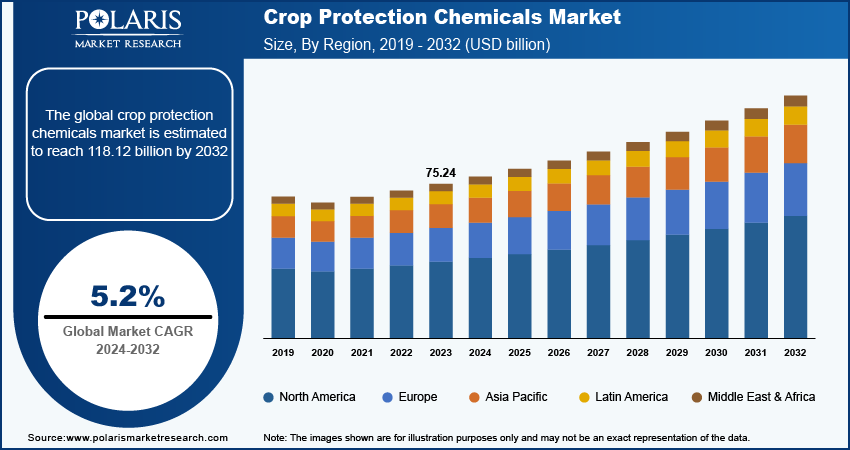
The global crop protection chemicals market size was valued at USD 82.51 billion in 2025. The market is projected to account for a 5.4% CAGR between 2026 and 2034. Rising food demand and the adoption of advanced agriculture practices are a few of the key factors driving market growth.
Key Takeaways
- Asia Pacific is projected to account for the largest revenue share of over 33% from 2026 to 2034. The large agricultural base in this region and the need to enhance crop production to support the growing population contribute to the region’s leading market share.
- North America is projected to register a 4.91% CAGR during the projection period. Market growth drivers include large-scale GM crop production and the adoption of precision agriculture pesticides.
- The cereals & grains segment dominated the crop protection chemicals market with a 43% revenue share in 2025. Staple crops such as wheat, rice, corn, and barley create significant demand for crop protection products.
- The herbicides segment accounted for the largest market share of 41% in 2025. Herbicides are crucial for the control of weeds, which would otherwise compete with agricultural produce for vital factors.
- The insecticides segment is forecasted to register the highest CAGR of 5.1%. The segment’s rapid growth is driven by increasing pressure from pests.
Note: Figures and projections outlined in this report are the result of Polaris Market Research’s proprietary analytical processes, grounded in the latest available datasets and market observations.
Market Statistics
- 2025 Market Size: USD 82.51 billion
- 2034 Projected Market Size: USD 132.22 billion
- CAGR (2026–2034): 5.4%
- Asia Pacific: Largest Market
Industry Dynamics
- The growing global population has created increased demand for food. This is driving the need for crop protection chemicals to ensure global food security.
- The development in agricultural methods like GMOs and precision farming is resulting in crop protection chemicals market growth.
- The increasing use of biopesticides and biotechnology will create numerous market opportunities.
- The stringent regulations and environmental issues might act as market barriers.
Source: Polaris Market Research Analysis
To Understand More About this Research:Download Sample Report
AI Impact on Crop Protection Chemicals Market
- AI is used in agriculture for early detection of crop diseases and insect attacks so that protection products can be utilized effectively.
- It provides intelligent spraying, determining the exact areas where chemicals have to be sprayed to save expenses.
- AI technology helps businesses accelerate the development process of new and improved crop protection products.
- Insights gained from AI help farmers decide which protection products to use according to the climate, soil type, and crops.
The crop protection chemicals market is witnessing rapid growth due to climate change. The changing climate is increasing the threat posed by pests and diseases. As reported by the Center for Agriculture and Bioscience International (CABI), 40 percent of global production is destroyed annually by pests, weeds, and pathogens, with the damaging Fall Armyworm (FAW) being among the biggest threats. This problem is further worsened by climate change and poses risks to important crops such as maize, bananas, wheat, and coffee, which, in turn, affect families’ incomes, global food security, and the economies of nations. This highlights the necessity of developing effective crop protection solutions to address these concerns and maintain agricultural output.
There is an increasing demand for crop protection chemicals because growers are looking for ways to protect their crops from pest infestation, leading to high and consistent yields. This is due to the need for more sophisticated and advanced chemicals that can help manage the challenges of pest management while adhering to sustainable agriculture practices. Consequently, the growing need for crop protection has been instrumental in propelling growth in the global agrochemicals market.
The growth of agricultural activity in previously uncultivated areas, including marginal lands, has led to an increased need for crop protection chemicals. With the spread of agriculture in new regions that may be difficult to farm due to low-quality soil or unfriendly climatic conditions, the risk of pest infestations and disease outbreaks rises. This increasing threat of pests and diseases creates a need for pesticides and herbicides globally.
2025 U.S. Tariff Impact on the Crop Protection Chemicals Market
Among the critical factors that are expected to influence the market for crop protection chemicals in 2025-2026 is the imposition of U.S. tariffs against imported active ingredients, particularly those imported from China. China is one of the largest providers of technical-grade active ingredients in the world, including glyphosate, atrazine, 2,4-D ester, and glufosinate. These are widely used in pesticide formulations across North America and Europe.
Tariff exposure on key imported active ingredients has increased agrochemical import costs and active ingredient supply chain risk. Aggregate farm input costs are expected to rise by about 4%–6% by 2026. In response, distributors and producers have revised their sourcing policy and adopted dual sourcing. They are also considering domestic manufacturing within the U.S.
These developments have strengthened two broader trends in the industry. Firstly, the demand for affordable generic formulations is increasing. Secondly, there is an increasing focus on cost-effective generic formulations that produce more yield per acre. Polaris Market Research projects that prices may affect profitability in the near term. But they will drive investments in bio-based crop protection and advanced formulation technologies in the long run.
Market Drivers and Trends
Increasing Population and Rising Food Demand
The crop protection chemicals market CAGR is being driven by the growing population of the world. The United Nations Department of Economic and Social Affairs predicts that there will be 8.6 billion people in the world by 2030, 9.8 billion people by 2050, and 11.2 billion people by 2100. The ongoing population growth is increasing the need for higher levels of agricultural productivity. With increasing nutritional needs, there is a necessity for farmers to focus on ensuring that they get the highest crop yields possible from their crops. Crop protection chemicals help minimize the negative impacts that pests, diseases, and weeds may have on crops. Through the effective management of these issues, farmers can protect their harvests, thereby contributing to global food security. Moreover, there is an increasing demand for foods that are nutritious and eco-friendly owing to growing health awareness and rapid urbanization.
Adoption of Technologically Advanced Agriculture Practices
Advances in agricultural techniques, including genetically modified organisms (GMOs) and precision agriculture, have transformed modern agriculture. Genetically modified crops are engineered to be resistant to pests, pathogens, and specific herbicides. This increases crop resilience and yield potential. Such crops necessitate the use of specific crop protection chemicals, which are effective without harming other plants or organisms.
Precision agriculture uses technology such as GPS, sensors, and analytics to control variables including water, fertilizer, and pesticides. Targeted applications ensure that pesticides are applied by the farmer only when necessary. This ensures efficiency in usage, reduces wastage, and helps conserve the environment. The targeted application strategy has increased the need for crop protection products with precision application capabilities.
Digital Farming, Drone Spraying, and AI-Driven Pest Detection
Technologies such as digital agriculture, AI-powered pest monitoring, and drone-based pesticide application have become common in crop chemical application. Tools such as GPS-controlled spray equipment, variable-rate application systems, and IoT-enabled pest monitoring enable farmers to spray crops more accurately and increase chemical application efficiency. This can reduce chemical use per acre by 15–20% and improve pest control.
Leading crop protection chemicals players such as Bayer, Syngenta, and Corteva have also begun integrating their product lines with digital farming platforms. In this regard, crop protection chemicals can be viewed as an integral component of an entire agricultural system. Bayer, for instance, collaborated with a technology company in August 2025 to provide AI-enabled crop management solutions. Furthermore, Xarvio Digital Farming Solutions ecosystem has been incorporated into precision crop protection spray equipment made by Stara in Latin America. The above trends indicate that weed control and herbicide use are increasingly intertwined with digital technologies, combining chemistry and technology in modern agriculture. The above trends indicate that weed control and herbicide use are increasingly intertwined with digital technologies, combining chemistry and technology in modern agriculture.
Variable rate applications (VRAs) systems and spot spray drones play a particularly vital role in the Asia Pacific, where there are labor shortages and farm sizes are relatively small. The deployment of these technologies enables farmers to apply chemicals to their crops with greater precision. The use of VRAs also expands the demand for technologically advanced chemicals like targeted insecticides and nano-formulations. Although technologically advanced chemicals may be more expensive than conventional pesticides, they are ultimately more cost-effective per hectare in the long run.
Rapid Expansion of Biopesticides and Sustainable Crop Protection
The biopesticides market is the most rapidly growing category within the crop protection chemicals market. The biopesticides market CAGR is forecast to expand at an impressive 15.37% over the coming years, well above the overall market. Several key factors are responsible for this growth. The increased stringency of laws regarding artificial chemicals in European and North American countries is promoting the use of safer substitutes. Meanwhile, consumers require foods that have less exposure to chemicals. Moreover, major agrochemical firms are increasing the development of their biological offerings. Microbial biopesticides work well with the integrated pest management (IPM) approach. This makes them easier to adopt in modern farming. Together, these trends support strong growth in the biopesticides market.
Biopesticides comprise microbial agents, botanical products, and semiochemicals. Biopesticide specificity ensures that pest control is achieved without impacting other living things while minimizing pesticide residue levels in agricultural products. As such, biopesticides tend to be compatible with global residue standards, including the standards set by Codex Alimentarius. This is important for farmers producing crops mainly for exportation in regions like Latin America, South East Asia, and Sub-Saharan Africa.
Bayer signed an exclusive agreement with AlphaBio Control in April 2024 to develop its first bioinsecticide for arable crops by 2028, thereby highlighting the Big Four’s strategic intent toward biological chemistry. Thus, the rapid expansion of biopesticides and sustainable crop protection chemicals is driving market growth.
Market Restraints and Challenges
Stringent Regulatory Frameworks
The tightening of regulations across the globe presents several problems for the crop protection chemicals market. The active ingredients are being scrutinized on multiple levels for their toxicity, effects on the environment, and residues. The process of obtaining approval is expensive and time-consuming, taking as long as 7-10 years, as well as costing a significant investment. The need for regular re-registration poses additional expenses and may lead to delays in product release. For example, in Europe, the Farm to Fork Strategy policy aims to cut down the use of chemical pesticides by 50% by 2030. This creates added pressure on synthetic chemical products and encourages a shift towards alternative solutions.
Environmental and Health Concerns
Growing concerns among the general public and regulatory authorities about the environmental consequences of synthetic pesticides are emerging as a major limiting factor for the industry. Factors such as pollution of water resources, pollinator deaths, and impacts on non-target species have brought much greater focus on traditional products. There is also a growing trend towards the consumption of organically grown food items in the developed world. This inclination is forcing agrochemical firms to modify their product lines and diversify into more sustainable options.
Pest Resistance: Challenge and Commercial Opportunity
Active pesticide resistance is known to be among the greatest challenges that the pesticide industry has been facing. Pests such as Palmer amaranth, waterhemp, and Conyza, as well as the diamondback moth and whitefly insects, and fungi such as Fusarium and Botrytis are becoming increasingly difficult to control. The reason behind this issue is the repetitive application of the same chemical compounds, which results in the adaptation of pests to them. Therefore, pesticides lose their efficacy faster. To manage this problem, farmers use multiple products and strategies together. While it helps keep pesticides effective, it also complicates crop protection significantly.
From a market perspective, resistance contributes to increased demand. Due to the increase in resistance, farmers are increasingly choosing more advanced products that feature several modes of action and rotating different types of chemistry. Such innovative products include HPPD inhibitors, PPO inhibitors, and SDHI fungicides, which are often more expensive than generic products. Industry frameworks such as the Insecticide Resistance Action Committee (IRAC) and the Herbicide Resistance Action Committee (HRAC) have become increasingly important in guiding farmers on how to use specific products. The classifications help create resistance management strategies. It makes certain products more preferred by agronomists and distributors who advise farmers.
Source: Polaris Market Research Analysis
Get Full Segment-Level Forecasts & Insights: Download Sample Report
Segment Insights
By Crop Type
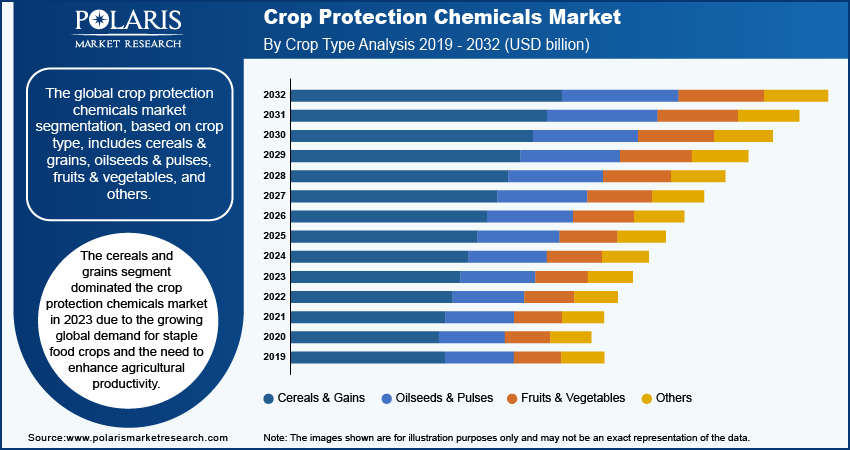
The global crop protection chemicals market segmentation, based on crop type, includes cereals & grains, oilseeds & pulses, fruits & vegetables, and others. The cereals & grains segment led the crop protection chemicals market with a 43% revenue share in 2025. Staple crops such as wheat, rice, corn, and barley create significant demand for crop protection products. They have been highly susceptible to pests, diseases, and weed infestations, hence making it necessary to employ herbicides, insecticides, and fungicides. As per the final estimate figures made available by the Ministry of Agriculture & Farmers’ Welfare, India’s wheat and rice production recorded its highest-ever output during the crop year 2023-24 (July-June). Wheat production reached an all-time high of 113.29 million metric tons (LMT).
The oilseeds & pulses segment is projected to register a 4.35% CAGR during the forecast period. The segment is growing due to increased global consumption of edible oils and proteins derived from plants. The Brazilian soybean farming industry is technologically very advanced, where almost all areas are occupied by genetically modified soybeans. Consequently, soybean herbicide market products like glyphosate, dicamba, and other innovative formulations are highly relied upon in this production process, contributing to higher sales within this segment. Moreover, an increase in the production of renewable diesel in the Americas is creating demand for soybean oil as the main raw material. This is further contributing to the need for herbicide-intensive oilseed protection programs.
The fruits & vegetables segment is expected to witness the fastest growth, fueled by increasing consumption by middle-class consumers in Asia as well as expanding export of horticultural crops from Latin America and Sub-Saharan Africa. High-value crops that belong to this segment have to be produced to stringent residue levels and quality specifications required by importing countries, including the EU, Japan, and the U.S. Due to this reason, producers are increasingly using innovations such as selective fungicides, insecticides with reduced pre-harvest intervals, and biopesticides. These help manage pest pressure and ensure compliance with export regulations.
By Type Insights
The global crop protection chemicals market segmentation by type includes herbicides, insecticides, fungicides & bactericides, and other. The herbicides segment accounted for the largest market share of 41% in 2025. Herbicides are crucial for the control of weeds, which would otherwise compete with agricultural produce for vital factors such as water, nutrients, and light. Glyphosate is the most widely used herbicide worldwide, especially in the U.S., Brazil, and Argentina.
The fungicides & bactericides segment is experiencing significant growth due to the expansion of climatic variations that have increased the incidence of fungal infections. Plants are becoming more vulnerable to disease infestations like wheat rust, rice blast, soybean rust, and Botrytis, necessitating better crop protection. New-generation chemical compositions like SDHI and DMI fungicides are witnessing wide acceptance. Innovators such as Syngenta are developing advanced fungicides like ADEPIDYN and TYMIRIUM, which are applied in staple crops as well as high-value crops. These advanced fungicides not only contribute to crop protection but also enable greater uptake of higher-value products.
The insecticides segment is forecasted to register the highest CAGR. The insecticides CAGR 2034 is projected to be 5.1%. It is driven by increasing pressure from pests. The changing climatic conditions are contributing to the spread of invader species, coupled with an increase in farming intensification and tropical agriculture that is boosting the demand for insecticides, notably in the APAC and Africa regions. Neonicotinoids still command a sizable market share when it comes to applications. However, the tightening of regulations in Europe is prompting the market to explore other alternatives, including new chemistry such as diamide insecticides, for instance, chlorantraniliprole and cyantraniliprole, in addition to biological insecticides. This shift is helping diversify the market while supporting continued growth in insect control solutions.
Source: Polaris Market Research Analysis
Need Granular Data Across All Market Segments? Request Customization
Regional Insights
Asia Pacific — Dominant Market by Revenue Share
The Asia Pacific crop protection chemicals market is projected to account for the largest revenue share of over 33% from 2026 to 2034. The large agricultural base in this region and the need to enhance crop production to support the growing population are the primary drivers of the demand. The Asia Pacific region is home to more than 60% of the world’s population, and agricultural production in China and India dominates. The region's varying climatic conditions make it more susceptible to pests and diseases. Hence, there is a higher demand for crop protection chemicals.
The China agricultural chemicals industry is characterized by its dual nature in the international market for crop protection products. China is the world’s biggest consumer of crop protection products, and at the same time, it is the biggest producer of technical active ingredients. China accounts for an estimated 70% of global glyphosate production capacity and is an important source for atrazine, mancozeb, and some organophosphate products. Furthermore, the implementation of domestic policies such as zero growth of pesticide consumption, tough environmental laws for manufacturing industries, and geopolitical trade conflicts influences the global agrochemical supply chain. Companies across the world are being forced to reconsider their procurement practices and engage in production diversification.
India represents one of the highest-potential growth markets in the Asia Pacific. The reasons behind this include government efforts to bring about changes in agriculture through modernization programs, development of GM crop registrations, and growth in the agrochemical formulation sector. Regulators such as the Central Insecticides Board & Registration Committee (CIB&RC) are assisting in bringing in new active ingredients. Meanwhile, innovations such as drip irrigation and precision spraying techniques in regions like Maharashtra, Punjab, and Andhra Pradesh are driving the need for specialty crop protection formulations.
Vietnam and Indonesia have emerged as fast-growing markets. This is because of the rise in production of rice, coffee, and oil palms. This led to high demand for rice fungicides, coffee berries borers pesticides, and oil palm herbicides.
Latin America — Largest Market by Value Share
The Latin America crop protection chemicals market accounted for approximately 28% revenue share because of the extensive agriculture practiced in this region. Latin American nations such as Brazil and Argentina are significant producers of crops. These include soybeans, sugarcane, corn, and coffee. The humid and subtropical nature of the climate in the region also raises the possibility of pest infestation and disease infection. Soybean rust and fall armyworms, among others, need to be addressed through consistent, effective fall armyworm chemical management.
Brazil is notable as the largest country-specific market for crop protection chemicals. The rise in soybean cultivation to cater to the needs of renewable diesel has resulted in higher usage of soybean crop protection herbicides per hectare. Moreover, the backing of the Ministry of Agriculture, Livestock, and Food Supply (MAPA) has resulted in more pesticides being available on the market. It ensures better availability of branded and generic chemicals.
North America
The North America crop protection chemicals market is projected to account for a 4.91% CAGR from 2026 to 2034. Market growth drivers include large-scale GM crop production, increased precision agriculture pesticide adoption, and better resistance management strategies. The U.S. market is shaped by the rise in soybean acreage driven by renewable diesel requirements and favorable regulatory treatment of low-risk chemicals by authorities such as the Environmental Protection Agency (EPA). A further trend in the regional market is the combination of different herbicide types for weed resistance management, which cannot be handled solely with glyphosate resistance weed management.
In addition, new policies in the area of trade have led to a change in the way sourcing and pricing are managed. Distributors are countering the challenge by adding biopesticides and more cost-effective formulations to their range. This is helping farmers manage costs while maintaining crop protection performance.
Europe
The Europe crop protection chemicals market held over 17% market share in 2025. The European market for crop protection products is one of the most highly regulated around the globe. The Farm to Fork Strategy, among others, is designed to cut the use and of chemical pesticides by 50% until 2030. The implementation of EU Farm to Fork agrochemicals and other policies is fostering an ongoing trend toward integrated pest management (IPM), biological solutions, and safer chemical alternatives. Nevertheless, the need for high-value products continues to persist in the market. These include fungicides for vineyards, insecticides for specific crops, and herbicides for cereals. Nations such as Germany, France, and Spain contribute significantly to the European pesticide market revenue.
Source: Polaris Market Research Analysis
Curious About Regional Market Performance? Request Customization
Supply Chain & Raw Material Risk Analysis
There is significant geographic concentration risk within the crop protection chemical value chain. This is particularly in regard to the manufacturing of active ingredients. China manufactures a substantial portion of the global demand for technical-grade inputs like glyphosate, atrazine, and chlorpyrifos. Along with the high active ingredient manufacturing China, the country also supplies intermediates that go into fungicides and insecticides globally.
The high level of dependence poses many structural risks. These crop protection chemicals supply chain risks include:
- Geopolitical trade disruption: The conflict between the U.S. and China may increase production costs due to high material prices in North America.
- Production shutdowns: China's environmental policies have caused production shutdowns in its manufacturing centers such as Jiangsu and Hebei.
- Logistical issues: The Red Sea shipping limitations of 2024 resulted in higher freight costs and extended shipping periods to Europe.
- Monetary fluctuations: Currency rate fluctuations for the RMB and USD affect the prices globally of critical input materials.
As a result, businesses are opting to diversify their logistics systems. India is becoming an alternative base for manufacturing products. Businesses are also exploring opportunities to manufacture locally in both Europe and North America, using a dual sourcing agrochemicals strategy.
Integrated Pest Management (IPM) as Market Enabler
The implementation of IPM is no longer limited to regulation; it is now influencing how the crop protection chemicals market operates. For example, in the EU, IPM has been an essential component of pest management practices since 2014, and the same is true in countries such as Brazil, India, and Southeast Asia.
From a market perspective, IPM fosters the idea of combining chemical, biological, and digital methods. IPM crop protection chemicals result in increased farmer expenditures but decreased consumption per unit of use as inputs become more efficient.
Therefore, customers now require premium products, brand-based resistance management strategies, and biopesticides rather than cheap alternatives. Organizations that provide comprehensive systems by integrating products and advisory tools will have an edge in the market and can charge higher prices due to their competitiveness in commercial agriculture.
Competitive Insights
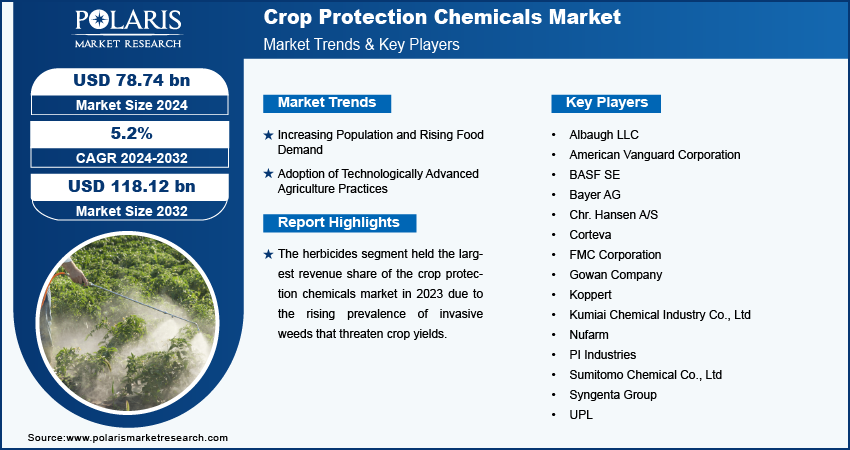
Major market players have shown significant interest in R&D to diversify their product ranges. Notable trends in the industry include product innovations, business alliances, partnerships, investments, and mergers & acquisitions. Major players in the crop protection chemicals market include Albaugh LLC; American Vanguard Corporation; BASF SE; Bayer AG; Chr. Hansen A/S; Corteva; FMC Corporation; Gowan Company; Koppert; Kumiai Chemical Industry Co., Ltd; Nufarm; PI Industries; Sumitomo Chemical Co., Ltd; Syngenta Group; and UPL.
Changes in the competitive environment in the market for crop protection chemicals are occurring rapidly, driven by three major factors that will define strategic positioning through 2026:
Convergence of biological and chemical products: The major corporations have started offering biological solutions to balance the regulatory pressure on chemicals. For instance, firms like BASF, Bayer, and Syngenta are developing a biological product portfolio either internally, through cooperation, or acquisitions. The examples include collaboration between Bayer and AlphaBio Control, as well as Syngenta and Enko.
Platformification: Agrochemical corporations are embedding their products in digital farming platforms to strengthen their relationships with customers and create recurring value. Examples of such platforms include Climate FieldView offered by Bayer, Granular platform of Corteva, and Cropwise by Syngenta.
Regionalization of supply chain: As part of the efforts to address potential risks from tariffs and disruptions in global supply chains, the agrochemical sector is increasingly involved in regional production of its products. Increased investment in emerging markets, including Brazil, India, and the U.S., allows for a more diverse supply chain that reduces exposure to China-centric manufacturing facilities.
BASF SE is one of the prominent players in the crop protection chemicals market, offering a wide range of products such as herbicides, fungicides, and insecticides. The company is characterized by its emphasis on combining productivity and sustainability through biological solutions and precision agriculture. Its global reach and innovative product offerings enable farmers to enhance crop yield under changing environmental regulations.
Bayer AG has a notable presence in the field of crop protection due to the company's comprehensive strategy involving chemicals, seeds, and smart farming. Bayer AG is known for research-oriented innovations such as the creation of environmentally friendly products and farming techniques based on data analytics. Its strategic collaborations and focus on sustainable agriculture support long-term growth in a highly regulated market.
List of Key Companies
- Albaugh LLC
- American Vanguard Corporation
- BASF SE
- Bayer AG
- Chr. Hansen A/S
- Corteva
- FMC Corporation
- Gowan Company
- Koppert
- Kumiai Chemical Industry Co., Ltd
- Nufarm
- PI Industries
- Sumitomo Chemical Co., Ltd
- Syngenta Group
- UPL
Industry Developments
October 2025: Syngenta announced that it obtained over 1,200 regulatory approvals for artificial crop protection compounds in 2025. Some of the newly developed compounds include SEGURIS Evo fungicide for rice crops and VESTORIA Pro insecticide against brown plant hoppers affecting rice cultivation. At the same time, Syngenta has continued deploying ADEPIDYN and TYMIRIUM technologies to enhance nematode and fungal disease control in important markets like Brazil and the Philippines. (Source: syngentagroup.com)
August 2025: UPL Sustainable Agri Solutions introduced its new post-emergent herbicide, Brucia. The company stated that the new herbicide is specifically meant for maize crops in India. It provides farmers with a safe and effective solution against resistant and persistent weeds. (Source: global-agriculture.com)
March 2025: BASF collaborated with Agmatix for the creation of a digital detection system for Soybean Cyst Nematode (SCN). This tool aims at improving the efficiency of risk assessment and making the process of using chemical nematicides smarter. (Source: basf.com)
May 2024: Stara introduced its sprayer for crop protection in Latin America that uses ONE SMART SPRAY's weed management technology together with the technology of Bosch and Xarvio Digital Farming Solutions. (Source: basf.com)
Crop Protection Chemicals Market Segmentation
By Type Outlook (Revenue, USD Billion, 2021–2034)
- Herbicides
- Insecticides
- Fungicides & Bactericides
- Other
By Crop Type Outlook (Revenue, USD Billion, 2021–2034)
- Cereals & Grains
- Oilseeds & Pulses
- Fruits & Vegetables
- Others
By Origin Outlook (Revenue, USD Billion, 2021–2034)
- Synthetic
- Biopesticides
By Form Outlook (Revenue, USD Billion, 2021–2034)
- Liquid
- Solid
By Application Outlook (Revenue, USD Billion, 2021–2034)
- Foliar Spray
- Seed Treatment
- Soil Treatment
- Other
By Regional Outlook (Revenue, USD Billion, 2021–2034)
- North America
- US
- Canada
- Europe
- Germany
- France
- UK
- Italy
- Spain
- Netherlands
- Russia
- Rest of Europe
- Asia Pacific
- China
- Japan
- India
- Malaysia
- South Korea
- Indonesia
- Australia
- Vietnam
- Rest of Asia Pacific
- Middle East & Africa
- Saudi Arabia
- UAE
- Israel
- South Africa
- Rest of Middle East & Africa
- Latin America
- Mexico
- Brazil
- Argentina
- Rest of Latin America
Crop Protection Chemicals Market Report Scope
| Report Attributes | Details |
| Market Size in 2025 | USD 82.51 billion |
| Market Size in 2026 | USD 86.55 billion |
| Revenue Forecast by 2034 | USD 132.22 billion |
| CAGR | 5.4% |
| Base Year | 2025 |
| Historical Data | 2021–2024 |
| Forecast Period | 2026–2034 |
| Quantitative Units | Revenue in USD billion, and CAGR from 2026 to 2034 |
| Report Coverage | Revenue Forecast, Market Competitive Landscape, Growth Factors, and Trends |
| Segments Covered |
|
| Regional Scope |
|
| Competitive Landscape | Crop Protection Chemicals Industry Trend Analysis (2025) Company profiles/industry participants profiling include company overview, financial information, product/service benchmarking, and recent developments |
| Report Format | PDF + Excel |
| Customization | Report customization as per your requirements with respect to countries, regions, and segmentation. |
Source: Polaris Market Research Analysis
Crop Protection Chemicals Market FAQ's
The crop protection chemicals market size stood at USD 82.51 billion in 2025. The market is projected to reach USD 132.22 billion by 2034.
The market is projected to account for a CAGR of 5.4% during the forecast period, 2026 to 2034.
Asia Pacific accounts for the largest share of the global market owing to the massive agricultural sectors in China and India.
Major players in the market include Albaugh LLC; American Vanguard Corporation; BASF SE; Bayer AG; Chr. Hansen A/S; Corteva; FMC Corporation; Gowan Company; Koppert; Kumiai Chemical Industry Co., Ltd; Nufarm; PI Industries; Sumitomo Chemical Co., Ltd; Syngenta Group; and UPL.
The cereals & grains segment leads the market. Staple crops such as wheat, rice, corn, and barley create significant demand for crop protection products.
Herbicides hold the largest revenue share. Their dominance is driven by widespread weed management requirements across row crops.
The 2025 U.S. tariff regime on Chinese imports created pricing pressure on active ingredients that are primarily manufactured in China. This is driving farm input cost increases of 4–6% into 2026.
Integrated pest management (IPM) is a holistic crop protection approach. It combines biological, cultural, and physical pest control methods to minimize economic, health, and environmental risks. IPM is mandated in the EU since 2014 and is increasingly adopted globally. It structurally drives demand for diverse product portfolios.
Download Sample Report of Crop Protection Chemicals Market
Please fill out the form to request a customized copy of the research report.
