

Overview
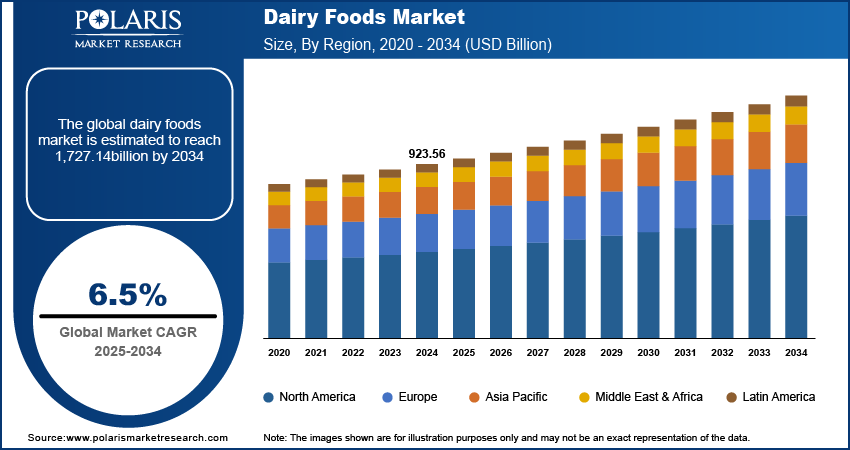
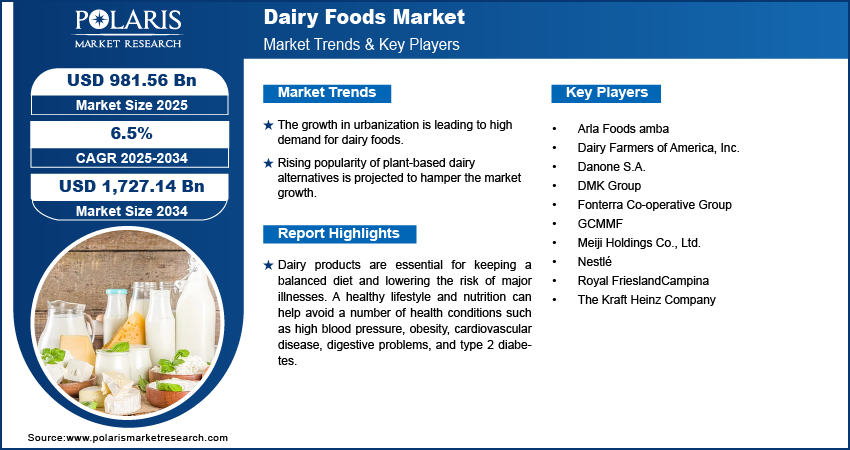
The global dairy foods market is estimated around USD 1,044.12 billion in 2025, with consistent growth anticipated during 2026–2034. Expansion is supported by rising per capita protein intake, rapid urbanization, and increasing consumption of value-added dairy products across retail and foodservice channels. The market is projected to grow at a CAGR of 6.5% during the forecast period.
Key Takeaways:
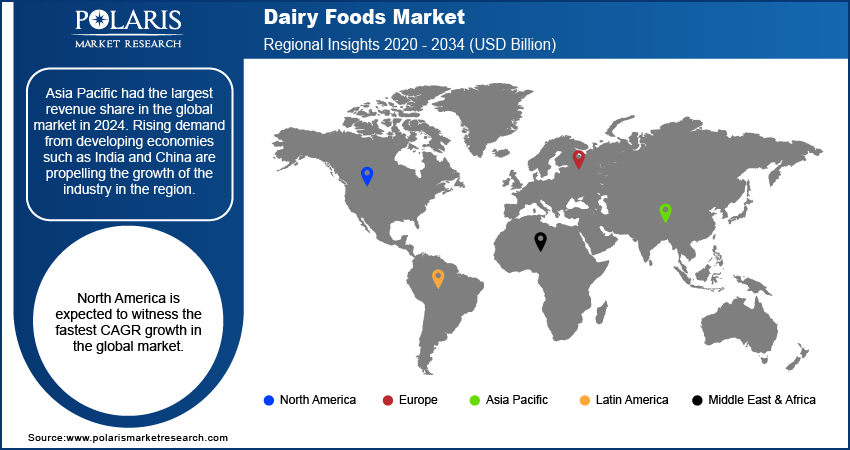
- Asia Pacific accounted for the largest regional share of around 39.7% in 2025, driven by rapid urbanization, rising disposable incomes, expanding middle-class population, and increasing preference for branded and packaged dairy products.
- By Product, Milk segment accounted for the largest share of approximately 46.5% in 2025, supported by its staple consumption pattern, consistent demand across economies, and role as a primary raw material for dairy products.
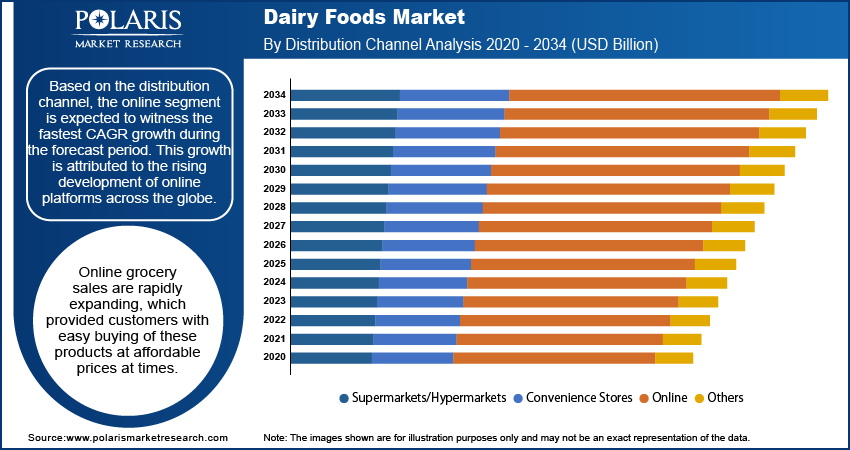
- By Distribution Channel, Retail segment accounted for the largest share of around 72.4% in 2025, driven by strong supermarket and hypermarket presence, high product visibility, and expanding online grocery platforms with improving cold chain infrastructure.
Market Statistics
- 2025 Market Size: USD 1,044.12 billion
- 2034 Projected Market Size: USD 1,835.28 billion
- CAGR (2026-2034): 6.5%
- Asia Pacific: Largest market in 2025
Industry Dynamics
- Rising demand for protein-rich nutrition is strengthening consumption of milk, yogurt, and cheese across both developed and emerging markets.
- Expansion of refrigerated logistics and organized retail networks is improving shelf life and geographic penetration of packaged dairy products.
- High lactose intolerance rates in parts of Asia Pacific and Africa moderate conventional milk consumption growth.
- Innovation in fortified, probiotic, and clean label a2 dairy products is unlocking long-term premium category expansion opportunities.
What Are Dairy Foods?
Dairy foods market comprises the commercial production and distribution of milk, cheese, yogurt, butter, cream, powdered milk, and dairy-based desserts, forming the core structure of the global dairy foods market within broader food and beverage systems. Dairy foods market revenue reflects consumption across retail, foodservice, and industrial channels, with dairy industry valuation influenced by raw milk pricing, processing efficiency, and branded product margins. Current dairy industry analysis indicates a steady dairy market growth rate across the forecast window, supported by rising urbanization, higher per capita protein intake, expanding cold-chain infrastructure, and product premiumization in value-added categories.
To Understand More About this Research:Request a Free Sample Report
Drivers & Opportunities
Rising Demand for Protein-Rich Nutrition: Growing awareness of protein intake for child development, muscle health, and weight management is strengthening protein-rich dairy product growth. According to global nutrition information, in 2022, 149 billion children under the age of five were stunted, 45 billion were wasted, and 37 billion were overweight, reflecting nutritional disparities. Dairy products like milk, yogurt, and cheese are convenient sources of high-quality protein and micronutrients. The nutritional gap generated by the above factors, along with the premium dairy products trend, fuels the demand for dairy products.
Development of Cold Chain Infrastructure: Enhancements in refrigerated supply chain and storage infrastructure are leading to an increase in the shelf life and distribution of dairy products. The development of the cold chain helps in the reduction of losses due to spoilage and enables the distribution of fresh and processed dairy products to semi-urban and rural areas. Increasing investment in dairy processing helps in large-scale production and product development. The effect of urbanization on the dairy industry further fuels the penetration of organized retail, boosting volume growth in the packaged and organized sector.
Restraints & Challenges
High Lactose Intolerance Rates: Increasing rate of lactose intolerance diagnosis in the Asia Pacific, Africa, and Latin America regions restricts the consumption of regular milk. This moderates overall dairy penetration in sensitive populations. The constraint pushes reformulation efforts and increases production complexity.
Opportunity
Fortified and Clean Label Dairy Products: Increasing demand for nutrition-enriched products are generating opportunities in the fortified milk, probiotic yogurt, and vitamin-fortified dairy drinks markets. Clean label dairy products with fewer additives and greater transparency in sourcing are in trend among health-aware consumers. The influence of urbanization on dairy consumption patterns has encouraged the adoption of fortified and functional dairy products in modern grocery channels. In addition to the premium dairy products trend, innovation in micronutrient fortification and digestive-friendly product development creates incremental value-based growth in the dairy foods market.
Trends & Innovation Landscape
-
Functional & Fortified Dairy Expansion
The functional dairy market is also growing as consumers seek high-protein, probiotic, lactose-free, and vitamin-enhanced dairy products. The organic dairy food market is driven by clean label positioning, few ingredients, and open sourcing. Companies are positioning on protein fortification, digestive health, and lower sugar formulations to address the changing trends in wellness.
-
Sustainability & Methane Reduction Initiatives
The growing need to reduce the carbon footprint of the dairy industry is fueling interest in sustainable dairy production methods, such as feed management, manure systems, and renewable energy. Lifecycle assessment approaches are used to quantify emissions from production and processing. Methane-reduction and regenerative agriculture initiatives are emerging as critical to future competitiveness.
-
Digitalization & Automation in Dairy Processing
Innovation in dairy processing technology and automation in dairy processing is improving yield management, traceability, and economic viability. AI-powered quality analysis, predictive analytics, and digital batch tracing are improving processability. Upstream, smart dairy farming tools support herd monitoring, milk productivity optimization, and supply chain transparency.
Segmental Insights
This report offers detailed coverage of the Dairy Foods market by product type and application to help readers identify the fastest expanding and most attractive demand segments.
By Product Type
-
Milk
Milk led the market share, as it is a staple product in food processing and consumption. The demand for milk is stable in developing countries, as it has a steady consumption pattern due to population growth. Milk is a primary input for various dairy products, thereby establishing its dominance in the market.
-
Cheese
Cheese is projected to grow at a fast pace during the forecast period. Rising western dietary patterns and expansion of quick-service restaurants accelerate cheese market forecast projections. Dairy Foodservice drives the adoption of pizza, bakery, and ready-to-eat products.
By Application
-
Retail Distribution
The dairy retail market registered the highest market share, supported by supermarket chains, hypermarkets, and organized retailing. Packaged dairy products currently dominates in terms of shelf space due to daily consumption. The development of online dairy product sales further strengthens this market, particularly in urban areas with cold chain development.
-
Infant Nutrition
Infant nutrition market is growing at a rapid pace. Increasing birth rates in developing areas and the use of premium infant formulas drive the market. Dairy protein in sports nutrition and dairy functional applications are also contributing to growth through high-protein fortified products.
Regional Analysis
Asia Pacific Dairy Foods Market Assessment
Asia Pacific dominated the global dairy products market, driven by fast-paced urbanization and increasing levels of disposable income across the region. As per UN-Habitat, the urban population in Asia is expected to increase by almost 50% by 2050, adding 1.2 billion people to the urban population. This change in the population influenced consumer behavior, leading to an increase in the adoption of packaged and branded products in urban areas. The growth rate of the Asia Pacific dairy products market remained high due to increasing spending by middle-class families on milk, yogurt, cheese, and dairy drinks.
North America Dairy Foods Market Insight
North America dairy foods market maintained a stable structure, driven by consumer demand for high-protein and functional dairy products such as Greek yogurt and fortified milk. The high per-capita consumption of cheese, butter, and functional dairy products maintained a stable revenue stream. In February 2026, Forager Project further expanded its line of Greek-style dairy-free yogurt in the US, further increasing category presence and competition in protein-driven segments. Innovation in lactose-free, probiotic-enhanced, and plant-based alternatives continued to boost consumption patterns across retail and foodservice platforms.
Europe Dairy Foods Market Overview
Europe dairy foods market size indicated a mature and stable consumption pattern, supported by historical and cultural roots in cheese, yogurt, and specialty dairy products. Premiumization continued to drive demand for artisanal, origin-specific, and organic dairy products in Western Europe. Market growth remained focused on high-margin segments, with specialty cheese and cultured dairy products continuing to drive incremental value growth.
Middle East Dairy Foods Market Assessment
Middle East dairy consumption pattern demonstrated a steady growth, fueled by the rising population and a growing demand for packaged and extended shelf-life dairy products. Urbanization and modernization of the retail sector fueled the demand for processed milk, yogurt, and dairy-flavored beverages. The lack of domestic milk processing capacity maintained the dependence on importation and regional processing, which influenced procurement and pricing. Investment in local dairy processing plants was strategic in stabilizing supplies while fueling demand growth in the long term.
Heat Map Analysis
|
Region |
Market Position |
Growth Momentum |
Regulatory Strength |
Recycling Infrastructure |
Secondary Lead Production Base |
|
Asia Pacific |
Dominant |
Very High |
Medium |
Low–Medium |
High |
|
North America |
High |
Medium |
High |
Medium |
Medium–High |
|
Europe |
High |
Medium |
Very High |
High |
High |
|
Middle East |
Emerging |
High |
Medium |
Low |
Low–Medium |
Key Players & Competitive Analysis Report
The dairy foods market is moderately consolidated, dominated by global dairy cooperatives and global food giants operating in the milk, cheese, yogurt, butter, and value-added dairy categories. The competitive rivalry is impacted by the extent of raw milk procurement, processing capacity, brand strength, and distribution. Large-scale processors rely on vertically integrated supply chains, farmer networks, and product diversification to ensure pricing stability. Regional dairy cooperatives compete on the strength of local sourcing benefits and strong domestic brands, while global leaders expand through premiumization, functional dairy, and value-added protein formulations.
Key companies in the global dairy foods market are Arla Foods amba, Dairy Farmers of America, Inc., Danone S.A., DMK Deutsches Milchkontor GmbH, Fonterra Co-operative Group Limited, FrieslandCampina N.V., GCMMF Limited (Amul), Glanbia plc, Kraft Heinz Company, Lactalis Group, Mengniu Dairy Company Limited, Nestlé S.A., Royal FrieslandCampina N.V., Saputo Inc., and Yili Group Co., Ltd.
Pricing, Trade & Value Chain Analysis
-
Raw Milk Price Trends
Raw milk price trends are affected by factors such as the cost of feed, productivity of dairy herds, climatic conditions, and regional supply-demand conditions. Farm prices keep varying according to seasonal production patterns and input price variability. The transmission of prices occurs from raw milk procurement to processing margins and finally to retail prices. As prices at the farm level increase significantly, processors offset the impact by compressing their margins before finally transmitting the prices to retailers.
-
Dairy Commodity Pricing Dynamics
Global dairy commodity pricing for butter, skim milk powder (SMP), whole milk powder (WMP), and cheese shapes contract negotiations and export competitiveness. Prices remain responsive to inventory, energy, and exchange rate changes. Benchmarking platforms shape bulk trade contracts, while retail prices are determined by value-added strategies and brand differentiation. Commodity cycles directly affect processor profitability, particularly in export-driven markets.
-
Global Trade & Export Landscape
The dairy export market size is concentrated among a few export hubs. Key dairy product exporting nations are New Zealand, the EU block, the US, and Australia, which account for the largest trade volumes of milk powder and cheese. Import export dairy statistics reveal an increasing demand for dairy products in Asia, the Middle East, and Africa.
Trade flows are influenced by tariff structures, sanitary standards, and dairy trade regulations impact, including quotas and bilateral agreements. Export competitiveness depends on cost-efficient milk production, cold-chain infrastructure, and regulatory compliance.
Premium Insights & Strategic Outlook
-
Investment Opportunities
The dairy industry investment opportunities are most promising in value-added protein, functional dairy, and specialty cheese categories. The allocation of investment is rising in automation and sustainability-linked investments within the frameworks of dairy industry investment analysis.
-
White-Space Segments
The white-space segments include lactose-free dairy products, fortified dairy drinks, plant-dairy combinations, and high-end yogurt packaging. The developing countries in Southeast Asia, Africa, and Latin America provide growth opportunities in terms of growing demand due to rising incomes and improving cold chain infrastructure.
Key Players
- Arla Foods amba
- Dairy Farmers of America, Inc.
- Danone S.A.
- DMK Deutsches Milchkontor GmbH
- Fonterra Co-operative Group Limited
- FrieslandCampina N.V.
- GCMMF Limited (Amul)
- Glanbia plc
- Kraft Heinz Company
- Lactalis Group
- Mengniu Dairy Company Limited
- Nestlé S.A.
- Royal FrieslandCampina N.V.
- Saputo Inc.
- Yili Group Co., Ltd.
Industry Developments
- January 2026: Karnataka Milk Federation (KMF) launched a new dairy product line focusing on nutrition and traceable ingredients. The new product line expanded Dairy Foods offerings by addressing the needs of health-conscious consumers through fortified and traceable products.
- September 2024: Arla Foods Ingredients launched a new high-protein dairy product line focusing on muscle health and active lifestyles. The new product line expanded Dairy Foods offerings by addressing the needs of health-conscious consumers through high-protein dairy ingredients.
Dairy Foods Market Segmentation
By Product Type Outlook (Revenue, USD Billion, 2021-2034)
- Milk
- Cheese
- Yogurt
- Butter and cream
- Powdered milk and dairy desserts
By Application Outlook (Revenue, USD Billion, 2021-2034)
- Retail distribution
- Infant nutrition
By Regional Outlook (Revenue, USD Billion, 2021-2034)
- North America
- US
- Canada
- Europe
- Germany
- France
- UK
- Italy
- Spain
- Netherlands
- Russia
- Rest of Europe
- Asia Pacific
- China
- Japan
- India
- Malaysia
- South Korea
- Indonesia
- Australia
- Vietnam
- Rest of Asia Pacific
- Middle East & Africa
- Saudi Arabia
- UAE
- Israel
- South Africa
- Rest of Middle East & Africa
- Latin America
- Mexico
- Brazil
- Argentina
- Rest of Latin America
Dairy Foods Market Report Scope
|
Report Attributes |
Details |
|
Market Size in 2025 |
USD 1,044.12 Billion |
|
Market Size in 2026 |
USD 1,110.35 Billion |
|
Revenue Forecast by 2034 |
USD 1,835.28 Billion |
|
CAGR |
6.5% from 2026 to 2034 |
|
Base Year |
2025 |
|
Historical Data |
2022–2024 |
|
Forecast Period |
2026–2034 |
|
Quantitative Units |
Revenue in USD Billion and CAGR from 2026 to 2034 |
|
Report Coverage |
Revenue Forecast, Competitive Landscape, Growth Factors, and Industry Trends |
|
Segments Covered |
|
|
Regional Scope |
|
|
Competitive Landscape |
|
|
Report Format |
|
|
Customization |
Report customization as per your requirements with respect to countries, regions, and segmentation. |
FAQ's
• The global market size was valued at USD 1.044.12 billion in 2025 and is projected to grow to USD 1,835.28 billion by 2034.
• Asia Pacific led the dairy foods market in 2025, driven by the increasing urbanization, growth of organized retail, and the rising middle-class expenditure in China and India.
• Retail distribution is the dominating application, followed by foodservice and infant nutrition.
• The key players are Arla Foods amba, Dairy Farmers of America, Inc., Danone S.A., Fonterra Co-operative Group Limited, FrieslandCampina N.V., GCMMF Limited (Amul), Glanbia plc, Kraft Heinz Company, Lactalis Group, Mengniu Dairy Company Limited, Nestlé S.A., Saputo Inc., and Yili Group Co., Ltd.
• The factors driving the dairy foods market are the increasing demand for protein, urbanization-driven consumption growth, development of cold chain infrastructure, and the adoption of fortified and premium dairy products.
Page last updated on:
Jan-2023
Research Methodology
A robust system of research, verification, and forecasting designed to ensure reliable and actionable market insights.
Polaris Market Research uses a clear and structured approach to deliver insights that clients can rely on. The process combines detailed primary and secondary research, including direct communication with industry experts. The detailed information helps build a complete picture of market trends and developments. Secondary data is gathered from credible sources such as industry reports, company filings, government source links, and trusted organization databases. It is then cross-checked through discussions with key stakeholders across the value chain. Market size and forecasts are developed using both bottom-up and top-down methods to ensure accuracy and consistency in the final results.

Project Setup
Step 1 & 2:
- We start every project by clearly understanding the client’s objective or goal, then defining the market scope, and aligning regions, segments, and timelines.
- Once the foundation is set, we collect data from all-around of sources, including company reports, government databases, and paid industry platforms.
- Our research is based on secondary data, which helps us build a strong understanding of the market across regions and industries. Then we validate this information through primary research by speaking directly with industry experts, companies, and stakeholders.
- By combining secondary and primary research, we ensure that our market insights are accurate, practical, and closely aligned with real market conditions.
Data Collection
We gather information from both public and verified sources:

Data Structuring
Step 3:
- All collected data is organized into a consistent format to ensure accurate analysis. Since inputs come from multiple sources, they are standardized and aligned before use.
- The data is segmented by product, application, and region, and mapped across a defined historical period (2020–2024). All values are converted into common units (USD Mn/Bn), and volume and pricing are aligned where required to estimate revenue.
- Any overlaps or inconsistencies are reviewed and adjusted to maintain accuracy (<5% variance threshold).
- The result is a structured dataset that allows for clear comparison across regions and supports reliable analysis and forecasting.
Structured Market Dataset, USD Mn/Bn

4. Data Structuring
Step 4: TOP-DOWN APPROACH
- We start with the overall market size at a global or macro level.
- The market is then narrowed down based on scope and industry relevance.
- We apply penetration rates and split the data by region and segment.
- This helps us estimate the market size for specific segments.
- The numbers are validated through cross-checks to ensure accuracy.

Step 5: BOTTOM-UP APPROACH
- We begin by analyzing data from leading companies in the market.
- Revenue data is collected and mapped across different segments.
- The data is then aggregated to estimate the total market size.
- To fill in any gaps, adjustments are made based on industry standards.
- Validation checks make sure that the results are correct.

5. Data Structuring
Step 6:
At Polaris Market Research, we employ a methodical forecasting strategy. This approach blends the analysis of historical data with real-time market validation. To forecast future trends with precision, we examine past patterns, pricing fluctuations, and the interplay of supply and demand. To ensure our conclusions reflect the present market landscape, we actively seek input from industry experts and key stakeholders.
To refine our predictions, we carefully consider critical elements such as market drivers and restraints, fluctuations in raw material costs, emerging technologies, and the production capabilities of various regions. Furthermore, we assess regulatory frameworks and potential policy shifts to gauge their potential impact on market expansion.
All this information is synthesized to generate precise forecasts for each segment and region. These forecasts illuminate the current state of the market and highlight forthcoming opportunities.

6. Data Structuring
Step 7:
In the final stage, we validate all our estimates using a triangulation method, where data is cross-checked from multiple reliable sources, like company data, primary interviews, and secondary research. This helps us make sure that our numbers are correct and fit with the rest of the market.
This process involves verifying data consistency across various segments and geographic areas. It also requires comparing historical trends with the assumptions support the forecast. Any discrepancies involve adjustments to ensure everything remains aligned and dependable.
Once the data is finalized, we prepare the final outputs, including market size estimates, segment-wise breakdowns, and growth metrics. These are delivered in structured formats such as tables, charts, and data files for easy analysis and use.
We collaborate closely with clients, ensuring the final products align with their requirements. This includes offering tailored adjustments, supplementary data analyses, and continuous assistance. Furthermore, we monitor market trends post-delivery, providing updates and refinements to maintain the insights' relevance as time passes.
Post-delivery, we continue to monitor market shifts, offering updates and adjustments to ensure the insights remain relevant over time.
Validation
Triangulation Framework
- Company-level data
- Primary inputs from industry participants
- Secondary benchmarks and published data
- Variance maintained within ±5-10%
- Adjustments applied to align estimates
- Segment values validated against overall market structure
Quality Check
Data Consistency & Integrity
- Segment totals validated to 100%
- Regional estimates aligned with global market size
- Historical trends compared against forecast outputs
- Assumptions reviewed for cross-segment and regional alignment
Output & Delivery
Final Outputs
- Market size estimates (USD Mn/Bn)
- Segment-wise distribution (%)
- Growth metrics (CAGR %)
- Structured tables and charts
- Segment-level datasets
- Excel-based data files for further analysis
Client Alignment & Support
- Deliverables are aligned with defined client requirements and scope
- Custom data cuts and segment splits are incorporated as required
- Post-delivery queries are addressed through analyst interactions
- Additional clarifications and data support are provided upon request
Client Continuity & Updates
- Market developments are tracked post-delivery to capture changes in key trends
- Updated data and revisions are provided based on new market inputs
- Additional refinements and data cuts are shared as required
- Continued analyst engagement supports evolving client requirements
