
Domestic Tourism Market Size, Share Global Analysis Report, 2023-2032
REPORT DETAILS
The global domestic tourism market was valued at USD 1,670.34 billion in 2022 and is expected to grow at a CAGR of 16.9% during the forecast period.
Domestic travel is defined as travel within a single country. Domestic travelers are people who travel to a nearby state. Due to its impact on local expenditure, domestic travel is essential to the domestic economy. This raises the local government's financial resources, which it may employ to modernize the community's services and infrastructure while also enhancing the quality of life for its residents. Considering how Covid-19 has impacted peoples' employment and financial outlooks, this is very important.
Source: Polaris Market Research Analysis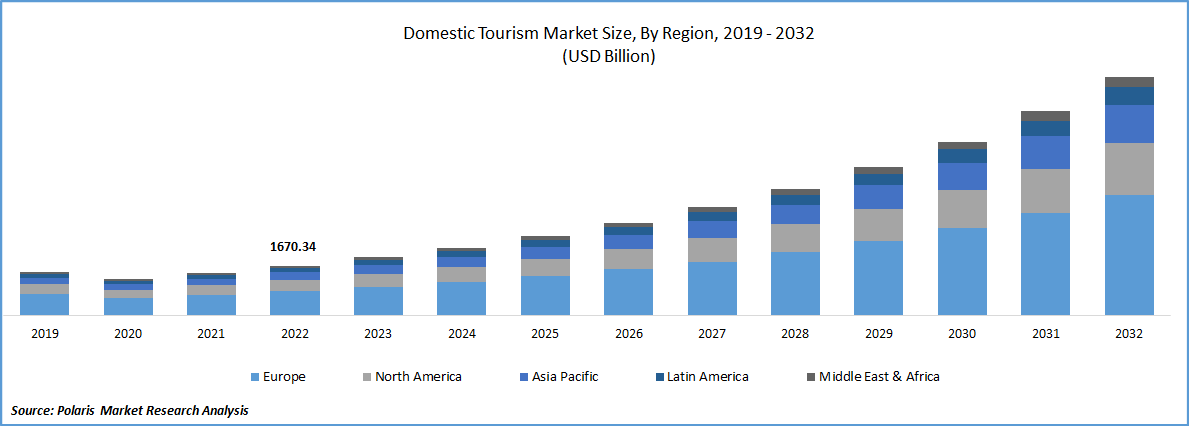
Know more about this report: Download Sample Report
Domestic travel helps to overcome seasonality within regions by exposing tourists to less-visited rural areas that are typically ignored by foreign visitors. China has been extraordinarily successful in promoting domestic tourism, beating all other countries in domestic expenditure growth because to its growing middle class and the government's assistance. While China continues to lead in terms of absolute domestic expenditure growth, domestic travel and tourist expenditures have increased significantly in many emerging countries as their citizens start to have more disposable income.
Due to the closure of international travel owing to border lockout due to COVID-19, internal tourism, particularly in the local areas to relax and have some alone time, increased dramatically. Also, domestic travel does away with the requirement to apply for a visa and the added wait time involved. Long-haul flights, hotel stays, tour guides, and the more expensive "foreign visitor" tickets for local attractions are just a few of the extra expenses travelers frequently incur when travelling abroad. There are also visa and immigration fees, any costs associated with gathering additional required paperwork, and long-haul plane tickets.
Also, visiting local locations necessitates regular interactions with locals, which leads to the exploration of the true distinctive character of the location, people, and culture. Due to their familiarity with the local culture and proficiency in the language, tourists also learn a lot about the area they are visiting while travelling there.
Due to the rise of the tourist sector over the past century, people are now able to visit other states or cities to experience these locations and activities. The expansion of the travel and hospitality industries was also aided by the introduction of numerous activities and alluring packages by tour operators as a result of this development. The development of media technology was a factor in the growth of domestic tourism, in addition to the significant roles that travel and hotels played.
Source: Polaris Market Research Analysis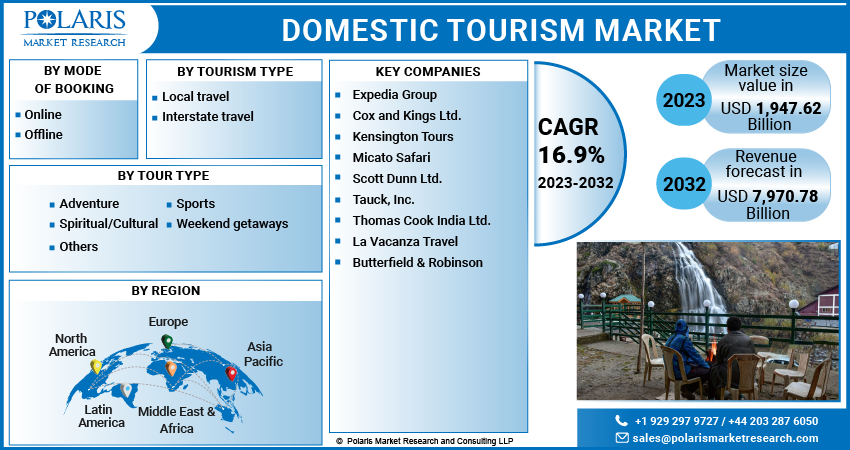
For Specific Research Requirements, Request for a Customized Research Report
Industry Dynamics
Growth Drivers
The rising disposable income of the populace, particularly that of the middle class, is what fuels the domestic tourism market. The rise of the domestic tourist business is driven by the rising middle-class population and rising affluence in many countries. the growing public preference for unusual and exotic vacation experiences. People are demonstrating a desire to go to unusual locations within their own country's borders and to enjoy unique experiences by going to far-off locales.
People's understanding of various trends and tourism destinations has improved as a result of their greater exposure to numerous social media platforms. More and more often, social media serves as a fictitious travel agency. Consumers are choosing destinations more frequently where familiar people have previously visited or stayed. Additionally, they refer to evaluations and analysis provided on different social networking sites. As a result, the growth of the tourism market is being driven by the usage of social media for promotion.
With the strict lockdown caused by pandemics, countryside and nature tourism is becoming increasingly popular. People are probably more prone to like outdoor and rural vacations. Agriculture, gastronomy, and health tourism are three popular forms of rural tourism. The rise of the domestic tourist business will be fueled by the soaring demand for rural travel.
The industry is expanding due to the rising trend and simplicity of online reservations. In addition, the development of mobile applications, big data analytics, and artificial intelligence is advancing the domestic tourist sector.
Report Segmentation
The market is primarily segmented based on tour type, tourism type, mode of booking, and region.
| By Tour Type | By Tourism Type | By Mode of booking | By Region |
|
|
|
|
Source: Polaris Market Research Analysis
Know more about this report: Download Sample Report
In 2022, the Offline Booking Dominated the Market, Accounting for the Largest Market Share
The tour operators offer a wide range of services to the tourists through offline modes, including fully-guided packages, fully-customized packages, designed standardized tour packages, and specialized tourism packages where the customer selects each component of the tour based on their specific needs. Small tour firms have found a market niche and increased their profits by operating locally.
Operating online is becoming more and more frequent in the travel sector. Online transactions are more alluring to tour operators since they can run their businesses at a low cost and reach a broader target audience. Nowadays, customers prefer to make purchases online because there are so many options for them to compare and buy what they want. Based on client preferences, travel businesses must adjust to market developments. As a result, both market forces are being driven in the same direction by "online mode". So, the importance of online booking has increased in the travel industry.
Europe Dominates the Global Market in 2022
Europe is home to some of the most well-known countries and cities in the world, many of which have fascinating history, contrasting cultures, and magnificent natural settings. According to Dream Big Travel Far, there were 682 million domestic arrivals in European countries in 2019.
From 2023 to 2032, Asia Pacific is anticipated to experience a high CAGR. The rapid rise in middle class income households in developing countries, particularly in the Asia-Pacific area, has had a significant impact on domestic travel and tourism. Even though there is a positive correlation between the growth of GDP per capita and domestic spending, the wide variations in performance between the countries are caused by the tourism industry's different levels of maturity, income levels, the state of its infrastructure, and the geopolitical and economic environments in each of the countries.
Competitive Insight
Some of the major players operating in the global market:
- Expedia Group
- Cox and Kings Ltd.
- Kensington Tours
- Micato Safari
- Scott Dunn Ltd.
- Tauck
- Thomas Cook India Ltd.
- La Vacanza Travel
- Butterfield & Robinson
Recent Developments
-
In August 2025, Expedia Group introduced a new AI-driven personalization feature designed to deliver customized travel recommendations based on user behavior, preferences, and booking patterns. This advanced capability enhances user engagement and overall customer satisfaction by offering more relevant travel options across Expedia’s digital platforms.The launch highlights the growing importance of artificial intelligence in the domestic tourism sector, where data-driven personalization is becoming a key competitive differentiator. By integrating AI into its recommendation engine, Expedia Group strengthens its leadership position in travel technology innovation and improves its ability to attract and retain a broader customer base seeking tailored travel experiences.
- In April 2023: Expedia launched new feature powered by ChatGPT to help plan travel. Expedia launched a new feature that uses ChatGPT artificial intelligence technology to help plan trips. The feature is currently is in beta testing.
Domestic Tourism Market Report Scope
| Report Attributes | Details |
| Market size value in 2023 | USD 1,947.62 billion |
| Revenue forecast in 2032 | USD 7,970.78 billion |
| CAGR | 16.9% from 2023 – 2032 |
| Base year | 2022 |
| Historical data | 2019 – 2021 |
| Forecast period | 2023 - 2032 |
| Quantitative units | Revenue in USD billion and CAGR from 2023 to 2032 |
| Segments covered | By Tour type, By Tourism type, By mode of booking, By region |
| Regional scope | North America, Europe, Asia Pacific, Latin America, Middle East & Africa |
| Key companies | Expedia Group, Cox and Kings Ltd., Kensington Tours, Micato Safari, Scott Dunn Ltd., Tauck, Inc., Thomas Cook India Ltd., La Vacanza Travel, and Butterfield & Robinson |
Source: Polaris Market Research Analysis
domestic tourism market FAQ's
The global domestic tourism market size is expected to reach USD 7,970.78 billion by 2032, according to a new study by Polaris Market Research.
Key players in the domestic tourism market are Expedia Group, Cox and Kings Ltd., Kensington Tours, Micato Safari, Scott Dunn Ltd., Tauck, Inc., Thomas Cook India Ltd., La Vacanza Travel.
Europe contribute notably towards the global domestic tourism market.
The global domestic tourism market expected to grow at a CAGR of 16.9% during the forecast period.
The domestic tourism market report covering key segments are tour type, tourism type, mode of booking and region.
Challenges include infrastructure gaps, seasonal demand fluctuations, price sensitivity, regional disparities, safety concerns, and environmental sustainability pressures on destinations.
Sustainability emphasizes responsible travel, reduced environmental impact, local community benefits, eco-friendly stays, and protection of cultural and natural heritage sites.
Download Sample Report of domestic tourism market
Please fill out the form to request a customized copy of the research report.
