
E-commerce Logistics Market Demand, Opportunity, Growth Analysis, 2025-2034
REPORT DETAILS
Market Statistics
Market Overview
The global e-commerce logistics market size was valued at USD 500.76 billion in 2024, growing at a CAGR of 22.3% from 2025 to 2034. The rapid growth of online shopping and digital commerce platforms, along with the growing integration of advanced technologies, are the key factors shaping the market landscape.
Key Insights
- The transportation segment accounted for the largest market share in 2024, owing to the rapid growth of last-mile delivery services.
- The business-to-consumer (B2C) segment is projected to witness the fastest growth during the projection period, primarily driven by the significant rise in direct-to-consumer e-commerce sales.
- North America e-commerce market growth is driven by the rising integration of AI into logistics operations and the increased adoption of automated warehouse solutions are driving the region’s leading market share.
- Asia Pacific led the global market in 2024 due to the high smartphone penetration in the Asia Pacific has resulted in increased utilization of e-commerce platforms.
Industry Dynamics
- The rapid expansion of fulfillment centers and regional warehouses by businesses, which play a key role in e-commerce logistics to improve customer satisfaction and provide faster delivery, drives market growth.
- The increased adoption of automation tools and AI-driven systems, which help improve operational efficiency and reduce human error, is fueling market expansion.
- The rising emphasis on sustainable logistics solutions is expected to provide several opportunities to market participants.
- High initial cost associated with e-commerce logistics may hinder market growth.
Market Statistics
- 2024 Market Size: USD 500.76 billion
- 2034 Projected Market Size: USD 3,721.53 billion
- CAGR (2025-2034): 22.3%
- Asia Pacific: Largest Market in 2024
AI Impact on E-Commerce Logistics Market
- AI optimizes route planning and delivery scheduling, reducing transit times and operational costs.
- Machine learning models forecast demand patterns. Their use enables better inventory management and warehouse efficiency.
- AI-powered tracking systems provide real-time shipment visibility, improving customer experience and satisfaction.
- Continuous AI learning enhances supply chain adaptability, helping logistics networks respond quickly to market fluctuations and disruptions.
Source: Polaris Market Research Analysis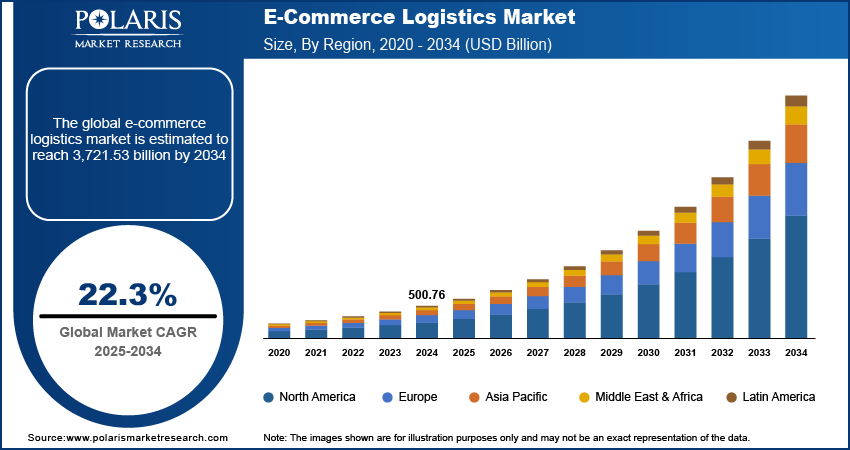
To Understand More About this Research: Download Sample Report
E-commerce logistics represents the critical infrastructure that enables the seamless flow of goods from online retailers to end consumers. It encompasses warehousing, transportation, last-mile delivery, reverse logistics, and various technological integrations that facilitate efficient order fulfillment and delivery processes. The market for e-commerce logistics has evolved significantly in recent years, driven by the exponential growth of online shopping and digital commerce platforms. The transformation of consumer shopping patterns, particularly accelerated by the global pandemic, has led to a fundamental shift in retail logistics operations. As a result, companies are investing heavily in automated solutions and digital infrastructure to meet the growing demand for fast, reliable delivery services.
The e-commerce logistics market has seen substantial innovation in areas such as automated sorting systems, AI-powered route optimization, autonomous delivery vehicles, and blockchain-based tracking solutions. Major e-commerce platforms have developed dedicated logistics networks, while traditional logistics providers have adapted their operations to accommodate the unique requirements of e-commerce fulfillment. The integration of IoT devices, advanced analytics, and cloud-based management systems has become crucial for maintaining competitive advantage and operational efficiency in this rapidly evolving market.
Market Dynamics
Warehouse and Distribution Network Expansion
Warehouse and distribution network expansion plays a crucial role in the e-commerce logistics by enabling companies to offer faster delivery and improve customer satisfaction. Businesses are expanding their fulfillment networks by establishing more fulfillment centers and regional warehouses as e-commerce continues to grow. These warehouses are strategically located closer to key customer bases, reducing the time and distance required to ship goods. For instance, in September 2024, Amazon has introduced a comprehensive, fully-managed Supply Chain by Amazon service, which features an end-to-end solution designed to enhance operational efficiency. This service is resulting in an average increase of 20% in sales conversion rates. This expansion of warehouses and distribution networks is pivotal in enhancing the overall customer experience, driving satisfaction, and maintaining a competitive edge in the rapidly evolving e-commerce market.
Advancements in Technology and Automation
Automation tools, such as robotic sorting systems, autonomous vehicles, and drones, are enhancing operational efficiency, reducing human error, and speeding up delivery times. AI-driven systems enable better route planning, inventory management, and demand forecasting, resulting in cost savings for logistics companies. Real-time tracking and analytics provide customers with transparency and enhance the overall delivery experience. These technological innovations are allowing logistics providers to scale their operations, meet the growing demand, and streamline the entire supply chain process, ultimately driving e-commerce logistics market revenue.
Source: Polaris Market Research Analysis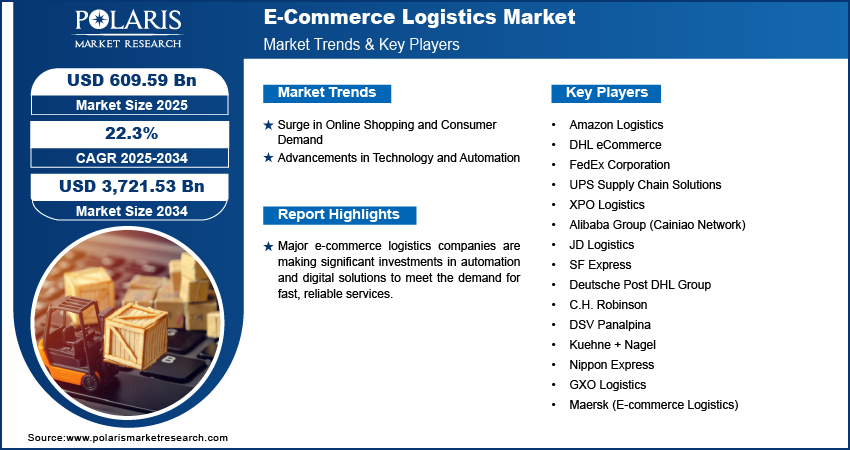
Get Full Segment-Level Forecasts & Insights: Download Sample Report
Segment Insights
Outlook Based on Service Type
Based on service type, the market is segmented into transportation, warehousing, value-added services, returns management, and cross-border services. The transportation segment held the largest e-commerce logistics market share in 2024, driven by the rapid growth in last-mile delivery services. The integration of AI-powered route optimization and real-time tracking capabilities has significantly enhanced the efficiency of transportation services. The growing demand for same-day and next-day deliveries has forced companies to invest heavily in transportation infrastructure and technology, further solidifying the segment’s growth in the global market.
Evaluation Based on Business Model
Based on business model, the market is segmented into business-to-business (B2B), business-to-consumer (B2C), and consumer-to-consumer (C2C). The business-to-consumer (B2C) segment is projected to witness the fastest growth from 2025 to 2034, primarily due to the unprecedented surge in direct-to-consumer e-commerce sales. The pandemic-induced shift in consumer behavior, coupled with the rise of social commerce platforms, has created a robust ecosystem for B2C logistics operations. The increasing adoption of mobile shopping apps and the integration of AR/VR technologies in online shopping experiences have further accelerated the growth of B2C logistics services in the global market.
Source: Polaris Market Research Analysis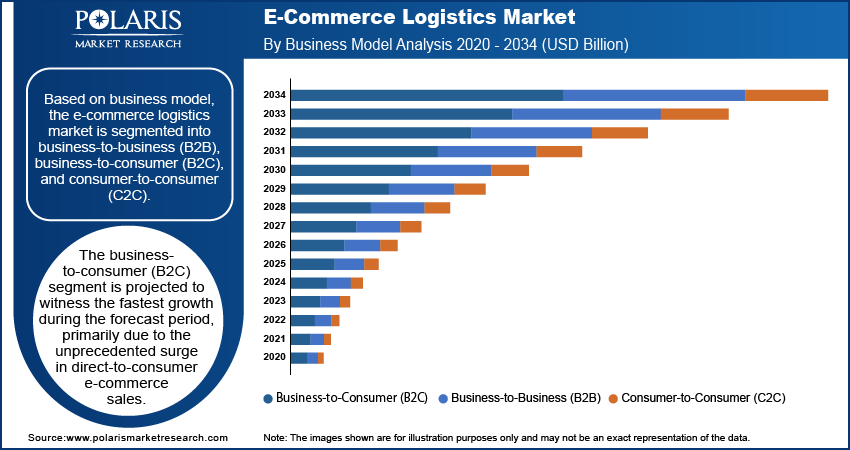
Need Granular Data Across All Market Segments? Request Customization
Regional Analysis
By region, the market report offers e-commerce logistics market insights into North America, Europe, Asia Pacific, Latin America, and the Middle East & Africa. North America e-commerce logistics market growth is driven by the rapid adoption of automated warehouse solutions and the integration of AI into logistics operations. The US leads this growth trajectory, primarily due to its advanced technological infrastructure and the presence of major e-commerce players. The country's investment in smart logistics solutions, including autonomous delivery vehicles and robotics-enabled warehouses, coupled with the growing trend of omnichannel retail, drives its substantial growth in the regional market.
The Asia Pacific dominated the market in 2024 due to high smartphone penetration which has led to increase in utilization of e-commerce platforms, and advanced digital payment infrastructure have contributed to the region's dominance. The dominant position of China is attributed to its massive consumer base, advanced logistics infrastructure, and innovative last-mile delivery solutions, including automated delivery vehicles and delivery drone systems.
Source: Polaris Market Research Analysis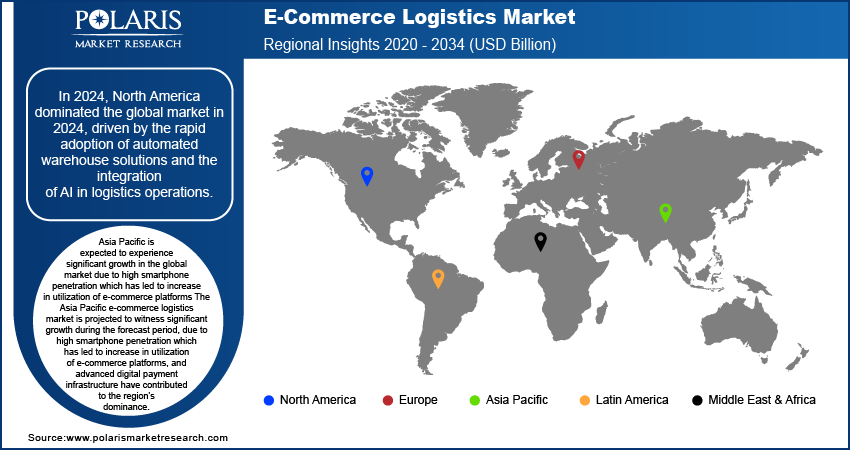
Curious About Regional Market Performance? Request Customization
Key Players and Competitive Landscape
The e-commerce logistics market exhibits a highly competitive landscape where companies compete through technological innovation, service differentiation, and strategic partnerships. Market leaders like Amazon Logistics and DHL eCommerce maintain their dominance through extensive network coverage, proprietary technology platforms, and significant investments in automation and AI. Companies are increasingly focusing on sustainability initiatives and digital transformation to maintain their competitive edge. The market has witnessed a trend of consolidation through mergers and acquisitions, allowing companies to expand their geographical presence and service offerings. Key players are also investing in start-ups and technology companies to enhance their digital capabilities and improve operational efficiency. The competition is further intensified by the entry of regional players and technology-driven logistics start-ups that focus on specific niches within the e-commerce logistics value chain.
DHL eCommerce, a division of Deutsche Post DHL Group, is a engaged in e-commerce logistics, providing a wide range of services for retailers and online businesses. Specializing in end-to-end solutions, the company offers domestic and international parcel delivery, warehousing, and fulfillment services. DHL eCommerce focuses on enhancing the customer experience by utilizing advanced technologies for tracking, order management, and last-mile delivery. The company has its presence in over 220 countries and leverages its global network to support fast and reliable delivery, meeting the growing demand for quicker shipping and seamless logistics operations. In 2024, DHL eCommerce announced the expansion of its e-commerce logistics services in the Asia-Pacific region, focusing on improving delivery times and enhancing customer satisfaction by increasing its fleet and developing regional fulfillment hubs.
Maersk, traditionally global known for its shipping services, has significantly expanded its footprint in e-commerce logistics, offering integrated solutions for online retailers. The company combines its shipping expertise with a suite of logistics services, including warehousing, fulfillment, and last-mile delivery, tailored to the needs of e-commerce businesses. In 2024, Maersk launched a new e-commerce logistics platform designed to provide end-to-end visibility and real-time tracking for retailers, further improving their logistics operations and delivery accuracy.
List of Key Players
- Amazon Logistics
- DHL eCommerce
- FedEx Corporation
- UPS Supply Chain Solutions
- XPO Logistics
- Alibaba Group (Cainiao Network)
- JD Logistics
- SF Express
- Deutsche Post DHL Group
- C.H. Robinson
- DSV Panalpina
- Kuehne + Nagel
- Nippon Express
- GXO Logistics
- Maersk (E-commerce Logistics)
E-Commerce Logistics Industry Developments
December 2024: Flipkart partnered with GreenLine Mobility Solutions to deploy 25 LNG-powered trucks with 110 CBM capacity for eco-friendly logistics. The vehicles will operate on West-to-North India routes, supporting Flipkart's green goals alongside its electric fleet.
March 2024: Ecom Delivery Logistics, a provider of end-to-end logistics solutions for the Indian retail and e-commerce industry, announced the launch of innovative logistics solutions for e-commerce businesses in India.
June 2023: Maersk, a transportation and logistics company, announced to revolutionize e-commerce in India with a ‘One Country, One Price’ fulfillment solution.
August 2021: Maersk, a global logistics company, announced to acquire e-commerce logistics companies in Europe and the US to strengthen its market position.
E-Commerce Logistics Market Segmentation
By Service Type Outlook (Revenue – USD Billion, 2020–2034)
- Transportation
- Warehousing
- Value-Added Services
- Returns Management
- Cross-Border Services
By Operational Mode Outlook (Revenue – USD Billion, 2020–2034)
- Domestic
- International
By Business Model Outlook (Revenue – USD Billion, 2020–2034)
- Business-to-Business (B2B)
- Business-to-Consumer (B2C)
- Consumer-to-Consumer (C2C)
By Regional Outlook (Revenue – USD Billion, 2020–2034)
- North America
- US
- Canada
- Europe
- Germany
- France
- UK
- Italy
- Spain
- Netherlands
- Russia
- Rest of Europe
- Asia Pacific
- China
- Japan
- India
- Malaysia
- South Korea
- Indonesia
- Australia
- Vietnam
- Rest of Asia Pacific
- Middle East & Africa
- Saudi Arabia
- UAE
- Israel
- South Africa
- Rest of Middle East & Africa
- Latin America
- Mexico
- Brazil
- Argentina
- Rest of Latin America
E-Commerce Logistics Market Report Scope
| Report Attributes | Details |
| Market Size Value in 2024 | USD 500.76 billion |
| Market Size Value in 2025 | USD 609.59 billion |
| Revenue Forecast by 2034 | USD 3,721.53 billion |
| CAGR | 22.3% from 2025 to 2034 |
| Base Year | 2024 |
| Historical Data | 2020–2023 |
| Forecast Period | 2025–2034 |
| Quantitative Units | Revenue in USD billion and CAGR from 2025 to 2034 |
| Report Coverage | Revenue Forecast, Market Competitive Landscape, Growth Factors, and Trends |
| Segments Covered |
|
| Regional Scope |
|
| Competitive Landscape |
|
| Report Format |
|
| Customization | Report customization as per your requirements with respect to countries, regions, and segmentation. |
Source: Polaris Market Research Analysis
E-Commerce Logistics Market FAQ's
The global e-commerce logistics market size was valued at USD 500.76 billion in 2024 and is projected to grow to USD 3,721.53 billion by 2034.
The global market is projected to grow at a CAGR of 22.3% from 2025 to 2034.
North America had the largest share of the global market in 2024, driven by the rapid adoption of automated warehouse solutions and the integration of AI into logistics operations.
Some of the key players in the market are Amazon Logistics, DHL eCommerce, FedEx Corporation, UPS Supply Chain Solutions, XPO Logistics, Alibaba Group (Cainiao Network), JD Logistics, SF Express, Deutsche Post DHL Group, C.H. Robinson, DSV Panalpina, Kuehne + Nagel, Nippon Express, GXO Logistics, and Maersk (E-commerce Logistics).
The business-to-consumer (B2C) segment is projected to witness the fastest growth from 2025 to 2034 primarily due to the unprecedented surge in direct-to-consumer e-commerce sales.
Download Sample Report of E-Commerce Logistics Market
Please fill out the form to request a customized copy of the research report.
