
Reports

Electric Traction Motor Market Demand, Share, Industry Report, 2026 - 2034
REPORT DETAILS
REPORT DETAILS
ABOUT THIS REPORT
Market Statistics
What is the Current Market Size?
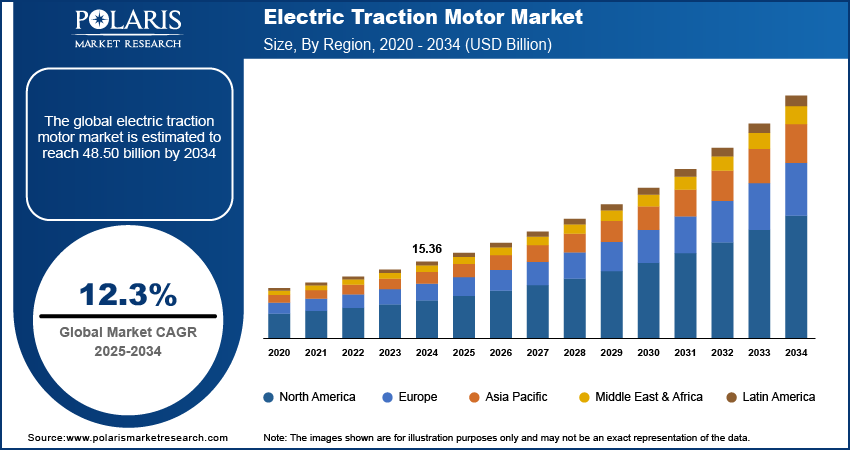
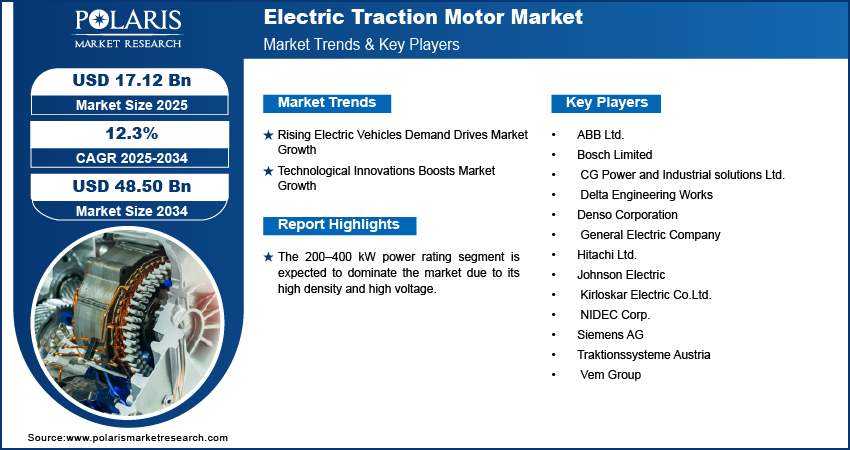
The electric traction motor market size was valued at USD 17.12 billion in 2025. The market is projected to grow from USD 19.11 billion in 2026 to USD 48.50 billion by 2034, exhibiting a CAGR of 12.30% from 2026 to 2034.
Market Statistics
- 2025 Market Size: USD 17.12 billion
- 2034 Projected Market Size: USD 48.50 billion
- CAGR (2026-2034): 12.30%
- Asia Pacific: Largest market in 2025
Electric traction involves powering vehicles by drawing electric power from overhead wires, a third rail, storage batteries, or diesel generators mounted on the vehicles. Electric traction motors are highly efficient and possess high power density to deliver torque to drive the wheels or axles of the vehicle. This high torque and propulsion capability is crucial for heavy vehicles such as trains and trucks. As a result, the extensive use of electric traction motors in automotive applications, including railways and heavy trucks, is significantly driving growth of the electric traction motor market revenue.
To Understand More About this Research: Download Sample Report
The government's substantial investment in railway infrastructure development is leading to an increased demand for electric traction motors. Moreover, railway electrification projects are driving innovation in traction motor development, significantly boosting market revenue. For instance, the Indian government is currently in the process of electrifying 62,119 route kilometers (RKMs), with 47,446 route kilometers (RKMs) expected to be completed by 2024. Consequently, the rapid economic and infrastructural development is fueling the need for efficient electric traction motors and propelling the market growth.
Market Trends and Drivers
Rising Electric Vehicles Demand Drives Market Growth
The rising concern toward environmental safety is driving an increasing demand for eco-friendly, zero-emission vehicles, significantly contributing to the market expansion. Moreover, the rapid growth in prices of petrol and diesel is propelling the demand for EVs in the market. Manufacturers are investing heavily in research & development to improve battery capacity, enabling longer ranges. Furthermore, electric vehicles are designed to be lightweight and require small and efficient motors with instant torque features, which is further driving the demand for electric traction motors in EVs.
For instance, in 2023, global electric car sales reached 14 million units, with significant sales in China, Europe, and the United States. This surge in sales has created a heightened demand for electric vehicle spare parts to facilitate the production of cost-effective and efficient vehicles. Furthermore, the rising number of automotive manufacturers in the region has spurred innovations in the automotive sector. Henceforth, the increasing demand for electric vehicles has specifically amplified the need for electric spare parts that include electric traction motors and is driving market expansion.
Technological Innovations Boosts Market Growth
The electric traction motor market is experiencing significant growth, driven by the adoption of advanced technology such as advanced motor control algorithms. Technological innovations enhance the functioning of the vehicles, such as smoother operation, quick acceleration, and others. Additionally, advancements in power electronics components such as inverters and converters contribute to higher density, fast switching speeds, and increased efficiency. The technological innovations reduce energy loss during power conversion, which extends the range of the vehicle. Moreover, the use of AI in electric traction motors, such as predictive analysis, helps detect faults and reduce damage to the machines. Furthermore, condition monitoring uses machine learning algorithms to detect slight changes in motor behavior by continuously monitoring temperature, vibration, and power consumption.
The use of artificial intelligence and machine learning in electric traction enhances control over motor speed, torque, and efficiency of vehicles, significantly boosting market revenue.
Strategic Investment & M&A (Electric Traction Motor)
| Company (traction‑motor related) | Type (M&A / strategic investment / JV) | Description |
| Siemens (Mobility & Drives) | Capacity & portfolio investment (organic) | Siemens disclosures on its mobility business describe localization and expansion of traction component manufacturing (including propulsion motors and inverters) for electric locomotives and rail vehicles, e.g., traction components produced in its Nasik factory and new locomotive electrification projects. |
| Nidec (e‑axle / traction motors) | JV / acquisition program around e‑drive & machine tools | Nidec’s corporate information outlines its strategy to grow automotive traction motor business via joint ventures and acquisitions, including an earlier JV with Groupe PSA for automotive electric traction motors and acquisition of machine tool businesses used to manufacture e‑drive components. |
| ZF Group (e‑Mobility) | Strategic portfolio investment & partnerships | ZF press material describes the launch of its Commercial Vehicle Solutions division and the eWorX electrified power‑take‑off system, which is designed to work alongside electric axle drives and central drives on electric trucks. |
| ZF with Mercedes‑Benz Trucks, Palfinger, Meiller | Strategic collaboration (application‑level investment) | ZF announces collaboration with Mercedes‑Benz Trucks and body manufacturers Palfinger and Meiller to demonstrate electric trucks equipped with ZF’s eWorX system, powered from the vehicle’s traction battery rather than mechanically from the traction motor. |
| Hitachi / Hitachi Energy (rail & EV solutions) | Product & technology investment | Hitachi Energy communications highlight launches of high‑performance power semiconductor modules and traction products for electric mobility and rail, positioning the company as a key technology provider for electric vehicles and trains. |
Segment Insights
Breakdown by Product Type Insights
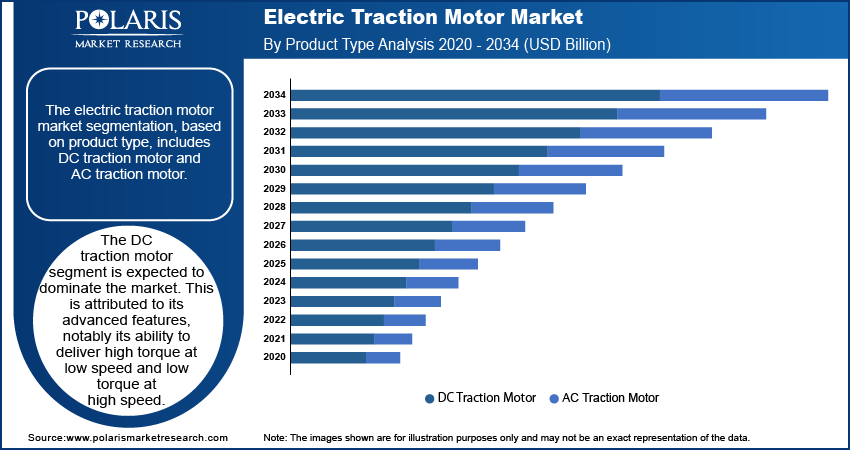
The electric traction motor market segmentation, based on product type, includes DC traction motor and AC traction motor. The DC traction motor segment is expected to dominate the market. This is attributed to its advanced features, notably its ability to deliver high torque at low speed and low torque at high speed. Additionally, the cost-effectiveness and low maintenance requirements of DC motors contribute to their positive impact on market revenue. These motors are commonly employed in locomotives such as trains, providing efficient speed control and rapid braking.
Moreover, the widespread utilization of DC motors in diverse applications such as fabrication and production units, elevators, vacuums, and warehouse sorting equipment are a significant driver of market growth.
Breakdown by Power Ratings Insights
The electric traction motor market segmentation, based on power ratings, includes below 200 kW, 200–400 kW, and above 400 kW. The 200–400 kW power rating segment is expected to dominate the market due to its high density and high voltage. The 200–400 kW electric traction motors are designed to tolerate heavy shock loads and vibrations to enhance the functioning of operations.
Further, the 200–400 kW power rating is widely used in high-speed vehicles and machinery such as bullet trains, metros, and others. Moreover, the growing railway sector are increasing the demand for efficient and cost-effective electric traction motors, significantly driving the market growth.
Regional Insights
By region, the study provides market insights into North America, Europe, Asia Pacific, Latin America, and the Middle East & Asia. Asia Pacific is anticipated to dominate the electric traction motor market due to the rise in demand for transportation connectivity that includes railways, cars and others. In addition, the presence of major companies such as Mitsubishi, Toshiba Corp., and others offering their services strengthens the market landscape in the region. The key market players are merging, acquiring, and collaborating to strengthen their market presence and to serve better offerings in the Asia Pacific, further driving the market during the forecast period.
China's electric traction market holds the largest share in the Asia Pacific region due to the growing number of manufacturing industries. Manufacturers are investing heavily in R&D to develop electric modes of transport to promote sustainable development in the country. In addition, the presence of the largest railway network in China is driving the market growth. The surge in the automotive industry is also increasing demand for electric traction motors. China is rapidly adopting technological advancements across various sectors, leading to innovations in automobiles, railways, industrial appliances, and more. For instance, electric vehicle sales in China reached 407.8 thousand in January 2023, significantly increasing the demand for electric traction motors.
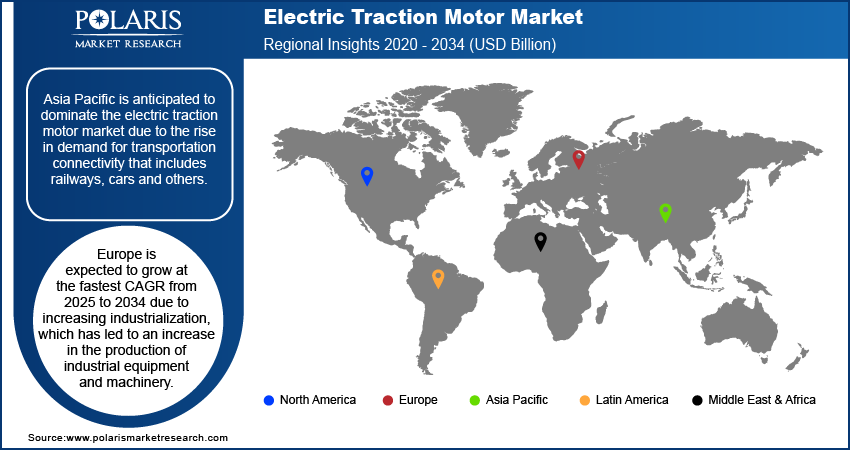
Europe is expected to grow at the fastest CAGR from 2026 to 2034 due to increasing industrialization, which has led to an increase in the production of industrial equipment and machinery. Moreover, the rise in environmental issues, such as climate change and an increase in carbon levels, are significantly contributing to the development of electric vehicles and other equipment. The government has strengthened the measures to promote eco-friendly and sustainable products and services to reduce the release of carbon emissions. Therefore, the growing production of electric appliances, vehicles and others is raising the demand for high-powered traction motors, boosting market revenue.
Key Players & Competitive Insights
Leading market players are investing heavily in research and development in order to expand their product lines, which will help the electric traction motor market grow even more. Market participants are also undertaking a variety of strategic activities to expand their global footprint, with important market developments including new product launches, contractual agreements, mergers and acquisitions, higher investments, and collaboration with other organizations. To expand and survive in a more competitive and rising market climate, the electric traction motor market must offer cost-effective items.
Manufacturing locally to minimize operational costs is one of the key business tactics used by manufacturers in the electric traction motor market to benefit clients and increase the market sector. In recent years, the market has offered some technological advancements. Major players in the electric traction motor market include ABB Ltd.; CG Power and Industrial Solutions Ltd.; Hitachi Ltd.; General Electric Company; Kirloskar Electric Co. Ltd.; Bosch; Johnson Electric; Siemens AG; NIDEC Corp.; Traktionssysteme Austria; Vem Group; and Delta Engineering Works.
CG Power and Industrial Solutions Ltd., headquartered in India, is a leading engineering corporation of power and industrial equipment and solutions. The company offers its services across various sectors, such as railways, powerhouses, and manufacturing industries. The product ranges from Low and medium-voltage motors, fractional horsepower motors, DC motors, laminations for motors, drives, power and distribution transformers, switchgear, circuit breakers, and others.
Bosch Ltd, headquartered in Germany, is a leading supplier of technology and services. The company’s operations are divided into four sectors: Mobility Solutions, Industrial Technology, Consumer Goods, and Energy and Building Technology. Moreover, the company encompasses a wide range of products that include automotive spare parts, power tools for industrial professionals, and others. Different variants of traction motors, such as Motor 550 Watts, Motor 740 Watts, and others, are manufactured by the company. Furthermore, Bosch also has a significant presence in India, where it operates one of its largest development centers.
List of Key Companies
- ABB Ltd.
- Bosch Limited
- CG Power and Industrial solutions Ltd.
- Delta Engineering Works
- Denso Corporation
- General Electric Company
- Hitachi Ltd.
- Johnson Electric
- Kirloskar Electric Co.Ltd.
- NIDEC Corp.
- Siemens AG
- Traktionssysteme Austria
- Vem Group
Electric Traction Motor Industry Developments
- June 2025: Siemens Mobility landed an order for 50 Vectron Dual Mode locomotives from Akiem, including an option for 40 additional units, highlighting cleaner rail traction with 2.4 MW electric operating capability.
- June 2024: Hitachi received an order for 173 elevators and escalators from Torch Tower (Building) in Japan. This is one of the largest orders received by Hitachi.
- May 2024: ABB Ltd. signed an agreement to acquire Siemens’ Wiring Accessories business in China. The acquisition aims to expand their distribution and widen market reach across regions in China.
- March 2024: ABB Ltd, a Switzerland-based manufacturer, finalized a USD 150 million agreement with Hyundai Rotem Company to deliver traction systems, including traction motors, for 65 trains being built for Queensland, Australia.
- December 2023: Hitachi Rails acquired Thales’ Ground Transportation to expand its global presence across 51 countries.
Electric Traction Motor Market Segmentation
By Product Type Outlook
- DC Traction Motor
- AC Traction Motor
By Application Outlook
- Railways
- Electric Vehicles
- Conveyors
- Industrial Machinery
By Power Ratings Outlook
- Below 200 KW
- 200–400 KW
- Above 400 kW
By Regional Outlook
- North America
- US
- Canada
- Europe
- Germany
- France
- UK
- Italy
- Spain
- Netherlands
- Russia
- Rest of Europe
- Asia Pacific
- China
- Japan
- India
- Malaysia
- South Korea
- Indonesia
- Australia
- Vietnam
- Rest of Asia Pacific
- Middle East & Africa
- Saudi Arabia
- UAE
- Israel
- South Africa
- Rest of the Middle East & Africa
- Latin America
- Mexico
- Brazil
- Argentina
- Rest of Latin America
Electric Traction Motor Report Scope
| Report Attributes | Details |
| Market Size Value in 2025 | USD 17.12 billion |
| Market Size Value in 2026 | USD 19.11 billion |
| Revenue Forecast in 2034 | USD 48.50 billion |
| CAGR | 12.30% from 2026 to 2034 |
| Base Year | 2025 |
| Historical Data | 2021-2024 |
| Forecast Period | 2026–2034 |
| Quantitative Units | Revenue in USD billion and CAGR from 2026 to 2034 |
| Report Coverage | Revenue Forecast, Market Competitive Landscape, Growth Factors, and Trends |
| Segments Covered |
|
| Regional Scope |
|
| Competitive Landscape |
|
| Report Format |
|
| Customization | Report customization as per your requirements with respect to countries, regions, and segmentation. |
FAQ's
The electric traction motor market size was valued at USD 17.12 billion in 2025 and is expected to reach up to USD 48.50 billion in 2034.
The market is projected to grow at a CAGR of 12.30% from 2026 to 2034.
North America had the largest share of the market.
The key players in the market are ABB Ltd.; CG Power and Industrial Solutions Ltd.; Hitchi Ltd.; General Electric Company; Kirloskar Electric Co. Ltd.; Bosch; Johnson Electric; Siemens AG; NIDEC Corp.; Traktionssysteme Austria; Vem Group; and Delta Engineering Works.
The DC traction motor segment dominated the market in 2025.
The railway segment had the largest share of the market.
Download Sample Report of Electric Traction Motor Market
Please fill out the form to request a customized copy of the research report.
