

What is Energy Engineering Service Outsourcing Market Size?
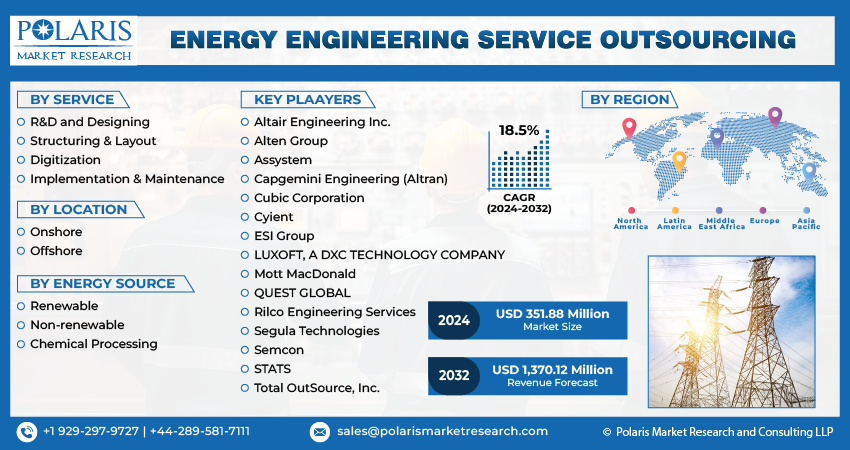
The Energy Engineering Service Outsourcing Market is expected to be worth USD 54.23 billion in 2025 and expand at a CAGR of 8.8% from 2026 to 2034. Market expansion is fueled by energy transition initiatives, cost optimization pressures, and rising infrastructure modernization projects.
Market Statistics
- 2025 Market Size: USD 54.23 Billion
- 2034 Projected Market Size: USD 116.15 Billion
- CAGR (2026-2034): 8.8%
- Largest Market: Asia Pacific
The increasing digitization within the energy sector is poised to contribute positively to market growth in the foreseeable future. Numerous Engineering Service Providers (ESPs) have introduced innovative technologies for various applications, including smart grid management, plant digitization, embedded product engineering, and virtual prototyping. These technological advancements are anticipated to play a crucial role in driving the digital transformation of the energy sector, enhancing the global impact of energy ESPs. Additionally, outsourcing services to engineering service providers offer Original Equipment Manufacturers (OEMs) the potential to reduce labor costs and other associated investment expenses significantly.
 Market.png)
To Understand More About this Research: Download Sample Report
Moreover, energy engineering service providers must engage in competitive pricing and showcase their domain expertise to be advantageous for energy-producing companies. ESPs prioritize offering services that tackle the challenges prevalent in the energy sector. For example, addressing power fluctuations, a significant concern in connecting wind farms to the power network, ESI Group provides virtual testing technology for windmill operations. Likewise, Altair Engineering, delivers IoT-based digital transformation services tailored for the energy outsourcing industry.
In recent years, the global slowdown caused by the COVID-19 pandemic has been unprecedented. This downturn has had a notable impact on the energy sector, leading to delays in the construction of new infrastructure and facilities primarily due to issues with the delivery of equipment. China, being one of the earliest countries affected by the pandemic, is a major producer of various types of clean energy equipment, including wind turbines and solar panels. The pandemic adversely affected the timely delivery and installation of energy-related equipment for companies in the renewable energy sector, leading to a decrease in demand for the services of engineering service providers.
Nonetheless, factors such as Intellectual Property (IP) concerns and security threats pose significant constraints to market growth. OEMs and service providers frequently share sensitive data related to project specifications, technologies, and equipment performance to facilitate collaboration in development, design, and support. Consequently, effective management of Intellectual Property and addressing data security issues have become increasingly paramount for businesses engaging in outsourcing services.
Industry Dynamics
Growth Drivers
Technological Advancements
Engineering service providers demonstrate the capability to implement effective strategies and complete projects efficiently, leveraging readily available teams of skilled and trained engineers. This proficiency is anticipated to attract the interest of end-use industries throughout the forecast period. Moreover, outsourcing firms capitalize on advanced engineering tools and technologies to cater to their clients, contributing to further energy engineering service outsourcing (ESO) market growth. Collaborating with service providers to expedite Research and Development (R&D) activities has become a commonplace practice in the energy sector.
Key ESO Trends
|
Trend |
Description |
Key Drivers |
Examples from Practice |
|
Outsourcing plant utilities |
Facilities delegate ongoing DBOOM (design, build, own, operate, maintain) for discrete systems like compressed air, steam, boilers, refrigeration to vendors on renewable contracts. |
Scarce internal capital/labor for non-core assets; need for reliability over production disruptions. |
CEMEX "Air over the Fence" with Kaeser: vendor owns/maintains compressors, achieving 23-64% kWh savings across plants. |
|
Vendor-provided capital |
Vendors supply new/upgraded equipment, recover costs via service fees; host avoids CapEx. |
End-of-life assets, capital scarcity; preference for OpEx models. |
McCormick & Company outsources chilled water to Constellation: 75% electricity reduction, $1M utility rebate. |
|
Reliability and performance focus |
Contracts guarantee service levels (e.g., CFM air, steam pressure) with penalties/SLAs. |
Production downtime costs exceed energy savings; regulatory compliance needs. |
Ocean Spray powerhouse (steam/refrigeration) to Armstrong: exceeded $500K annual savings, boosted productivity. |
|
Segmented vs. full-system |
Preference for partial outsourcing (e.g., one compressor group) before total system handoff. |
Risk mitigation; builds vendor trust gradually. |
High-utilization assets (>90% load) prioritized for steady value creation. |
|
Greenfield/new builds |
Outsourcing from construction phase relieves overruns, optimizes commissioning. |
New facilities lack tuned energy systems; vendor expertise accelerates ramp-up. |
Vendor-led design/ops in Ireland's economic development model. |
Report Segmentation
The market is primarily segmented based on service, location, energy source, and region.
|
By Service |
By Location |
By Energy Source |
By Region |
|
|
|
|
To Understand the Scope of this Report: Request Customization
By Service Analysis
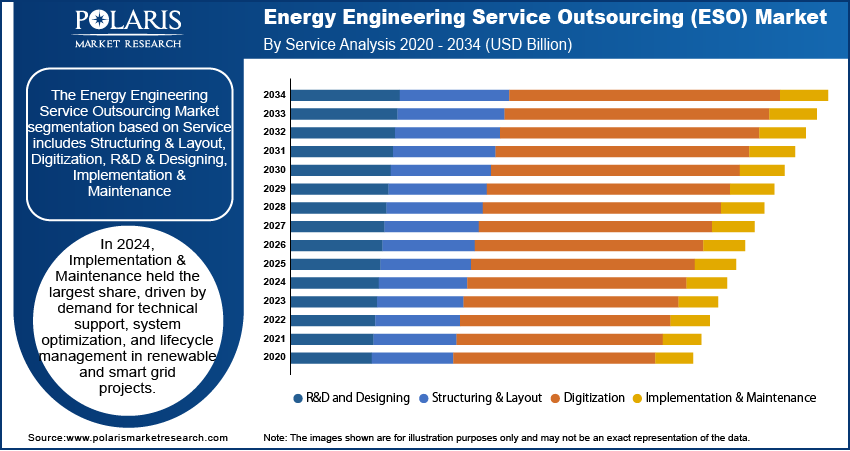
Structuring & layout segment held the largest share in 2025
The structuring segment held the largest share. This growth is a result of increasing concerns regarding the operational efficiency of energy plants. It encompasses activities such as construction & equipment procurement. ESO providers play a crucial role in delivering these services for significant infrastructure projects, spanning various sectors such as oil and gas, hydroelectric, mining, solar, & wind plants. This is anticipated to be a key driver for the growth of this segment throughout the forecast period.
Implementation and maintenance services encompass post-construction activities, including equipment diagnostics, maintenance, operational support, and upgrade services. Engineering service providers extend implementation and maintenance services to OEMs to address operational issues or accommodate changes in project requirements. The availability of these services is increasingly becoming a crucial distinguishing factor among engineering service providers. Consequently, ESPs are placing a significant emphasis on delivering continuous support services to OEMs.
The digitization segment is projected to grow at the fastest rate. In their pursuit of enhancing energy efficiency and cutting operational costs, organizations and industries are increasingly adopting digital solutions to optimize energy consumption. Digitization facilitates real-time monitoring, data analytics, and advanced control mechanisms, enabling the identification of energy waste, inefficiencies, and opportunities for optimization.
By Energy Source Analysis
Non-renewable segment registered the largest market share in 2025
The non-renewable segment accounted for the largest share. Fossil fuels, which include natural gas, coal, and petroleum, primarily constitute most non-renewable energy sources. Over the forecast period, the production of natural gas is anticipated to outpace other fossil fuels. This trend is attributed to the abundant availability of natural gas resources, encompassing shale gas, tight gas, and coalbed methane.
The renewable energy source segment witnessed a substantial growth rate. This can be attributed to the increasing awareness and concerns regarding environmental protection. As the global economy grows and rapid industrialization continues, there will be a substantial increase in the demand for energy in the coming years. Amid the challenges of meeting this rising energy demand and mitigating greenhouse gas emissions, the importance of cleaner energy sources for environmental protection has become paramount. Consequently, there is a notable rise in the demand for renewable energy sources.
By Location Analysis
On-shore segment held the significant market revenue share in 2025
The onshore segment held the largest share. OEMs prefer onshore outsourcing services due to considerations related to information security and privacy. Onshore services encompass the offerings delivered to an OEM by an Engineering Service Outsourcing (ESO) vendor operating within its home country. Factors such as language, communication, and working within the same time zone are anticipated to be significant contributors to the continued dominance of the onshore segment throughout the forecast period.
The offshore segment will grow at a rapid pace. Offshore engineering services pertain to the services provided by the ESPs located in international locations. One of the primary drivers for offshore outsourcing is its cost-effectiveness. Additionally, companies extending beyond the conventional practice of outsourcing non-core functions are increasingly inclined to transition core processes offshore. This shift is anticipated to be another significant factor driving the growth of the offshore segment over the forecast period.
Regional Insights
APAC held the largest share of the global market in 2025
APAC dominated the market. The presence of favorable government regulations in countries, along with a skilled talent pool and cost-effective labor, renders these nations conducive to outsourcing activities. Additionally, the region's growing investments in clean energy sources are anticipated to be a significant driver for the expansion of the market.
North America is projected to grow at a rapid pace. The escalating investments in renewable energy sources primarily propel the region's growth. Based on data from the U.S. Energy Information Administration (EIA), electricity production from clean sources increased to 20% in 2020, up from 17% in 2019. Additionally, the region's early adoption of advanced technologies in the energy sector is poised to be a significant driver for the region's growth.

Key Market Players & Competitive Insights
In recent years, ESPs have transformed, transitioning from delivering ESO services solely from their headquarters to establishing crucial operations and excellence centers in developing countries. Most prominent ESPs offer a spectrum of services, including embedded product engineering, mechanical designs, plant layout designs, and digital manufacturing solutions. These companies primarily function as engineering, procurement, and construction management entities with a widespread global presence.
For instance, in April 2022, the British government unveiled its intentions to create a system operator in the region, National Grid. This initiative is designed to assist the country in reaching its zero emissions target by 2050.
Some of the major players operating in the global market include:
- Altair Engineering Inc.
- Alten Group
- Assystem
- Capgemini Engineering (Altran)
- Cubic Corporation
- Cyient
- ESI Group
- LUXOFT, A DXC TECHNOLOGY COMPANY
- Mott MacDonald
- QUEST GLOBAL
- Rilco Engineering Services
- Segula Technologies
- Semcon
- STATS
- Total OutSource, Inc.
Recent Developments
- In July 2025 – Vedanta awards INR 865 crore integrated service contract to Asian Energy Services Ltd. (AESL)
- In February 2023, SolarEdge Technologies introduced its first "battery virtual power plant" created to assist the National Grid ESO Demand Flexibility Service (DFS) in the United Kingdom.
Energy ESO Market Report Scope
|
Report Attributes |
Details |
|
Market size in 2025 |
USD 54.23 billion |
| Market size in 2026 | USD 58.92 billion |
|
Revenue forecast in 2034 |
USD 116.15 billion |
|
CAGR |
8.8% from 2026 – 2034 |
|
Base year |
2025 |
|
Historical data |
2021 – 2024 |
|
Forecast period |
2026 – 2034 |
|
Quantitative units |
Revenue in USD billion and CAGR from 2026 to 2034 |
|
Segments covered |
By Service, By Location, Energy Source, By Region |
|
Regional scope |
North America, Europe, Asia Pacific, Latin America, Middle East & Africa |
|
Customization |
Report customization as per your requirements with respect to countries, region, and segmentation. |
FAQ's
Altair Engineering, Alten Group, Assystem, Capgemini Engineering are the key companies in Energy Engineering Service Outsourcing (ESO) Market.
The global energy ESO market is expected to grow at a CAGR of 8.8% during the forecast period.
Service, location, energy source, and region are the key segments covered.
Technological Advancements are the key driving factors in Energy Engineering Service Outsourcing (ESO) Market.
The global energy engineering service outsourcing (ESO) market size is expected to reach USD 116.15 billion by 2034
Page last updated on:
Jan-2024
Research Methodology
A robust system of research, verification, and forecasting designed to ensure reliable and actionable market insights.
Polaris Market Research uses a clear and structured approach to deliver insights that clients can rely on. The process combines detailed primary and secondary research, including direct communication with industry experts. The detailed information helps build a complete picture of market trends and developments. Secondary data is gathered from credible sources such as industry reports, company filings, government source links, and trusted organization databases. It is then cross-checked through discussions with key stakeholders across the value chain. Market size and forecasts are developed using both bottom-up and top-down methods to ensure accuracy and consistency in the final results.

1. Project Setup
Step 1 & 2:
- We start every project by clearly understanding the client’s objective or goal, then defining the market scope, and aligning regions, segments, and timelines.
- Once the foundation is set, we collect data from all-around of sources, including company reports, government databases, and paid industry platforms.
- Our research is based on secondary data, which helps us build a strong understanding of the market across regions and industries. Then we validate this information through primary research by speaking directly with industry experts, companies, and stakeholders.
- By combining secondary and primary research, we ensure that our market insights are accurate, practical, and closely aligned with real market conditions.
2. Data Collection
We gather information from both public and verified sources:

3. Data Structuring
Step 3:
- All collected data is organized into a consistent format to ensure accurate analysis. Since inputs come from multiple sources, they are standardized and aligned before use.
- The data is segmented by product, application, and region, and mapped across a defined historical period (2020–2024). All values are converted into common units (USD Mn/Bn), and volume and pricing are aligned where required to estimate revenue.
- Any overlaps or inconsistencies are reviewed and adjusted to maintain accuracy (<5% variance threshold).
- The result is a structured dataset that allows for clear comparison across regions and supports reliable analysis and forecasting.
Structured Market Dataset, USD Mn/Bn

4. Data Structuring
Step 4: TOP-DOWN APPROACH
- We start with the overall market size at a global or macro level.
- The market is then narrowed down based on scope and industry relevance.
- We apply penetration rates and split the data by region and segment.
- This helps us estimate the market size for specific segments.
- The numbers are validated through cross-checks to ensure accuracy.

Step 5: BOTTOM-UP APPROACH
- We begin by analyzing data from leading companies in the market.
- Revenue data is collected and mapped across different segments.
- The data is then aggregated to estimate the total market size.
- To fill in any gaps, adjustments are made based on industry standards.
- Validation checks make sure that the results are correct.

5. Data Structuring
Step 6:
At Polaris Market Research, we employ a methodical forecasting strategy. This approach blends the analysis of historical data with real-time market validation. To forecast future trends with precision, we examine past patterns, pricing fluctuations, and the interplay of supply and demand. To ensure our conclusions reflect the present market landscape, we actively seek input from industry experts and key stakeholders.
To refine our predictions, we carefully consider critical elements such as market drivers and restraints, fluctuations in raw material costs, emerging technologies, and the production capabilities of various regions. Furthermore, we assess regulatory frameworks and potential policy shifts to gauge their potential impact on market expansion.
All this information is synthesized to generate precise forecasts for each segment and region. These forecasts illuminate the current state of the market and highlight forthcoming opportunities.

6. Data Structuring
Step 7:
In the final stage, we validate all our estimates using a triangulation method, where data is cross-checked from multiple reliable sources, like company data, primary interviews, and secondary research. This helps us make sure that our numbers are correct and fit with the rest of the market.
This process involves verifying data consistency across various segments and geographic areas. It also requires comparing historical trends with the assumptions support the forecast. Any discrepancies involve adjustments to ensure everything remains aligned and dependable.
Once the data is finalized, we prepare the final outputs, including market size estimates, segment-wise breakdowns, and growth metrics. These are delivered in structured formats such as tables, charts, and data files for easy analysis and use.
We collaborate closely with clients, ensuring the final products align with their requirements. This includes offering tailored adjustments, supplementary data analyses, and continuous assistance. Furthermore, we monitor market trends post-delivery, providing updates and refinements to maintain the insights' relevance as time passes.
Post-delivery, we continue to monitor market shifts, offering updates and adjustments to ensure the insights remain relevant over time.
Validation
Triangulation Framework
Estimates are cross-verified across three sources:
Company-level data
• Primary inputs from industry participants
• Secondary benchmarks and published data
Variance maintained within +5-10%
Adjustments applied to align estimates
Segment values validated against overall market structure
Quality Check
Data Consistency & Integrity
Segment totals validated to 100%
Regional estimates aligned with global market size
Historical trends compared against forecast outputs
Assumptions reviewed for cross-segment and regional alignment
Output & Delivery
Final Outputs
Market size estimates (USD Mn/Bn)
Segment-wise distribution (%)
Growth metrics (CAGR %)
Final Outputs
Structured tables and charts
Segment-level datasets
Excel-based data files for further analysis
Client Alignment & Support
- Deliverables are aligned with defined client requirements and scope
- Custom data cuts and segment splits are incorporated as required
- Post-delivery queries are addressed through analyst interactions
- Additional clarifications and data support are provided upon request
Client Continuity & Updates
- Market developments are tracked post-delivery to capture changes in key trends
- Updated data and revisions are provided based on new market inputs
- Additional refinements and data cuts are shared as required
- Continued analyst engagement supports evolving client requirements
