

Market Overview
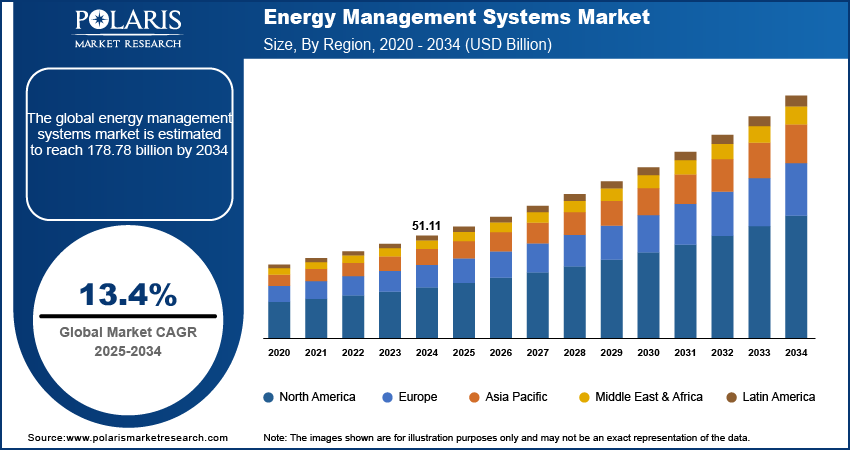
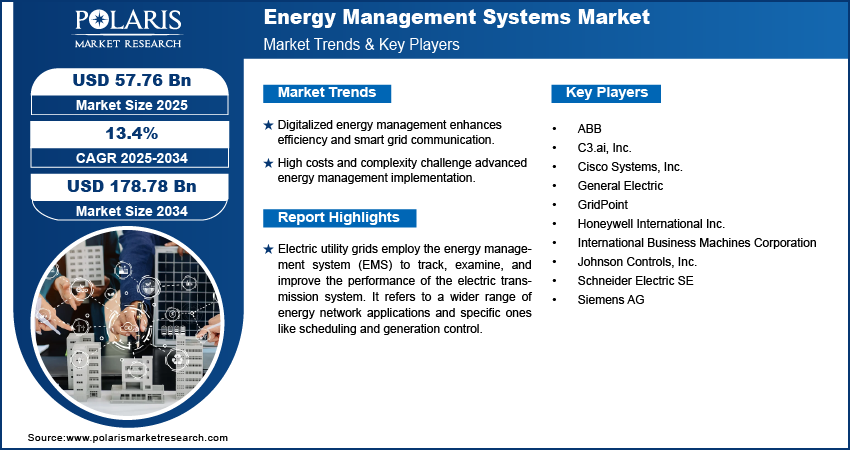
The global energy management systems market was valued at USD 59.41 billion in 2025 and is expected to grow at a CAGR of 13.53% during the forecast period. Key factors driving the market include price escalation and fluctuations in energy consumption, smart grid and meter installations, growing demand for digital energy management platforms, and the transformation of various industrial and commercial operations.
Energy management systems are fully integrated digital platforms. These systems integrate hardware, software, and advanced analytics. They enable efficient tracking and management of energy consumption. Industrial energy management systems also help firms comply with sustainability and other environmental laws. Energy management systems are widely used in industrial plants, utility firms, and smart infrastructure.
Key Insights
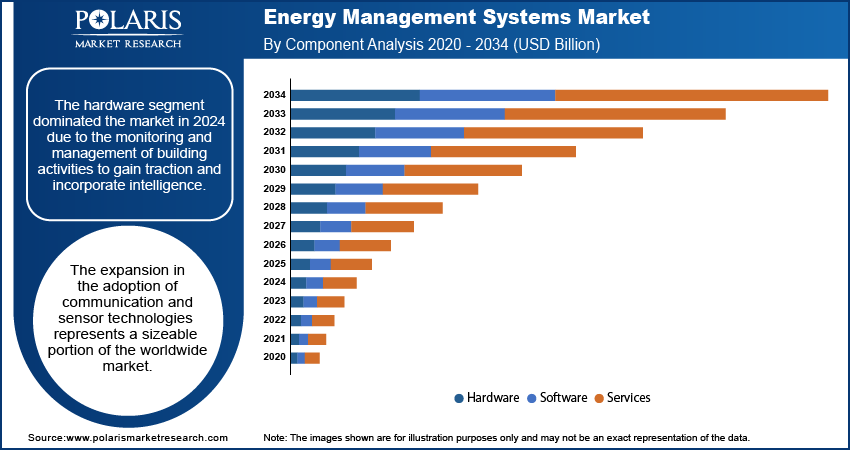
- In 2025, the hardware segment dominated the energy management systems market. This is due to the monitoring and management of building activities to incorporate intelligence. The large market share of the hardware segment indicates that smart sensors, meters, and controllers play an important role in gathering energy information. This information is essential for carrying out analytics and optimization.
- The cloud segment accounted for the largest share of the market in 2025, driven by the need to decrease carbon emissions and lower costs. Cloud-based energy management solutions enable distant energy management. Cloud-based solutions can also be implemented more quickly.
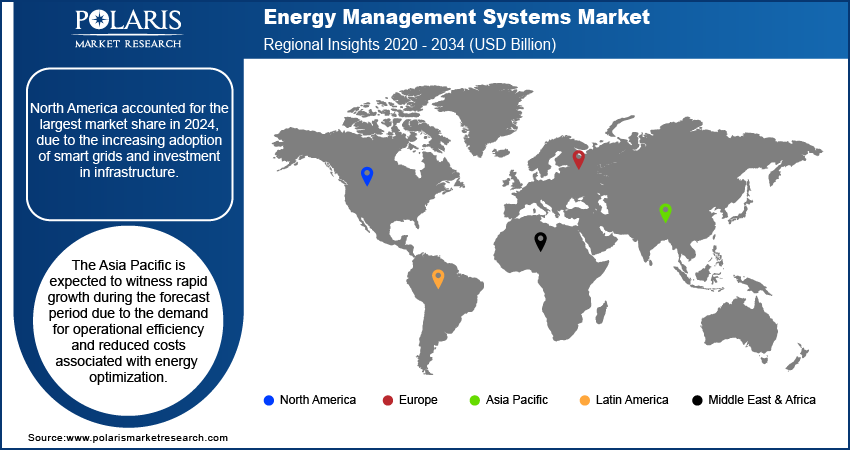
- North America held the largest market share in 2025 due to the rising adoption of smart grids in the region.
- The Asia Pacific market is expected to grow at a fast rate during the forecast period, owing to the need for operational efficiency and low operational expenses.
Industry Dynamics
- Digital energy management integrates IoT-enabled devices, cloud platforms, and analytics engines. This allows organizations to move from rom a reactive monitoring process to proactive management.
- A rise in energy prices creates an opportunity as EMS provides data and automation needed to reduce consumption and costs.
- The installation of smart grids and meters provides the necessary energy data and network to control EMS, which is required to analyze consumption, and also contributes to energy management systems market opportunities.
- High upfront costs and the complexity of interconnections present SME EMS adoption barriers, as these enterprises cannot invest in such large projects.
Market Statistics
- 2025 Market Size: USD 59.41 billion
- 2034 Projected Market Size: USD 158.66 billion
- CAGR (2026-2034): 13.53%
- Largest market in 2025: North America
AI Impact on Energy Management Systems Market
- AI-powered energy management systems use machine learning algorithms to analyze consumption patterns, forecast demand, and automate energy use decisions at the building, factory, and grid levels.
- Reduction in waste and operational costs is expected through automatic adjustment of energy use in buildings and factories to improve efficiency.
- AI-powered predictive maintenance enables utilities and industrial operators to detect equipment degradation early, which minimizes downtime, maintenance costs, and operational risks.
- Integrating renewable sources and managing grid load to prevent outages is expected to be balanced by real-time energy supply and demand.
Electric utility grids use an energy management system (EMS) to monitor, analyze, and improve the performance of the electric transmission system. It refers to a wider range of energy network applications, including specific ones such as scheduling and generation control. The system uses a real-time data operating system to increase power efficiency. It is extensively utilized in the energy, telecom, and IT sectors, among other industries.
The transformation of different industrial and commercial operations, as well as energy management, has been greatly aided by digitalization. The emphasis on modernizing energy models is rising as their efficiency improves. The ability to link and coordinate all the network's equipment and devices, enabled by digitized energy management procedures, results in greater efficiency gains. A building's digital connection may enable communication with smart power networks.
Globally, demand for energy management systems is growing. Many small and medium-sized businesses are still unaware of the benefits of energy management. This aspect is impeding the overall energy management systems market expansion. Large businesses are adopting advanced EMS due to their sophisticated infrastructure. However, adoption across small and medium-sized enterprises is constrained by high setup and implementation costs.
Industry Dynamics
Growth Drivers
Global concern has grown about the steadily declining energy intensity of traditional fuels, such as coal. Worldwide, governments have committed resources to create a fair, secure, and sustainable energy system. Additionally, rapid industrialization, which increases energy consumption, drives governments in many nations to establish effective energy management systems. Regular changes in energy prices and supplier rivalry are pressuring governments to increase their investments in renewable energy.
Improved efficiencies through support for smart infrastructure initiatives, which involve upgrading the energy and utility sectors, also contribute to expansion opportunities. The rise in investments for smart projects, such as smart buildings and smart farms, generates a substantial need for refined energy management. The implementation of smart grids and smart meters is expanding, which is further creating growth opportunities.
The adoption of smart grids is rising. This is due to lower costs, greater cost-effectiveness, and improved fraud detection, among other factors. Utility bill optimization is another one of these features. Furthermore, data collection, analysis, and insight-gathering tools are integrated into smart grids and meters, enabling the extraction of valuable information. Thus, technologically upgraded smart grids and smart energy meters are expected to aid market development.
Share of Energy Demand Growth by Source, 2024
|
Source |
Share (%) |
|
Renewables |
38 |
|
Natural Gas |
28 |
|
Oil |
11 |
|
Coal |
15 |
|
Nuclear |
8 |
(Source: Global Energy Review 2025, IEA)
What is the Impact of Regulatory Landscape on the Energy Management Systems Market?
International standards and national mandates promoting energy efficiency, sustainability, and carbon reduction shape the regulatory landscape for the EMS industry. ISO 50001 serves as the global framework. Regional regulations, including the U.S. DOE’s 50001, the Energy Efficiency Directive (EU), and the PAT scheme (India) Ready program, mandate structured energy management practices. These frameworks have increased demand for compliance-ready energy management software with audit and reporting capabilities. Countries, such as China and the UK, have introduced aligned standards and compliance programs. They reinforce EMS adoption across industries. Such policies drive organizations toward digitalized, data-driven EMS solutions. It supports real-time monitoring, reporting, and certification. The imposition of regulatory standards is accelerating the global transition toward sustainable energy operations. Market players are focusing on complying with these norms to stay ahead in the competition and expand their businesses.
|
Region |
Regulation/Standard |
Description |
Impact on Market/Vendors |
|
International (global) |
ISO 50001 (EnMS) |
International standard for Energy Management Systems — a framework for integrating energy management. It helps improve energy performance and enhance environmental management. |
Possible but not obligatory. Some organizations implement the standard solely to gain its benefits. Others decide to get certified to show external parties that they have implemented an EMS. ISO does not perform certification. |
|
European Union |
Energy Efficiency Directive (EED) & Energy Performance of Buildings Directive (EPBD) |
EED sets binding measures and targets to reduce energy consumption across EU states.
EPBD requires building energy performance improvements, renovation strategies, and minimum standards. (EED revised 2018 and 2023). |
Strong demand driver for EMS (building monitoring, reporting, and renovation tracking). Compliance requirements encourage data reporting capabilities and integrated EMS+BMS solutions |
|
UK |
ESOS (Energy Savings Opportunity Scheme) |
Mandatory energy audits for large organizations every four years. |
ESOS creates a recurring audit/reporting market for EMS providers |
|
U.S.(Federal) |
DOE programs: 50001 Ready, Superior Energy Performance (SEP) |
DOE supports ISO 50001 implementation (50001 Ready) and performance certification programs (SEP) for the manufacturing and commercial sectors. |
Encourages ISO-aligned EMS adoption
Government incentives, procurement preferences, and industrial programs increase market for certified EMS implementations and energy-performance analytics. |
|
China |
GB/T 23331-2020 (Energy Management Systems, aligned with ISO 50001) |
National standard updated 2020 to adhere to ISO-50001:2018; implemented in 2021. |
Local certification and compatibility requirements
Domestic adopters often require GB/T compliance
Foreign EMS vendors require localization and certification partners. |
|
India |
Bureau of Energy Efficiency (BEE) – PAT scheme; Energy Conservation Act |
Perform, Achieve & Trade (PAT) sets energy-intensity targets for energy-intensive industries
BEE administers energy efficiency regulations and programs. |
PAT drives industrial EMS adoption (monitoring, baseline, and savings verification). Vendors often integrate compliance reporting and energy-saving certificate workflows. |
Segmental Insights
Component Analysis
The hardware segment dominated the energy management systems market in 2025, driven by the monitoring and management of building activities to gain traction and incorporate intelligence. The expansion in the adoption of communication and sensor technologies represents a sizeable portion of the worldwide market. Smart sensors, meters, and controllers are essential for collecting data on energy consumption, temperature, and failures. The software would have nothing to analyze without these devices. The demand for these components has boosted as businesses aim to digitalize their operations. Moreover, wired sensor networks are expanding their market presence as they are more dependable, have longer service lives, and are less susceptible to interference and disturbances.
Deployment Analysis
The cloud segment accounted for the largest share of the market in 2025. This is due to the need to reduce carbon emissions and lower costs, which is expected to drive a large portion of global market growth. Cloud computing systems have increased the flexibility for businesses to analyze, monitor, and evaluate data remotely. End customers are expected to express a need for cloud-based EMS for real-time energy visibility. Cloud-based energy management solutions have gained popularity, enabling end-users to control and monitor energy habits utilizing IoT devices. Thus, the cloud is expected to gain global popularity as advanced technology, and the Internet of Things plays a crucial part in reducing energy consumption.
Regional Analysis
North America Energy Management Systems Market Insights
North America accounted for the largest market share in 2025, driven by increasing adoption of smart grids and infrastructure investment. The U.S. and Canada are expected to offer opportunities to generate revenue. According to the IEA, investments in energy grids are expected to increase by 10% in 2021, with the U.S. among the primary countries investing in infrastructure. Furthermore, the need for smart energy has increased throughout the area. This has encouraged the stakeholders to invest money in EMS. The building, residential, and commercial sectors are expected to show the strongest demand for IoT-based solutions. The increase in energy usage for space heating and cooling is primarily responsible for the trajectory of development. For instance, the U.S. Energy Information Administration referenced the Annual Energy Outlook 2022 in June 2022 to claim that heating and cooling accounted for about 50% of the energy consumed in U.S. buildings in 2021. It is also projected that power providers and business and industrial organizations focus on clean energy technology and connectivity to reduce carbon emissions and access the global market.
Asia Pacific Energy Management Systems Market Assessment
Asia Pacific is expected to witness the fastest growth during the forecast period, driven by rapid expansion across industries and the economy. Regions like China and India are expected to drive demand for operational efficiency and to minimize energy-related costs in manufacturing processes. The growing urbanization of regions and the incorporation of effective energy management solutions into smart infrastructure have led to this shift. Amidst governmental regulations on carbon management, sectors in the region have adopted the solutions. In addition, rising energy costs have prompted organizations to invest more in energy management solutions with a focus on sustainability.
Competitive Insights
Key market players are investing heavily in research and development to expand their offerings. This is expected to fuel the energy management systems market growth in the coming years. Market participants are also undertaking a variety of strategic activities. They include innovative launches, international collaborations, higher investments, and mergers and acquisitions to expand their global footprint. To expand and survive in a more competitive, rapidly evolving market, the energy management systems industry must offer innovative solutions.
The market for energy management systems is fragmented, with the presence of numerous global and regional market players. Some of the major players operating in the global market include Schneider Electric SE; Honeywell International Inc.; Siemens AG; Johnson Controls, Inc.; C3.ai, Inc.; GridPoint; General Electric; ABB; International Business Machines Corporation; and Cisco Systems, Inc.
List of Key Companies
- Schneider Electric SE
- Honeywell International Inc.
- Siemens AG
- Johnson Controls, Inc.
- C3.ai, Inc.
- GridPoint
- General Electric
- ABB
- International Business Machines Corporation
- Cisco Systems, Inc.
Recent Developments
- September 2025: Honeywell International Inc. introduced the Ionic Modular All-in-One, a compact battery energy storage system for commercial and industrial users. It combines flexible storage with advanced controls and analytics to optimize energy costs and support grid stability. Scalable from 250 kWh to 5 MWh, it includes cybersecurity features and enables onsite or remote monitoring via Honeywell’s platform.
- January 2025: ABB partnered with Edgecom Energy to integrate generative AI into energy management solutions. The collaboration helps industrial and commercial users optimize power use and reduce demand peaks, strengthening ABB’s digital energy portfolio by combining its Smart Power expertise with Edgecom’s AI Energy Copilot for more efficient, sustainable operations.
- November 2024: IBM announced the general availability of IBM Maximo Renewables, a solution aimed at improving the management and performance of renewable energy assets. The platform allows companies to monitor asset performance, identify efficiency losses, suggest corrective actions, and optimize maintenance planning.
- September 2024: Larsen & Toubro’s Power Transmission & Distribution (PT&D) business received the mandate to develop and implement Energy Management Systems. This order is provided for digitally based intelligent projects being executed by L&T DES globally.
- June 2024: ABB launched ABB Ability OPTIMAX 6.4 to provide coordinated control of multiple industrial assets and processes for improved energy efficiency and to reduce emissions and support decarbonization.
- December 2021: General Electric acquired Opus One Solutions Energy Corporation, a software company that aids in the optimization of energy operations and planning. This agreement will help General Electric organize, improve, and trade distributed and renewable energy resources to allow a modern system.
Energy Management Systems Market Segmentation
By System Outlook (Revenue, USD Billion, 2021–2034)
- Home Energy Management Systems (HEMS)
- Industrial Energy Management Systems (IEMS)
By Component Outlook (Revenue, USD Billion, 2021–2034)
- Hardware
- Software
- Services
By Deployment Outlook (Revenue, USD Billion, 2021–2034)
- On-Premises
- Cloud
By Vertical Outlook (Revenue, USD Billion, 2021–2034)
- Residential
- Energy & Power
- Telecom & IT
- Manufacturing
- Retail
- Healthcare
- Others
By Regional Outlook (Revenue – USD Billion, 2021–2034)
- North America
- US
- Canada
- Europe
- Germany
- France
- UK
- Italy
- Spain
- Netherlands
- Russia
- Rest of Europe
- Asia Pacific
- China
- Japan
- India
- Malaysia
- South Korea
- Indonesia
- Australia
- Vietnam
- Rest of Asia Pacific
- Middle East & Africa
- Saudi Arabia
- UAE
- Israel
- South Africa
- Rest of Middle East & Africa
- Latin America
- Mexico
- Brazil
- Argentina
- Rest of Latin America
Energy Management Systems Market Report Scope
|
Report Attributes |
Details |
|
Market Size in 2025 |
USD 59.41 billion |
|
Market Size in 2026 |
USD 66.16 billion |
|
Revenue Forecast by 2034 |
USD 158.66 billion |
|
CAGR |
13.53% |
|
Base Year |
2025 |
|
Historical Data |
2022–2024 |
|
Forecast Period |
2026–2034 |
|
Quantitative Units |
Revenue in USD billion, 2021–2034 and CAGR from 2026 to 2034 |
|
Report Coverage |
Revenue Forecast, Market Competitive Landscape, Growth Factors, and Trends |
|
Segments Covered |
|
|
Regional Scope |
|
|
Competitive Landscape |
Energy Management Systems Industry Trend Analysis (2025) Company profiles/industry participants profiling include company overview, financial information, product/service benchmarking, and recent developments |
|
Report Format |
PDF + Excel |
|
Customization |
Report customization as per your requirements with respect to countries, regions, and segmentation. |
FAQ's
The global energy management systems market is projected to reach USD 158.66 billion by 2034. It is expected to account for a CAGR of 13.53% between 2026 and 2034.
Energy management systems can optimize performance through real-time monitoring, ensure regulatory compliance, improve energy efficiency, reduce operational costs, and provide systematic tracking of industrial or commercial energy consumption.
Cloud-based is presently leading the market in terms of market share, as it offers greater productivity, greenhouse gas emission reduction, scalability, lower implementation costs, and easy integration for monitoring energy consumption.
North America accounted for the largest market share in 2025, owing to increasing adoption of smart grids and infrastructure investment.
The manufacturing sector, buildings, utilities, telecom, information technology, and public sector organizations benefit from the optimization of energy consumption.
• The cloud segment accounted for the largest share of the market in 2024.
Page last updated on:
Jan-2023
Research Methodology
A robust system of research, verification, and forecasting designed to ensure reliable and actionable market insights.
Polaris Market Research uses a clear and structured approach to deliver insights that clients can rely on. The process combines detailed primary and secondary research, including direct communication with industry experts. The detailed information helps build a complete picture of market trends and developments. Secondary data is gathered from credible sources such as industry reports, company filings, government source links, and trusted organization databases. It is then cross-checked through discussions with key stakeholders across the value chain. Market size and forecasts are developed using both bottom-up and top-down methods to ensure accuracy and consistency in the final results.

Project Setup
Step 1 & 2:
- We start every project by clearly understanding the client’s objective or goal, then defining the market scope, and aligning regions, segments, and timelines.
- Once the foundation is set, we collect data from all-around of sources, including company reports, government databases, and paid industry platforms.
- Our research is based on secondary data, which helps us build a strong understanding of the market across regions and industries. Then we validate this information through primary research by speaking directly with industry experts, companies, and stakeholders.
- By combining secondary and primary research, we ensure that our market insights are accurate, practical, and closely aligned with real market conditions.
Data Collection
We gather information from both public and verified sources:

Data Structuring
Step 3:
- All collected data is organized into a consistent format to ensure accurate analysis. Since inputs come from multiple sources, they are standardized and aligned before use.
- The data is segmented by product, application, and region, and mapped across a defined historical period (2020–2024). All values are converted into common units (USD Mn/Bn), and volume and pricing are aligned where required to estimate revenue.
- Any overlaps or inconsistencies are reviewed and adjusted to maintain accuracy (<5% variance threshold).
- The result is a structured dataset that allows for clear comparison across regions and supports reliable analysis and forecasting.
Structured Market Dataset, USD Mn/Bn

4. Data Structuring
Step 4: TOP-DOWN APPROACH
- We start with the overall market size at a global or macro level.
- The market is then narrowed down based on scope and industry relevance.
- We apply penetration rates and split the data by region and segment.
- This helps us estimate the market size for specific segments.
- The numbers are validated through cross-checks to ensure accuracy.

Step 5: BOTTOM-UP APPROACH
- We begin by analyzing data from leading companies in the market.
- Revenue data is collected and mapped across different segments.
- The data is then aggregated to estimate the total market size.
- To fill in any gaps, adjustments are made based on industry standards.
- Validation checks make sure that the results are correct.

5. Data Structuring
Step 6:
At Polaris Market Research, we employ a methodical forecasting strategy. This approach blends the analysis of historical data with real-time market validation. To forecast future trends with precision, we examine past patterns, pricing fluctuations, and the interplay of supply and demand. To ensure our conclusions reflect the present market landscape, we actively seek input from industry experts and key stakeholders.
To refine our predictions, we carefully consider critical elements such as market drivers and restraints, fluctuations in raw material costs, emerging technologies, and the production capabilities of various regions. Furthermore, we assess regulatory frameworks and potential policy shifts to gauge their potential impact on market expansion.
All this information is synthesized to generate precise forecasts for each segment and region. These forecasts illuminate the current state of the market and highlight forthcoming opportunities.

6. Data Structuring
Step 7:
In the final stage, we validate all our estimates using a triangulation method, where data is cross-checked from multiple reliable sources, like company data, primary interviews, and secondary research. This helps us make sure that our numbers are correct and fit with the rest of the market.
This process involves verifying data consistency across various segments and geographic areas. It also requires comparing historical trends with the assumptions support the forecast. Any discrepancies involve adjustments to ensure everything remains aligned and dependable.
Once the data is finalized, we prepare the final outputs, including market size estimates, segment-wise breakdowns, and growth metrics. These are delivered in structured formats such as tables, charts, and data files for easy analysis and use.
We collaborate closely with clients, ensuring the final products align with their requirements. This includes offering tailored adjustments, supplementary data analyses, and continuous assistance. Furthermore, we monitor market trends post-delivery, providing updates and refinements to maintain the insights' relevance as time passes.
Post-delivery, we continue to monitor market shifts, offering updates and adjustments to ensure the insights remain relevant over time.
Validation
Triangulation Framework
- Company-level data
- Primary inputs from industry participants
- Secondary benchmarks and published data
- Variance maintained within ±5-10%
- Adjustments applied to align estimates
- Segment values validated against overall market structure
Quality Check
Data Consistency & Integrity
- Segment totals validated to 100%
- Regional estimates aligned with global market size
- Historical trends compared against forecast outputs
- Assumptions reviewed for cross-segment and regional alignment
Output & Delivery
Final Outputs
- Market size estimates (USD Mn/Bn)
- Segment-wise distribution (%)
- Growth metrics (CAGR %)
- Structured tables and charts
- Segment-level datasets
- Excel-based data files for further analysis
Client Alignment & Support
- Deliverables are aligned with defined client requirements and scope
- Custom data cuts and segment splits are incorporated as required
- Post-delivery queries are addressed through analyst interactions
- Additional clarifications and data support are provided upon request
Client Continuity & Updates
- Market developments are tracked post-delivery to capture changes in key trends
- Updated data and revisions are provided based on new market inputs
- Additional refinements and data cuts are shared as required
- Continued analyst engagement supports evolving client requirements
