
Europe Chemical Distribution Market Trends, Forecasts, and Key Players, 2025-2034
REPORT DETAILS
Market Statistics
Overview
The Europe chemical distribution market size was valued at USD 101.91 billion in 2024, growing at a CAGR of 6.44% from 2025–2034. Key factors driving demand includes demand for sustainable & bio-based solutions, strict EU regulatory compliance (REACH), outsourcing of supply chain functions, and rising value-added services (VAS).
Key Insights
- Commodity chemicals held the largest revenue share in 2024, driven by their widespread use in core industries such as construction, automotive, and manufacturing.
- The downstream chemicals segment is projected for the fastest growth, fueled by its critical role in producing plastics, fibers, coatings, and detergents.
- Germany held the largest revenue share in 2024, leveraging its position as Europe's primary industrial and chemical production hub.
- Italy's market is driven by strong chemical demand from its strategically important textiles, fashion, construction, and food processing sectors.
Industry Dynamics
- European chemical manufacturers outsource complex logistics and regulatory handling to specialized distributors to optimize efficiency and mitigate operational risks.
- The growth is fueled by distributors expanding beyond delivery to offer formulation support, technical consulting, and custom blending.
- The immense and rising cost of complying with stringent EU regulations, such as REACH, squeezes profit margins and creates a high barrier to entry for smaller players.
- The strong regulatory push for a circular economy and sustainable chemicals opens new high-value revenue streams in distributing bio-based and green alternative products.
Market Statistics
- 2024 Market Size: USD 101.91 billion
- 2034 Projected Market Size: USD 189.96 billion
- CAGR (2025-2034): 6.44%
- Germany: Largest market in 2024
AI Impact on Europe Chemical Distribution Market
- AI optimizes complex regulatory compliance, automating safety data sheet management and ensuring adherence to strict, evolving EU regulations like REACH, reducing risk and administrative burden.
- It enables predictive logistics routing, anticipating disruptions and optimizing delivery routes across borders to enhance efficiency, lower costs, and improve sustainability metrics.
- AI personalizes value-added services by analyzing customer data to recommend tailored formulations and sustainable product alternatives, strengthening client partnerships and unlocking new revenue.
- It strengthens supply chain resilience by modeling risks from geopolitical shifts and demand volatility, allowing for proactive contingency planning and sourcing strategies.
The chemical distribution, which involves the systematic channeling of chemicals from producers to end-users while ensuring safety, efficiency, and compliance, is increasingly being shaped by the demand for sustainable and bio-based solutions. In Europe, where environmental consciousness and circular economy principles are highly prioritized, distributors are playing a major role in bridging the gap between producers of eco-friendly chemicals and industries adopting greener practices. Distributors support industries such as packaging, textiles, and personal care in reducing their environmental footprint by expanding portfolios with bio-based alternatives, renewable raw materials, and low-impact formulations. For instance, in March 2025, Brenntag collaborated with GFBiochemicals to distribute their sustainable levulinate ester solvents in Europe for CASE markets, offering a biodegradable alternative to conventional fossil-based options. This growing shift toward sustainability strengthens customer trust and also enhances the strategic importance of distributors as partners in enabling long-term green packaging transitions across the chemical value chain.
Source: Polaris Market Research Analysis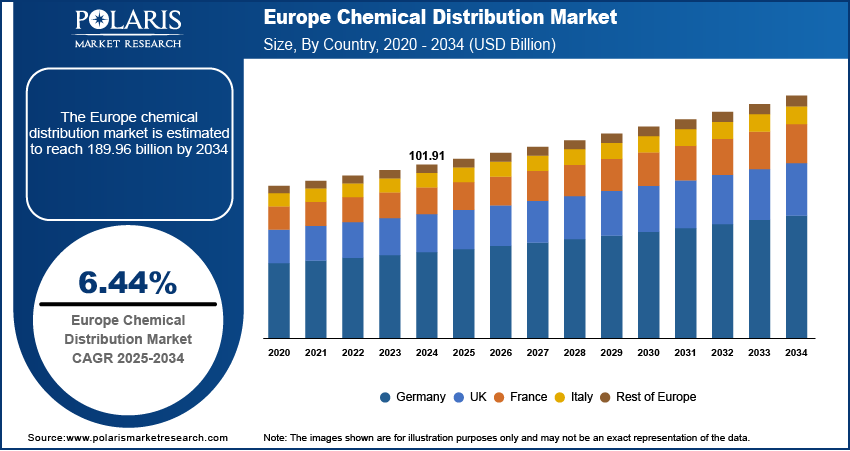
Want a Deeper Look at Key Market Players? Download Sample Report
The strict EU regulatory compliance further drives the Europe chemical distribution market, particularly with frameworks such as REACH (Registration, Evaluation, Authorisation, and Restriction of Chemicals). These regulations demand strict monitoring, documentation, and adherence to safety standards throughout the supply chain, placing added responsibility on distributors to act as compliance facilitators. Distributors in Europe are increasingly providing expertise in regulatory management, ensuring that chemicals meet legal requirements before reaching end-users. Their role extends beyond logistics to include technical support, safety guidance, and documentation services, which are crucial for small and mid-sized companies lacking in-house compliance infrastructure. Therefore, by ensuring seamless alignment with EU regulatory frameworks, distributors minimize risks and also reinforce their role as trusted partners in safeguarding both industries and consumers.
Drivers & Opportunities
Outsourcing of Supply Chain Functions: Outsourcing of supply chain functions is driving the Europe chemical distribution market as companies increasingly look to optimize efficiency, reduce operational risks, and focus on their core competencies. The chemical industry, with its complex regulatory environment and strict requirements for handling, transportation, and storage, greatly benefits from outsourcing to specialized distributors who possess the expertise and infrastructure necessary to manage these processes effectively. Manufacturers ensure timely delivery, cost optimization, and adherence to strict European safety and environmental standards by entrusting distributors with critical supply chain operations. This outsourcing enhances the reliability of the distribution network and also strengthens the role of chemical distributors as strategic partners, rather than mere intermediaries.
Rising Value-Added Services (VAS): Rising value-added services (VAS) are also fueling growth in the European chemical distribution market, as customers increasingly demand more than just product supply. Distributors in the region are expanding their offerings to include services such as formulation support, technical consulting, customized packaging, blending, and compliance assistance. For instance, in July 2025, Bodo Möller Chemie secured distribution rights for Rain Carbon's hydrocarbon resins and solvents in Poland, Slovakia, and the Czech Republic, enhancing its supply role for the region's paint, adhesive, and rubber industries. These services add value for end-users by addressing their specific operational and regulatory needs, particularly in sectors such as pharmaceuticals, food, coatings, and specialty chemicals. Furthermore, the integration of VAS enhances customer loyalty while enabling distributors to differentiate themselves in a competitive market. In Europe, where regulatory compliance and sustainability expectations are high, value-added services also help companies meet stringent industry standards, thereby reinforcing the strategic importance of distributors in the regional chemical ecosystem.
Source: Polaris Market Research Analysis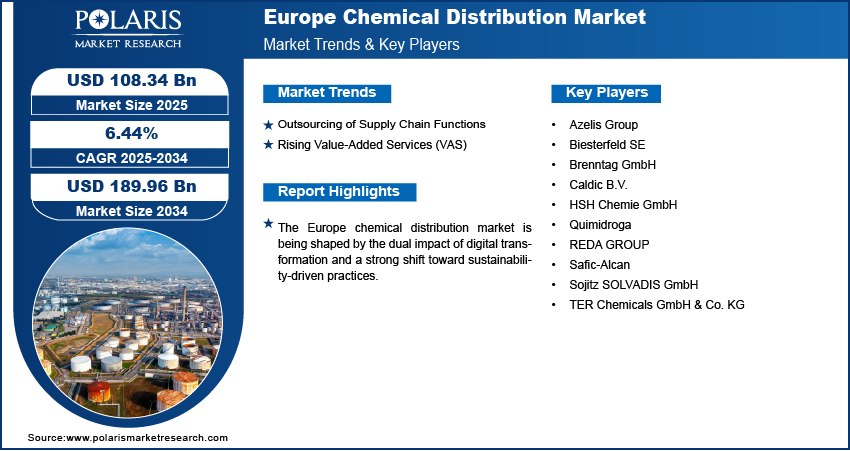
Get Full Segment-Level Forecasts & Insights: Download Sample Report
Segmental Insights
Type Analysis
Based on type, the segmentation includes specialty chemicals, commodity chemicals. The commodity chemicals segment accounted for largest revenue share in 2024, primarily due to their extensive use across various industries, such as construction, automotive, agriculture, and manufacturing. These chemicals, such as basic acids, bases, and polymers, are produced in large volumes and represent essential raw materials for downstream applications. In Europe, the steady demand for commodity chemicals is supported by the well-established industrial base and robust supply chains that ensure consistent availability. Additionally, their relatively lower cost compared to specialty chemicals makes them more widely adopted across traditional and emerging sectors, reinforcing their dominance in the market.
End Use Analysis
In terms of end use, the segmentation includes specialty chemicals, commodity chemicals. Under the commodity chemicals, downstream chemicals segment is expected to witness fastest growth during the forecast period due to its integral role in producing value-added products such as plastics, fibers, coatings, and detergents. The demand for downstream chemicals in Europe is strongly influenced by the expanding automotive, packaging, and consumer goods industries, which require large-scale, reliable supplies. Furthermore, the increasing focus on sustainable production and circular economy initiatives is driving companies to innovate in downstream processing, thereby enhancing the need for efficient distribution networks. This rising dependency on downstream chemicals highlights the growing importance of advanced distribution services in the region.
Source: Polaris Market Research Analysis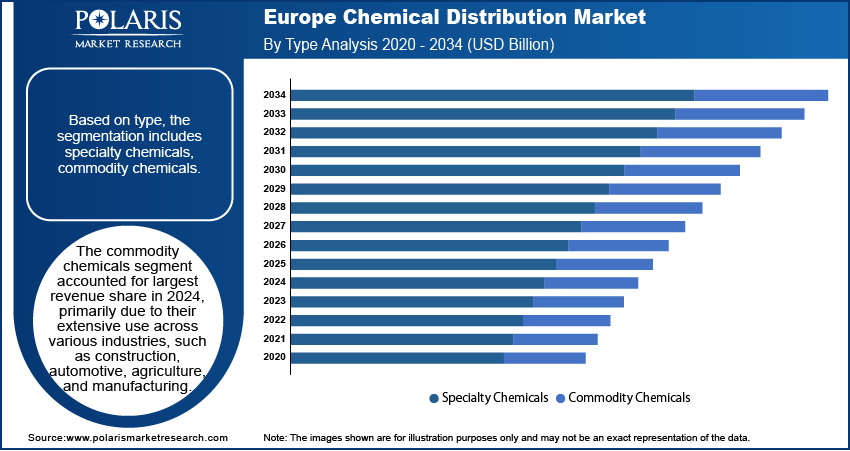
Need Granular Data Across All Market Segments? Request Customization
Country Analysis
Germany Chemical Distribution Market
Germany chemical distribution landscape accounted for largest revenue share in 2024 due to the country’s position as Europe’s industrial hub in chemical production. Germany’s strong manufacturing ecosystem, encompassing the automotive, pharmaceutical, and specialty materials sectors, creates a continuous demand for both commodity and specialty chemicals. The presence of leading multinational chemical companies, combined with advanced logistics and regulatory frameworks, further strengthens Germany’s role in the regional distribution network. Additionally, its central geographic location within Europe enables distributors to efficiently serve both domestic and cross-border demand, thereby consolidating its market dominance.
Italy Chemical Distribution Market
The Italy market is driven by the increasing demand for chemicals in sectors such as textiles, fashion, construction, and food processing, all of which hold strategic importance to the country’s economy. Italian chemical distributors are focusing on providing tailored solutions, particularly in specialty segments, to meet the needs of small and medium-sized enterprises that dominate the industrial landscape. The country’s growing focus on sustainable practices and eco-friendly products is also boosting the demand for specialty chemicals and innovative formulations. Moreover, Italy’s role as a major exporter of high-quality finished goods fuels consistent demand for reliable chemical distribution services, positioning the market for steady expansion.
Source: Polaris Market Research Analysis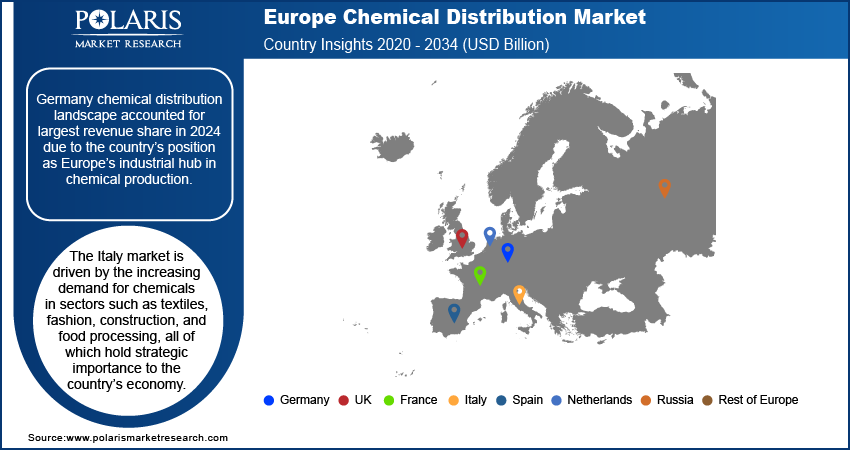
Curious About Regional Market Performance? Request Customization
Key Players & Competitive Analysis Report
The Europe chemical distribution landscape is characterized by intense competition among players such as Brenntag and Univar Solutions, and strong regional specialists such as Azelis and Biesterfeld. Competitive intelligence and strategy highlight a focus on strategic investments in sustainable value chains and high-value specialties as key revenue growth drivers. Industry trends show consolidation via M&A is a primary vendor strategy for gaining regional footprint and expertise. Emerging markets in Eastern Europe present significant expansion opportunities, though navigating economic and geopolitical shifts remains a challenge. Disruptions and trends, particularly the push for bio-based chemicals, are reshaping business segments. Expert's insight confirms that technological advancement in logistics and digital services is now critical for competitive positioning and capturing latent demand and opportunities from small and medium-sized businesses.
Major companies operating in the chemical distribution industry include Azelis Group, Biesterfeld SE, Brenntag GmbH, Caldic B.V., HSH Chemie GmbH, Quimidroga, REDA GROUP, Safic-Alcan, Sojitz SOLVADIS GmbH, and TER Chemicals GmbH & Co. KG.
Key Players
- Azelis Group
- Biesterfeld SE
- Brenntag GmbH
- Caldic B.V.
- HSH Chemie GmbH
- Quimidroga
- REDA GROUP
- Safic-Alcan
- Sojitz SOLVADIS GmbH
- TER Chemicals GmbH & Co. KG
Industry Developments
- February 2025: Nordmann expanded partnership with Wanhua Chemical to include distribution of Polymethylmethacrylate (PMMA) in the European market, in addition to their existing Thermoplastic Polyurethanes (TPU) collaboration.
- February 2025: Safic-Alcan and Teknik Kimya collaborated for distribution in Poland. The agreement encompasses performance chemicals, release agents, and colorants for polyurethane applications in the automotive, footwear, and elastomer industries.
Europe Chemical Distribution Market Segmentation
By Type Outlook (Revenue, USD Billion, 2020–2034)
- Specialty Chemicals
- CASE
- Agrochemicals
- Electronic
- Construction
- Specialty Polymers & Resins
- Personal Care & Pharmaceuticals
- Other
- Commodity Chemicals
- Plastic & Polymers
- Synthetic Rubber
- Explosives
- Petrochemicals
- Other
By End Use Outlook (Revenue, USD Billion, 2020–2034)
- Specialty Chemicals
- Automotive & Transportation
- Construction
- Agriculture
- Industrial Manufacturing
- Consumer Goods
- Textiles
- Pharmaceuticals
- Other
- Commodity Chemicals
- Downstream Chemicals
- Textiles
- Electrical & Electronics
- Automotive & Transportation
- Industrial Manufacturing
- Others
By Country Outlook (Revenue, USD Billion, 2020–2034)
- Europe
- Germany
- France
- UK
- Italy
- Spain
- Netherlands
- Russia
- Rest of Europe
Europe Chemical Distribution Market Report Scope
| Report Attributes | Details |
| Market Size in 2024 | USD 101.91 Billion |
| Market Size in 2025 | USD 108.34 Billion |
| Revenue Forecast by 2034 | USD 189.96 Billion |
| CAGR | 6.44% from 2025 to 2034 |
| Base Year | 2024 |
| Historical Data | 2020–2023 |
| Forecast Period | 2025–2034 |
| Quantitative Units | Revenue in USD Billion and CAGR from 2025 to 2034 |
| Report Coverage | Revenue Forecast, Competitive Landscape, Growth Factors, and Industry Trends |
| Segments Covered |
|
| Country Scope |
|
| Competitive Landscape |
|
| Report Format |
|
| Customization | Report customization as per your requirements with respect to countries, regions, and segmentation. |
Source: Polaris Market Research Analysis
Europe Chemical Distribution Market FAQ's
The market size was valued at USD 101.91 billion in 2024 and is projected to grow to USD 189.96 billion by 2034.
The market is projected to register a CAGR of 6.44% during the forecast period.
The Germany chemical distribution market accounted for largest revenue share in 2024.
A few of the key players in the market are Azelis Group, Biesterfeld SE, Brenntag GmbH, Caldic B.V., HSH Chemie GmbH, Quimidroga, REDA GROUP, Safic-Alcan, Sojitz SOLVADIS GmbH, and TER Chemicals GmbH & Co. KG.
The commodity chemicals segment accounted for largest revenue share in 2024.
Under the commodity chemicals, downstream chemicals segment is expected to witness fastest growth during the forecast period.
Download Sample Report of Europe Chemical Distribution Market
Please fill out the form to request a customized copy of the research report.
