
Europe Industrial Lubricants Market Growth, Industry Trends, 2025-2034
REPORT DETAILS
Market Statistics
Overview
The global Europe industrial lubricants market size was valued at USD 26.93 billion in 2024, growing at a CAGR of 2.5% from 2025–2034. Growing European automotive and heavy machinery manufacturing and tough EU environmental laws are fueling demand for sustainable industrial lubricants.
Key Insights
- Mineral oils led Europe market in 2024 by price competitiveness and wide availability.
- Hydraulic fluids to grow fastest by demand for advanced systems and low-loss products.
- Germany held largest share in 2024 with strong manufacturing and automotive penetration.
- Highest CAGR in the UK by 2034 with growing industrialization and energy needs.
Industry Dynamics
- Automotive and heavy equipment technologies push lubricant use for efficiency and longevity.
- EU directives compel the use of sustainable synthetic and bio-based lubricants.
- Innovations in synthetic and bio-lubricants unlock performance and efficiency possibilities.
- Synthetic high costs and raw material price volatility hold back adoption within cost-sensitive segments.
Market Statistics
- 2024 Market Size: USD 26.93 Billion
- 2034 Projected Market Size: USD 34.26 Billion
- CAGR (2025–2034): 2.5%
AI Impact on Europe Industrial Lubricants Market
- AI enhances performance through observation of load profiles, environment, and lubricant performance.
- Integration lends support to adaptive viscosity control, flow rate, and re-lubrication cycles.
- AI diagnostics track degradation, contamination, and wear to allow predictive maintenance.
- Monitoring, alarms, and schedules are handled automatically by AI in an effort to enhance efficiency and reliability.
Industrial lubricants reduce wear, friction, and improve machinery efficiency across diverse industries. The portfolio of products includes hydraulic fluids, metalworking fluids, industrial engine oils, gear oils, compressor oils, and specialty lubricants. They are widely applied in automotive, aerospace, energy, chemicals, marine, construction, and heavy equipment sectors. Oxford Economics puts global construction at USD 9.7 trillion in 2022 to USD 13.9 trillion in 2037, led by China, the US, and India.
In industrial production, lubricants control temperature, prevent corrosion of components, and facilitate continuous production cycles. Their application in high-load, high-heat environments makes machinery perform better while reducing downtime and maintenance costs. Use of advanced synthetic and bio-based lubricants is gaining more popularity across Europe as companies focus on sustainability and environmental requirements.
Source: Polaris Market Research Analysis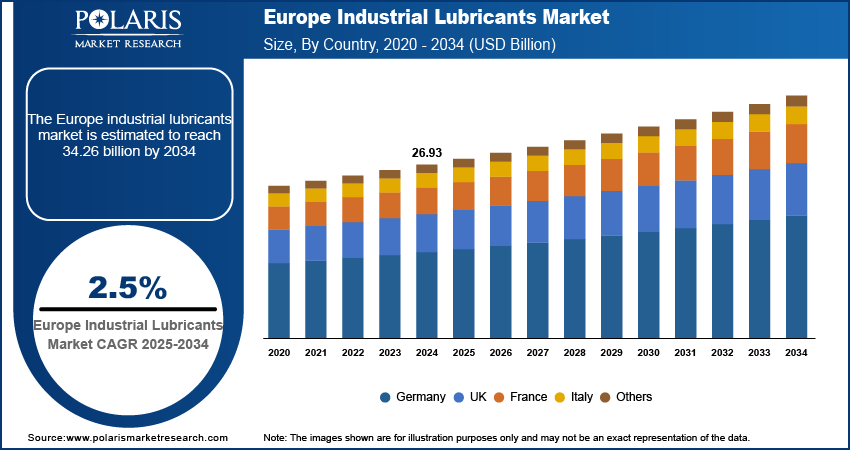
Want a Deeper Look at Key Market Players? Download Sample Report
The Europe industrial lubricants market rises with a large base of manufacturing, energy efficiency needs, and application of advanced machinery. Government support for low-emission and biodegradable lubricants, along with investment in automation and smart manufacturing, strengthens market growth. Growth in renewable energy, especially wind energy, is boosting the demand for turbine-specific specialty lubricants.
Drivers & Opportunities
Growth in automotive and heavy machinery manufacturing across Europe: Rising car and heavy machinery production boosts the demand for lubricants in Europe. Lubricants increase efficiency, reduce friction, and extend equipment life. OICA shows that motor vehicle manufacturing rose from 79.9 million units in 2021 to 93.4 million units in 2023, recording 11% growth in 2022 and 10% in 2023. Higher commercial vehicle production and expansion in construction, agriculture, and mining equipment accelerate usage. Higher-performance lubricants are also required for increasingly complex facilities in engines, gearboxes, and hydraulics.
Stringent EU environmental regulations accelerating the shift toward sustainable formulations: The EU has put in place stringent regulations that reduce emissions and promote environmentally friendly industrial practices. This drives the transition from mineral-based to synthetic and bio-based lubricants. Companies aim at biodegradable and low-emission products in compliance with EU sustainability directives. Increased demand for sustainable lubricants includes automotive, marine, energy, and general manufacturing. The transition offers innovation opportunities and enables long-term development of Europe's industrial lubricants market.
Source: Polaris Market Research Analysis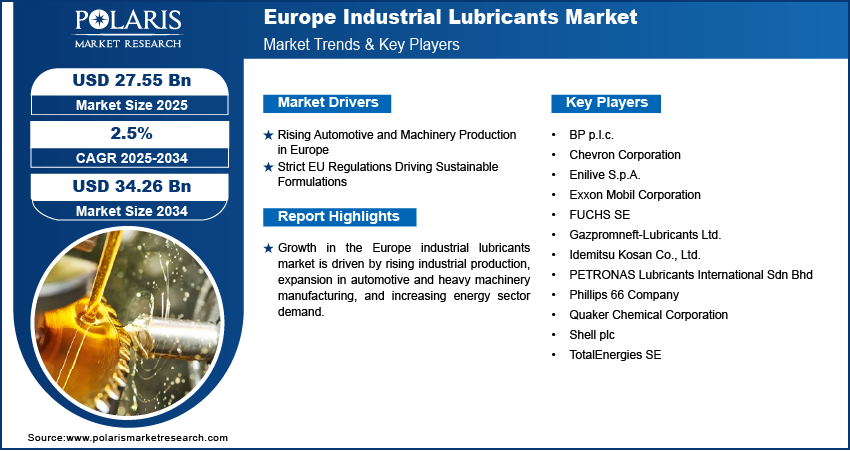
Get Full Segment-Level Forecasts & Insights: Download Sample Report
Segmental Insights
Base Oil Type Analysis
Based on base oil type, the segmentation includes mineral oils, synthetic oils, bio-based oils, and recycled oils. Mineral oils were the largest in the Europe market in 2024 owing to cost, availability, and compatibility with traditional equipment. Heavy equipment and widespread applications also drive usage. Their use in the automotive, building, and manufacturing sectors maintains demand robust perpetually.
Synthetic lubricating oils is growing rapidly according to thermal stability, longer service life, and performance in harsh conditions. Adoption is growing with energy efficiency and sustainability goals.
Application Analysis
On the basis of application, the division consists of metalworking fluids, hydraulic fluids, general Europe industrial lubricants, process oils, and gear oils. Metalworking fluids dominated the market in 2024 with extensive use in machining, cutting, and forming processes. Robust automotive and manufacturing foundations in Europe drive consumption. Precision engineering demand and facility investment consolidate segment leadership.
Hydraulic fluids increasing at the fastest rate as they provide smooth operation of high-pressure systems. Sophisticated hydraulic systems in construction and energy machinery drive demand higher. Better oxidation stability and adoption of automatic machinery drive utilization further.
End User Analysis
By end user, the segmentation is manufacturing, automotive, aerospace, energy, and construction. Manufacturing led in 2024 due to Europe's solid foundation in automotive, aerospace, and heavy machinery. Lubricants minimize downtime and improve performance in manufacturing facilities. Increasing demand for metalworking, hydraulic, and process oils drives leadership. The United Nations (UN) reports that global manufacturing production grew by 1.3% in Q1 2025 versus the last quarter.
The automotive segment is witnessing fastest growth, fueled by dependence on lubricants for metals working, gearboxes, and engines. Growth in EV and commercial vehicle production increases demand. More stringent efficiency requirements and automation adoption fuel strong segment growth.
Source: Polaris Market Research Analysis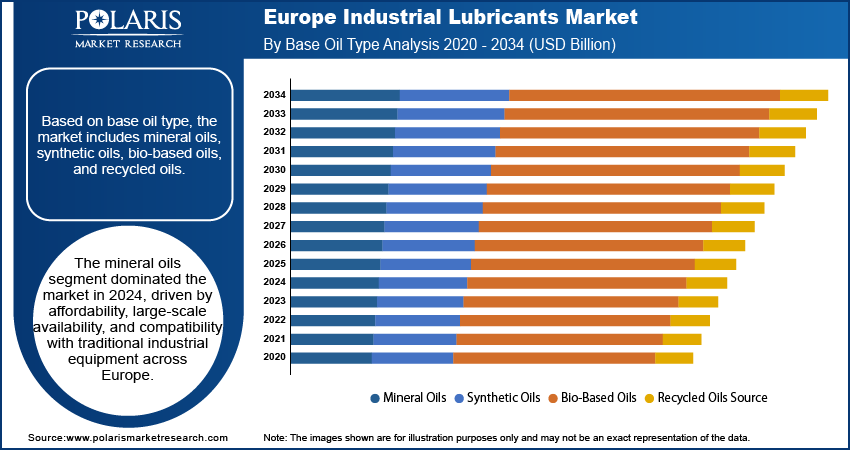
Need Granular Data Across All Market Segments? Request Customization
Regional Analysis
Germany dominated the Europe industrial lubricants market due to its high auto manufacturing industry. VDA registered 363,600 units of passenger cars produced in May 2025, a 19% year-on-year growth. The January-to-May 2025 production totaled 1.8 million units, a 4% expansion over 2024. Expanded machinery and automation drive development for synthetic and specialty lubricants, while the sustainability trend drives eco-friendly formulations.
The UK Europe Industrial Lubricants Market
The UK is likely to grow the fastest rate supported by initiatives towards renewable energy such as offshore wind calling for specialized lubricants. Investment since July has been over USD 54.16 billion, with attempts at doubling clean energy spending annually to USD 40.62 billion by 2035. Growing EV adoption and new vehicle technologies stimulate lubricant demand, while sustainable manufacturing and smart factories offer other opportunities.
Source: Polaris Market Research Analysis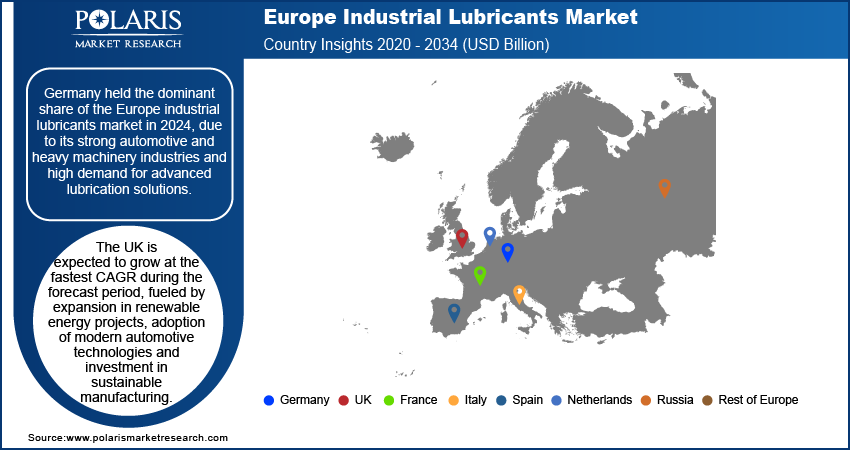
Curious About Regional Market Performance? Request Customization
Key Players & Competitive Analysis Report
The Europe industrial lubricants market is moderately competitive with a focus on innovative formulations. Market leaders add synthetic, bio-based, and specialty offerings in automotive, aerospace, energy, and heavy machinery segments. Collaborations with OEMs and research centers enable eco-friendly product lines.
Key players in the Europe industrial lubricants market Shell plc, BP p.l.c., Exxon Mobil Corporation, TotalEnergies SE, Chevron Corporation, FUCHS SE, PETRONAS Lubricants International Sdn Bhd, Idemitsu Kosan Co., Ltd., Phillips 66 Company, Enilive S.p.A., Gazpromneft-Lubricants Ltd., and Quaker Chemical Corporation.
Key Players
- BP p.l.c.
- Chevron Corporation
- Enilive S.p.A.
- Exxon Mobil Corporation
- FUCHS SE
- Gazpromneft-Lubricants Ltd.
- Idemitsu Kosan Co., Ltd.
- PETRONAS Lubricants International Sdn Bhd
- Phillips 66 Company
- Quaker Chemical Corporation
- Shell plc
- TotalEnergies SE
Industry Developments
- In June 2025, FPT Industrial and Petronas introduced a co-branded range of engine and transmission lubricants in Europe, formulated for FPT powertrains to meet OEM specifications and improve fuel efficiency, equipment protection, and service intervals.
- In May 2024, FPT Industrial and PETRONAS introduced co-branded semi-synthetic, mineral, and synthetic lubricants in Europe to enhance efficiency, reduce fuel consumption, increase engine lifespan, and deepen market penetration.
- In February 2023, Neste launched ReNew lubricants across Northern and Eastern Europe with a maximum of 50% renewable content, providing excellent performance, lowering carbon footprint, and reinforcing its market presence for sustainability.
Europe Industrial Lubricants Market Segmentation
By Base Oil Type Outlook (Revenue, USD Billion, 2020–2034)
- Mineral Oils
- Synthetic Oils
- Bio-Based Oils
- Recycled Oils Source
By Application Outlook (Revenue, USD Billion, 2020–2034)
- Metalworking Fluids
- Hydraulic Fluids
- General Europe Industrial Lubricants
- Process Oils
- Gear Oils
By End User Outlook (Revenue, USD Billion, 2020–2034)
- Manufacturing
- Automotive
- Aerospace
- Energy
- Construction
By Regional Outlook (Revenue, USD Billion, 2020–2034)
- Europe
- Germany
- France
- UK
- Italy
- Spain
- Netherlands
- Russia
- Rest of Europe
Europe Industrial Lubricants Market Report Scope
| Report Attributes | Details |
| Market Size in 2024 | USD 26.93 Billion |
| Market Size in 2025 | USD 27.55 Billion |
| Revenue Forecast by 2034 | USD 34.26 Billion |
| CAGR | 2.5% from 2025 to 2034 |
| Base Year | 2024 |
| Historical Data | 2020–2023 |
| Forecast Period | 2025–2034 |
| Quantitative Units | Revenue in USD Billion and CAGR from 2025 to 2034 |
| Report Coverage | Revenue Forecast, Competitive Landscape, Growth Factors, and Industry Trends |
| Segments Covered |
|
| Regional Scope | Europe |
| Competitive Landscape |
|
| Report Techniqueat |
|
| Customization | Report customization as per your requirements with respect to countries, regions, and segmentation. |
Source: Polaris Market Research Analysis
Europe Industrial Lubricants Market FAQ's
The global market size was valued at USD 26.93 billion in 2024 and is projected to grow to USD 34.26 billion by 2034.
The global market is projected to register a CAGR of 2.5% during the forecast period.
Germany dominated the Europe industrial lubricants market in 2024, driven by its strong manufacturing base, advanced automotive sector, and widespread use of high-performance lubricants.
A few of the key players in the market are Shell plc, BP p.l.c., Exxon Mobil Corporation, TotalEnergies SE, Chevron Corporation, FUCHS SE, PETRONAS Lubricants International Sdn Bhd, Idemitsu Kosan Co., Ltd., Phillips 66 Company, Enilive S.p.A., Gazpromneft-Lubricants Ltd., and Quaker Chemical Corporation.
The mineral oils segment dominated the market in 2024, driven by cost-effectiveness, wide availability, and continued use in conventional industrial machinery and equipment.
The automotive segment is projected to grow at the fastest CAGR, driven by growth in electric vehicle and commercial vehicle production along with rising demand for advanced lubricants in engines, gearboxes, and metalworking processes.
Download Sample Report of Europe Industrial Lubricants Market
Please fill out the form to request a customized copy of the research report.
