
EV Connector Market Size, Forecast, Global, Report, 2026-2034
REPORT DETAILS
Market Statistics
What is EV Connector Market Size?
EV Connector Market size was valued at USD 3.24 billion in 2025 and is anticipated to exhibit the CAGR of 27.7% during the forecast period. The growth is driven by government support to expand electric vehicle ecosystem, rise in the investment by key automotive players in electric vehicle, and technological advancement.
Market Overview
A connector is employed to deliver electrical energy from the charging station to the battery pack. The charging connector facilitates the flow of electricity from the charging station to the battery pack. In its structure, a charging connector shares similarities with a charging cable used for mobile phones, incorporating both a wall connector and a phone-side connector. Likewise, the charging connector for an electric vehicle's battery pack comprises a vehicle-side connector and a charger plug connector. The predominant type of electric vehicle charging stations globally is the Grid-to-Vehicle (G2V) variety, enabling charge transfer in a single direction.
The shift to electrification necessitates a fresh perspective on automotive design, underscoring the crucial role of high-quality automotive connectors in driving innovation. These connectors ensure the reliable distribution of power across various electrical systems, spanning from the battery and powertrain to dashboard electronics and specialized equipment. Moreover, they play a vital role in maintaining operational functionality in the event of faults, allowing systems to remain operational even in the case of isolated failures. The EV Charging Station can operate on either AC or DC power, and the classification of EV charging connectors is determined by the power source utilized.
Establishing an inclusive public charging infrastructure is crucial for achieving widespread adoption of electric vehicles (EVs). Public charging plays a vital role for EV owners residing in multi-unit complexes or without private driveways. Furthermore, for longer drives and the need to charge on the go, EV owners will rely on charging infrastructure along highways and driveways. Anticipated advancements in battery technology and increased investments from major stakeholders in charging networks are expected to drive growth in the global electric vehicle connectors market. Beyond government initiatives and incentives for installing EV charging stations, key players in the EV market are making substantial investments to develop charging networks in regions with high sales.
Source: Polaris Market Research Analysis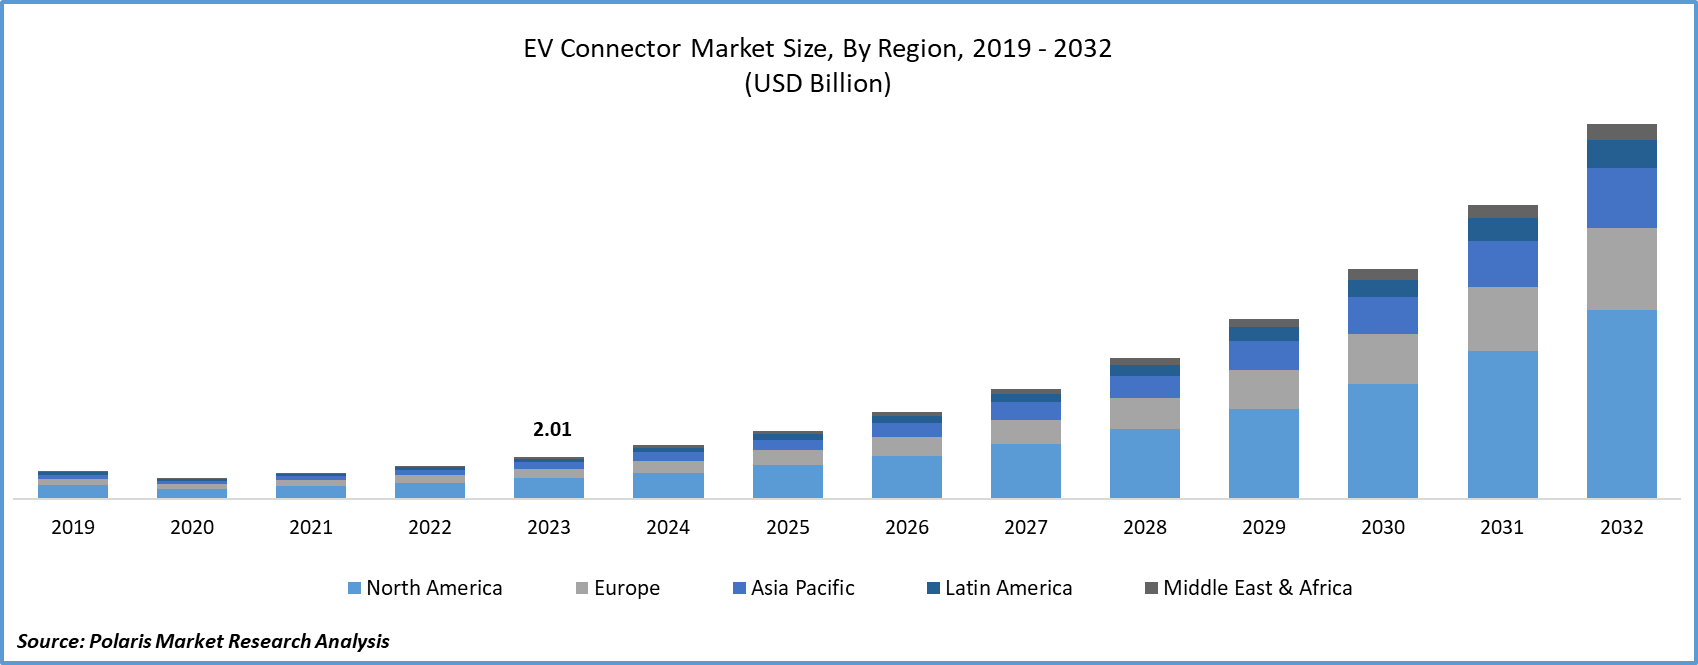
To Understand More About this Research: Download Sample Report
With the expansion of the electric vehicle (EV) market, there is a rising demand for vehicle-to-everything (V2X) charging connector solutions. The growing adoption of EVs underscores the significance of robust connectors capable of supporting EV charging, shaping the future automotive landscape, and contributing to grid and residential energy systems. Consequently, the escalating demand for V2X solutions is anticipated to enhance the applications and utilization of EV connectors across EV and related sectors, presenting an opportunity for the global electric vehicle connectors market.
Market Dynamics
Market Drivers
Government support and initiatives are bolstering the growth of the EV connector market.
Electric vehicle connectors play a crucial role in ensuring the seamless power transfer and charging process between the vehicle and the charging station. The global market for electric vehicle (EV) connectors has experienced remarkable growth in recent years, propelled by factors such as robust government support and initiatives. The crucial role of government support and initiatives is evident in the significant boost provided to the global electric vehicle connectors market. Governments across the globe have implemented policies and incentives aimed at fostering electric vehicle adoption and bolstering the development of charging infrastructure.
For instance, the European Union (EU), has set ambitious targets to reduce carbon emissions, including the goal of achieving carbon neutrality by 2050. In alignment with this objective, the EU has introduced regulations and funding programs to expedite the deployment of EV charging infrastructure. As reported by the European Alternative Fuels Observatory (EAFO), the number of public EV charging points in the EU surged by 35% in 2020, surpassing 250,000. Such proactive government initiatives fuel the demand for electric vehicle connectors, meeting the expanding requirements of the growing charging infrastructure.
Source: Polaris Market Research Analysis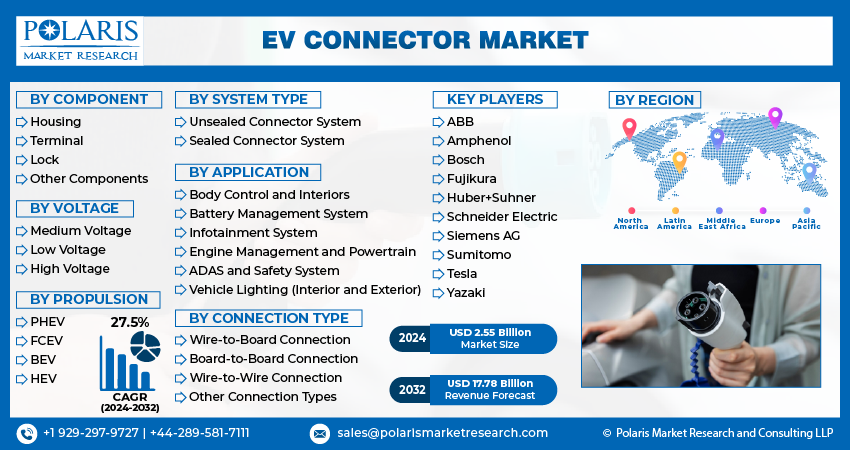
Get Full Segment-Level Forecasts & Insights: Download Sample Report
Market Restraints
Variations in the prices of raw materials are likely to hamper the growth of the market.
EV connectors are crafted from a blend of materials selected for their specific properties to fulfill the electrical and mechanical requisites of the connectors. The primary materials utilized in automotive connectors encompass metals, plastics, alloys, and coatings.
The prices of metals, particularly copper and aluminum, wield a significant influence on production costs. Escalating prices of these materials amplify the overall manufacturing expenses of EV connectors. Manufacturers may encounter challenges in preserving profit margins, especially if they are unable to pass on these heightened costs to customers, such as automotive OEMs. This volatility in material prices can precipitate disruptions in the supply chain as well. Surges in prices or shortages may disrupt the production timelines of connector manufacturers, leading to delays in delivering components to automotive OEMs. Consequently, this affects the overall manufacturing efficiency within the automotive industry.
Raw material prices exert an impact on the competitive landscape of the EV connector market. Global fluctuations in raw material and commodity prices diminish product competitiveness and have an adverse impact on profit margins. Manufacturers of automotive connectors rely on Tier II suppliers for raw materials like brass, copper, aluminum, and plastic connectors such as nylon 6 and Polybutylene Terephthalate (PBT). Moreover, any variance in the quality and price of raw materials impinges on profitability, posing a challenge for automotive connector manufacturers. Those adept at efficiently managing and mitigating the repercussions of material cost fluctuations may gain a competitive edge. Pricing strategies become pivotal, necessitating a delicate balance between competitive pricing and the imperative to cover production costs, especially during periods of volatile raw material prices. Consequently, an upswing in raw material prices directly constrains the profit margins of manufacturers, thereby impeding the EV connector market.
Key Trends in EV Connector
| Trend | Description | Technical / application focus | Examples from Practice |
| NACS standardized as SAE J3400 | NACS connector formalized as SAE J3400 TIR (Dec 2023), advancing to Recommended Practice (Aug 2024); supports AC L1/L2 and DC fast charging on same pins. | Universal NA compatibility up to 1 MW/1000V/650A+; PLC ISO 15118 comms; adapters for CCS1 transition; interoperable for all EVs/chargers. | SAE task force standardized Tesla's NACS as J3400 for open manufacturing; FHWA allows J3400 on federal DCFC with CCS1; OEMs add native J3400 from 2025. |
| Megawatt Charging System (MCS) | MCS for HDVs: 1.2–3.75 MW (1250V/3000A), liquid‑cooled automated couplers, V2G bidirectional, UL2251 safety. | 5‑min charges for 300+ kWh trucks; grounding/pre‑insertion; ISO 15118‑20; scalable from 400 kW+. | CharIN/NREL standard; Project EV charger demos V2G; reduces peak loads 40%; robust for fleets. |
| Bidirectional V2G/V2H/V2L | ISO 15118‑20 enables bidirectional power flow on CCS/NACS/MCS; SAE J2847/6 for wireless V2G comms. | EVs as grid storage: 1 MW return; Plug & Charge; session transfer; renewable integration (solar/wind). | IEC 61851 modes support bidirectional; J3400 with BMS enables V2G/V2L; regulates SoC/temp/safety. |
| Wireless SAE J2954 | Inductive WPT up to 11 kW (Z1–3 classes), 94% efficiency, Wi‑Fi 802.11n, 250 mm clearance. | Hands‑free light‑duty/AV charging; J1772 fallback; unidirectional now, bidirectional future. | SAE RP for interoperability/EMC/safety; field tests validate 2019; dynamic apps next. |
| CCS1/CCS2 (IEC 62196) | CCS1 (NA AC/DC hybrid 350 kW/1000V/500A); CCS2 (EU Type 2 DC pins); PLC ISO 15118. | Backward AC L1/L2 compatible; apartment/fast DC; current limits 13–70A AC. | SAE J1772 base; IEC defines plugs/inlets; NA CCS1 prevalent pre‑NACS. |
Source: Polaris Market Research Analysis
Report Segmentation
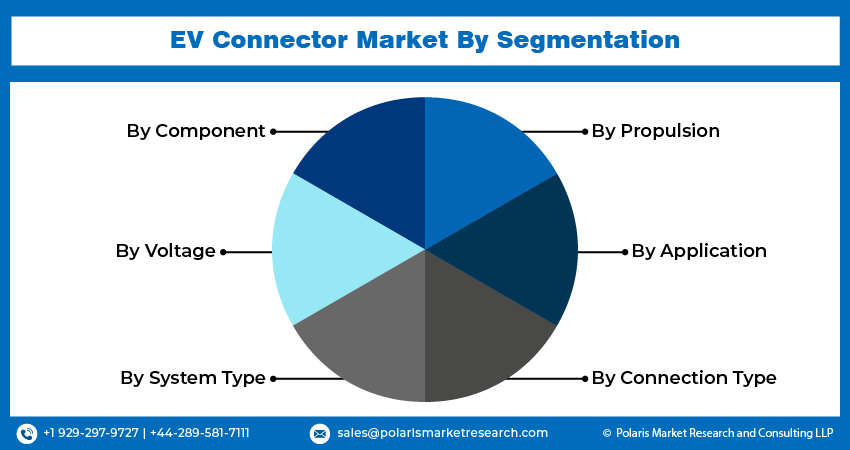
The market is primarily segmented based on component, voltage, system type, propulsion, application, connection type, and region.
| By Component | By Voltage | By System Type | By Propulsion | By Application | By Connection Type | By Region |
|
|
|
|
|
|
|
Source: Polaris Market Research Analysis
To Understand the Scope of this Report: Request Customization
Market Segmental Analysis
By Application Analysis
Battery management systems hold the largest share in 2025. These play a crucial role in ensuring optimal battery performance and extending its useful lifespan. They monitor key operational parameters, including current, voltage, and internal temperature, thereby alleviating stress on the battery by delivering the precise amount of power required by the electric vehicle's motor. Key functions of battery management systems encompass power optimization, damage minimization, and control over the battery's charging and discharging processes. In the context of Electric Vehicle (EV) connectors within the Battery Management System (BMS), they serve various critical functions such as cell monitoring, temperature sensing, voltage measurement, communication with vehicle control systems, and power distribution. EV connectors in the BMS link the monitoring circuitry of each cell to the BMS, facilitating the individual monitoring of voltage, temperature, and other parameters for each cell. Consequently, the growing production and sales of EVs are expected to drive the demand for EV connectors. Automotive Original Equipment Manufacturers (OEMs) globally are also directing their efforts toward increasing the production of electric vehicles.
For instance, in June 2023, Toyota Motor Corporation (Japan) revealed plans to globally launch next-generation Battery Electric Vehicles (BEVs) and achieve a full lineup by 2026. Connector manufacturers like Japan Aviation Electronics Industry, Ltd. (Japan), TE Connectivity (Switzerland), Hirose Electric Co., Ltd. (Japan), and Amphenol Corporation provide a range of high-voltage connectors and connector series utilized in battery management systems. These developments are anticipated to contribute to the revenue growth of the battery management systems segment within the EV connector market throughout the forecast period.
By Propulsion Analysis
The Battery Electric Vehicle (BEV) segment is anticipated to dominate a larger share of the EV connector market throughout the forecast period. BEVs necessitate a greater quantity of EV connectors compared to traditional gasoline vehicles, propelled by the intricate electrical systems inherent in BEVs, which encompass electric motors, high-voltage batteries, and various actuators and sensors. EV connectors play a pivotal role in facilitating the seamless transmission of power and data among diverse components in the BEV, ensuring reliable and efficient operation. The increasing popularity of electric vehicles (EVs) in the automotive industry has led to a heightened demand for robust battery management systems (BMS) aimed at monitoring battery cell conditions and optimizing their potential. According to the International Energy Agency (IEA), BEV car sales surged from 4.6 million units in 2021 to 7.3 million units in 2022. This upward trajectory in BEV prevalence aligns directly with the escalating demand for EV connectors, contributing to the market's expansion.
Source: Polaris Market Research Analysis
Need Granular Data Across All Market Segments? Request Customization
Market Regional Insights
The Asia Pacific region dominated the global market with the largest market share in 2025
Asia Pacific stands at the forefront of the global EV market, notably with China contributing to over half of the global EV sales. The region's swift adoption of electric vehicles, propelled by government incentives, escalating fuel prices, and a heightened environmental consciousness, is a driving force behind the escalating demand for EV-specific connectors. Prominent automotive manufacturers in the Asia Pacific, including Toyota Motor Corporation (Japan), Honda Motor Co., Ltd. (Japan), and Hyundai Motor Company (South Korea), are capitalizing on the burgeoning growth of EVs in the region. Toyota, for instance, plans to introduce ten new battery electric vehicle models by 2026 as of April 2023. In the realm of electric vehicles, EV connectors play a pivotal role in facilitating safe, efficient, and reliable operation by executing functions like power transmission, data communication, and safety measures. Consequently, the increasing prevalence of EVs in the Asia Pacific region is expected to bolster the market growth for EV connectors.
North America is anticipated to witness substantial growth opportunities in the EV connector market. The region boasts key Tier I suppliers of EV connectors, including Molex (US), TE Connectivity Ltd. (Switzerland), and Amphenol (US), among others. Consequently, the prevalence of leading EV connector manufacturers positions the region as a catalyst for the continued expansion of the EV connector market.
Source: Polaris Market Research Analysis
Curious About Regional Market Performance? Request Customization
Competitive Landscape
The EV Connector market is fragmented and is anticipated to witness competition due to several players' presence. Major service providers in the market are constantly upgrading their technologies to stay ahead of the competition and to ensure efficiency, integrity, and safety. These players focus on partnership, product upgrades, and collaboration to gain a competitive edge over their peers and capture a significant market share.
Some of the major players operating in the global market include:
- ABB
- Amphenol
- Bosch
- Fujikura
- Huber+Suhner
- Schneider Electric
- Siemens AG
- Sumitomo
- Tesla
- Yazaki
Recent Developments
- December 2025, Polycab India Limited expanded its EV portfolio by launching new AC and DC charging solutions and automotive power products at Auto EV Bharat Bengaluru, strengthening its presence in India’s growing electric mobility ecosystem and supporting the development of reliable, localized EV infrastructure nationwide.
- November 2023, Japan Aviation Electronics Industry, Ltd. unveiled the MX81 Series, a compact connector designed for in-vehicle electronic devices, including ECUs, lighting, sensors, and various other in-vehicle applications, featuring a non-waterproof design.
- September 2023, Yazaki Corporation (Yazaki) declared that Yazaki Egypt had acquired a 67,000-square-meter area in the Fayoum investment-free zone to enhance the manufacturing capacity for wire harnesses and electrical systems.
- August 2023, Sumitomo Electric Wiring Systems disclosed an investment of around USD 10.0 million in the production of harnesses, marking its status as the inaugural Tier 1 automotive company to establish operations in Tabasco, Mexico.
Report Coverage
The EV Connector market report emphasizes on key regions across the globe to provide better understanding of the product to the users. Also, the report provides market insights into recent developments, trends and analyzes the technologies that are gaining traction around the globe. Furthermore, the report covers in-depth qualitative analysis pertaining to various paradigm shifts associated with the transformation of these solutions.
The report provides detailed analysis of the market while focusing on various key aspects such as competitive analysis, component, voltage, system type, propulsion, application, connection type, and their futuristic growth opportunities.
EV Connector Market Report Scope
| Report Attributes | Details |
| Market size in 2025 | USD 3.24 billion |
| Market size in 2026 | USD 4.12 billion |
| Revenue forecast in 2034 | USD 29.15 billion |
| CAGR | 27.7% from 2026 – 2034 |
| Base year | 2025 |
| Historical data | 2021 – 2024 |
| Forecast period | 2026 – 2034 |
| Quantitative units | Revenue in USD billion and CAGR from 2026 to 2034 |
| Segments covered | By Component, By Voltage, By System type, By Propulsion, By Application, By Connection type, By Region |
| Regional scope | North America, Europe, Asia Pacific, Latin America; Middle East & Africa |
| Customization | Report customization as per your requirements with respect to countries, region and segmentation. |
Source: Polaris Market Research Analysis
Source: Polaris Market Research Analysis
Ev Connector Market FAQ's
The EV Connector Market report covering key segments are component, voltage, system type, propulsion, application, connection type, and region.
EV Connector Market Size Worth $29.15 Billion By 2034
EV Connector Market exhibiting the CAGR of 27.7% during the forecast period
Asia Pacific is leading the global market
key driving factors in EV Connector Market are Government support and initiatives are bolstering the growth of the intumescent coatings market
Download Sample Report of EV Connector Market Size, Forecast, Global, Report, 2026-2034
Please fill out the form to request a customized copy of the research report.
