
Farm Management Software Market Market Size, Share & Growth Analysis Report, 2026-2034
REPORT DETAILS
Market Statistics
Market Overview
The farm management software market size was valued at USD 3.79 billion in 2025, exhibiting a CAGR of 11.0% from 2026 to 2034. The market is driven by a increasing food demand due to rising global population and growing indoor farming. Government investments in digital agriculture and infrastructure also boost market expansion. The use of technologies like IoT, AI, and cloud computing improves farm efficiency and decision-making. This aspect fuels industry growth.
Key Insights
- The software led the market in 2025. The adoption is supported by rising demand for services such as system integration, maintenance & support, and managed services. Farmers seek interoperability with existing equipment, ERPs, and data platforms. Buyer preference is shifting toward farm management software services that combine precision agriculture software, compliance tracking, and actionable analytics. It helps them improve input efficiency and profitability.
- Precision farming led the market in 2025 due to its ability to optimize yield and resource use while addressing climate concerns.
- Web-based deployment dominated in 2025. Its low cost and easy access drives its dominance. Also, its compatibility with different farm equipment and operations helped it keep its leading position.
- North America led in 2025. The regional market growth is propelled by widespread precision agriculture practices and strong R&D investment. Also, supportive government digital agriculture programs contributed to the segment growth.
- The Asia Pacific farm management software market is expected to witness rapid growth in the coming years. Rising urbanization and increasing food demand boost the industry growth. In addition, government support for smart farming technologies drives the regional market growth.
Industry Dynamics
- Growing global food demand is pushing farmers to use software that increases productivity, reduces waste, and improves efficiency.
- Government investments in digital agriculture are boosting the use of farm management systems. They provide subsidies, training, and infrastructure to update digital farming practices.
- According to our farm management software market forecast, improvements in AI, IoT, and cloud technologies help farmers make smarter decisions. They provide predictive insights, speeding up market growth.
- High initial implementation costs and low digital literacy in rural areas limit the widespread use of farm management systems among small-scale farmers.
- Complexity involved in implementing farm management software hinders the industry growth.
- Farm software adoption barriers are data migration from legacy logs/spreadsheets, training requirements, and integration with mixed-brand equipment ecosystems. In addition, concerns of farm data security, data ownership, and connectivity reliability adversely influence buying decisions, particularly among small and mid-sized farms.
Market Statistics
- 2025 Market Size: USD 3.79 billion
- 2034 Projected Market Size: USD 9.69 billion
- CAGR (2026–2034): 11.0%
- North America: Largest market in 2025
AI Impact on Farm Management Software Market
- Artificial intelligence is used in agriculture practices to predict crop yields, weather changes, and pest risks. It enables farmers to plan better.
- With the use of sensors and cameras to catch issues early, AI technology helps track animal health and behavior
- It helps farmers use less water, fertilizer, and pesticides by analyzing what’s truly needed.
- AI turns complex farm data into easy-to-understand charts, alerts, and suggestions.
- New AI features make farm software smarter and easier to use for all types of farms.
- Adoption of AI in farm management software accelerates the shift from monitoring to prescriptive decision-making in farm operations. AI-enabled platforms merge predictive analytics in agriculture with data from various sources, such as satellite images, drone scans, IoT sensor feeds, and past farm records. They develop tailored prescriptions for various zones, incorporating nutrient plans and irrigation schedules. These prescriptions integrate seamlessly with precision farming software workflows.
- The quality of data, agricultural calibration, and dependable connectivity influence the AI effectiveness. Fragmented datasets or inadequate sensor coverage lead to variable results. It creates a need for support during implementation, training, and model validation. These aspects ensure there are steady returns on investment.
Source: Polaris Market Research Analysis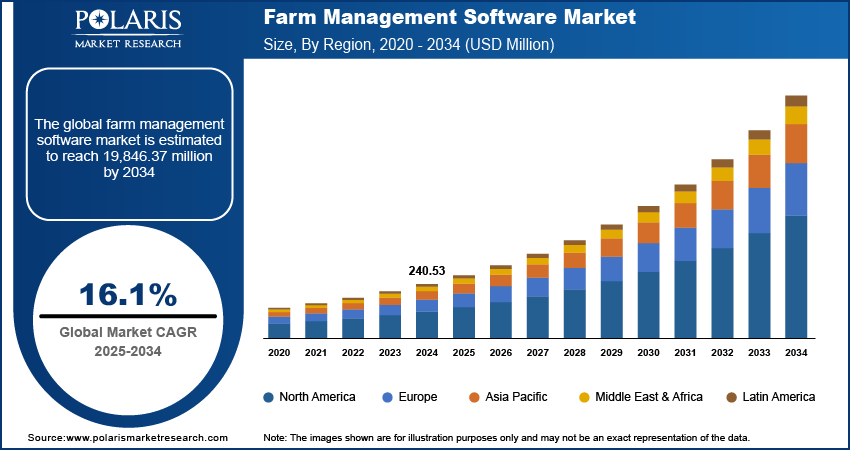
Want a Deeper Look at Key Market Players? Download Sample Report
What is Farm Management Software?
Farm management software (FMS) refers to farm management systems that digitize planning, monitoring, and optimization across crop, livestock, finance, labor, and compliance workflows. Advanced platforms function as farm analytics software and farm decision support systems. Data is generated by various devices, including GPS, weather stations, and IoT sensors. This enables users to obtain operational advice and insights into performance.
Digital agriculture software facilitates automation in business management. It helps keep records and make decisions. These benefits of the software adoption simplify farming. It collects data from different farm activities, such as crop planning, livestock management, inventory control, and financial tracking to boost productivity and profits. Farm management software replaces traditional methods like spreadsheets and paper records with centralized systems. These systems allow for real-time tracking, reporting, and analysis. Farm management software features are recording field activities and organizing crop rotation plans. They also include evaluating soil and weather data and overseeing inputs and inventory. Other capabilities include monitoring equipment upkeep, planning labor schedules, budgeting, managing farm finances, and ensuring regulatory compliance. Such features assist farmers in utilizing resources more efficiently and reducing operational risks. Farm management software allows farmers to schedule planting, track growth stages, and monitor soil health using integrated sensors and GPS tools. Many solutions work with GPS guidance, telematics, ERP/accounting tools, weather APIs, and agronomic advisory modules. It enhances end-to-end visibility across farming practices.
The rising population globally is propelling the farm management software market growth. The United Nations published data stating that the world's population is projected to continue growing for the next 50 to 60 years, peaking at approximately 10.3 billion by mid-2080. This demographic pressure increases demand for higher productivity per hectare and tighter input control. It puts pressure on farmers to optimize their operations, manage resources better, and reduce waste. Thus, there is a rising adoption of agriculture management software market solutions that improve yield forecasting, operational planning, and waste reduction. Software helps track crop performance, monitor livestock, manage finances, and simplify supply chains. It allows farmers to increase production effectively to meet rising food demand. Additionally, with larger populations, regulatory and sustainability pressures rise. Farm management software provides data-driven insights. It assists in complying with these standards while maximizing yields. Hence, as the population expands, farmers increasingly rely on technology to sustain output. It makes farm management software a critical tool for modern agriculture.
The digital agriculture software market demand is rising due to increased government spending in this area. Farmers worldwide are receiving financial support to adopt farm management software, with backing from government agritech investments. Government programs influence the adoption of these tools in three main ways: (1) offering subsidies for tools and connectivity, (2) providing digital training and extension services, and (3) upgrading infrastructure to support cloud-based farm management software at scale. More funding also speeds up research and development. This leads to innovative and user-friendly software that addresses modern farming challenges. The government approved the Digital Agriculture Mission in September 2024, with a total budget of USD 329.6 million (i.e., Rs. 2,817 Crores). Initiatives are also promoting digital literacy and improving infrastructure, like rural internet connectivity. This helps farmers use cloud-based farm management software effectively. As a result, government investments in digital agriculture drive the wider adoption of farm management software throughout the agricultural sector.
Market Dynamics
Rising Demand for Indoor Farming
Indoor farms depend on technology to monitor and adjust lighting, temperature, humidity, and nutrient levels. The technology adoption creates a large amount of data. Analysis of this data in real time becomes essential for efficient farm operations. Farm management software helps make these operations smoother by automating climate control, tracking plant growth stages, and improving resource use to increase yields. The expansion of indoor farms grows to meet rising food demands. Thus, there is a rising requirement for better tools in these farms to manage labor, inventory, and energy efficiency. Therefore, the increasing demand for indoor farming drives the farm management software market growth.
Growing Advancement in Technology
Innovations such as IoT sensors, AI-driven analytics, and cloud computing allow farmers to collect real-time data on soil health, crop conditions, and equipment performance. Such innovations propel the adoption of farm management software that processes and interprets this information. The software helps farmers forecast yields, detect diseases early, and optimize inputs with machine learning, The software adoption improves predictive capabilities. Additionally, mobile technology and user-friendly interfaces make this software accessible to small-scale farmers. These factors propel the adoption of the farm management software.
Source: Polaris Market Research Analysis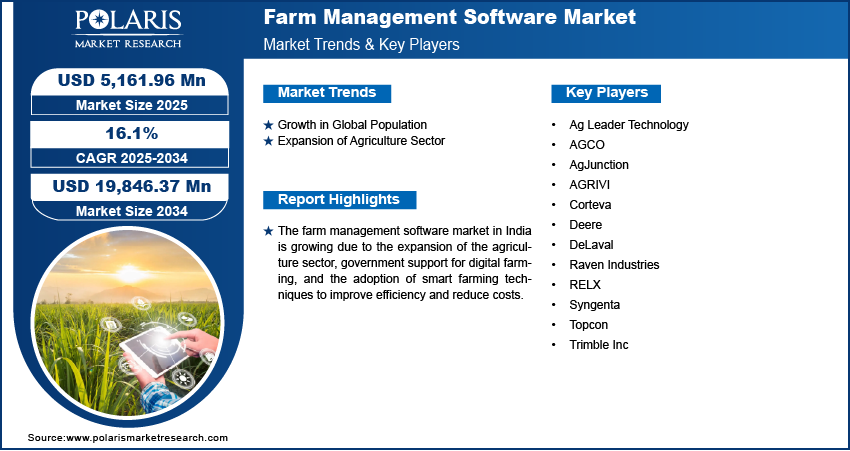
Get Full Segment-Level Forecasts & Insights: Download Sample Report
Segment Insights
By Application
Based on application, the market is divided into precision farming, livestock monitoring, smart greenhouse, and others. The precision farming segment led the farm management software market share in 2025. Rising demand to optimize yields and minimize resource waste propels the segment dominance. There is a growing focus on precision farming to improve decision-making based on real-time data. Concerns about climate change and soil degradation have increased the need for precise practices. Farmers want to boost productivity while maintaining environmental sustainability. Government programs and subsidies support smart agriculture technologies. Such initiatives encourage the use of precision farming solutions. Due to these factors, adoption of these solutions is rising in major agricultural countries such as the U.S., Brazil, India, and several European nations.
The livestock monitoring segment is expected to grow at a robust pace in the coming years. There is a rising awareness regarding the benefits of real-time animal health tracking, behavior analysis, and automated feeding systems. These technologies assist farmers and ranchers in enhancing herd efficiency and increasing profits. The integration of innovative wearables, biometric sensors, and AI-driven health forecasting tools transforms livestock management. They facilitate early identification of illnesses and reduce mortality rates. Additionally, the growing global demand for dairy and meat pushes producers to improve efficiency and animal welfare standards. Regulatory frameworks emphasizing traceability and ethical livestock practices, particularly in North America and Europe, are also driving the strong anticipated growth of livestock monitoring solutions.
By Deployment
In terms of deployment, the farm management software industry is segregated into web-based and cloud-based. The web-based segment dominated the market share in 2025. Convenient access, reduced initial expenses, and easy integration with current farming equipment and processes have led to widespread adoption. Online platforms enable farmers to oversee their operations remotely. They provide current information and help farmers make informed decisions without complicated setups or costly equipment. The access to reliable internet, even in rural areas, along with the increasing number of tech-savvy farmers, encourages the use of online systems. Furthermore, web-based farm management solutions typically come with intuitive interfaces and customizable features. From small family-run businesses to large commercial farming players leverage this deployment type according to their specific requirements.
Source: Polaris Market Research Analysis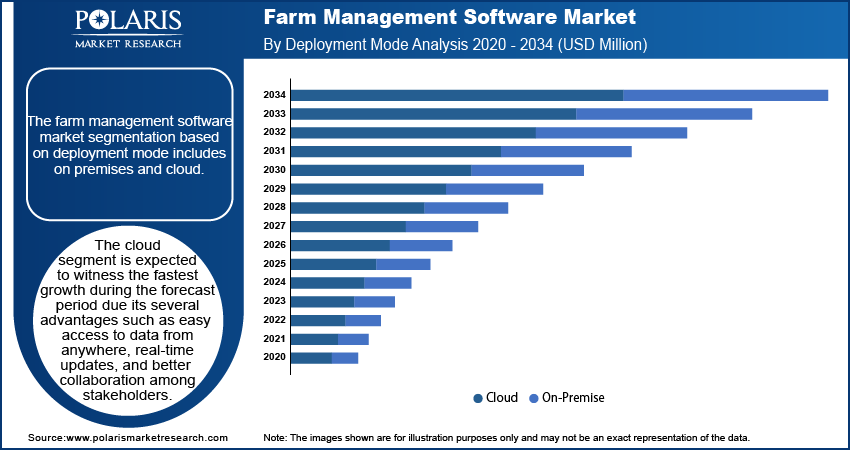
Need Granular Data Across All Market Segments? Request Customization
Comparative Analysis: Web-Based vs Cloud-Based Farm Management Software
| Dimension / Metric | Web-Based Farm Management Software | Cloud-Based Farm Management Software |
| Definition | Hosted on a central server, accessed via a web browser. | Delivered over distributed cloud infrastructure as SaaS. |
| Deployment Model | Centralized hosting (vendor or self-hosted). | Multi-tenant or hybrid cloud (AWS, GCP, Azure). |
| Pricing Model | Often fixed annual/monthly fees; custom setups possible. | Subscription tiers; scalable pay-per-use or module-based. |
| Cost Structure | License + hosting + maintenance fees; may involve CapEx. | Subscription (OpEx), tiered pricing by usage/employees/features. |
| Primary Users | Larger farms with IT capability, cooperatives, enterprises needing on-premise control. | Agriculture enterprises, agribusiness service providers, SMEs, precision agriculture adopters. |
| Access Requirements | Internet and browser; no native apps. | Internet with scalable access via web and mobile apps. |
| Maintenance & Updates | Manual patching/updates; scheduled downtime. | Continuous automatic updates with minimal disruption. |
| Data Management | Data stored on hosted servers; backup responsibility varies. | Cloud storage with automated backups, redundancy, disaster recovery. |
| Deployment Timeline | Medium; installation and configuration required. | Fast; typically ready in days/weeks. |
| Customization Flexibility | High — can be tailored to unique enterprise needs. | Moderate — configurable but less deeply customizable than bespoke systems. |
| Target Market Segment | Enterprises with internal IT and data residency needs. | Broad spectrum including mid-sized and growing farm operations. |
| Barriers to Adoption | Higher setup cost, IT dependency. | Subscription costs accumulate, dependency on internet connectivity. |
| Market Trend Direction | Stable but slower growth; niche adoption. | Rapid growth segment; preferred for digital transformation. |
| Vendor Examples (Typical) | Custom ERP integrators, on-premise agricultural management platforms. | SaaS farm management software vendors with cloud-native offerings (e.g., Trimble Ag, Granular, CropX). |
Source: Polaris Market Research Analysis
Regional Outlook
By region, the market report provides insight into North America, Europe, Asia Pacific, Latin America, and the Middle East & Africa. North America accounted for a major market share in 2025. The increasing adoption of precision farming technologies and government incentives for digital agriculture fuel the North America farm management software market expansion. Rising demand for efficient agricultural practices also boosts the expansion. armers in the region, especially large-scale operators, are quickly adopting software solutions. They use these solutions to improve crop production, manage resources better, and boost overall efficiency. Several established software providers and significant investments in research and development support this trend. Concerns about sustainability and food security, along with the increasing need to lessen environmental impact, drive the uptake of farm management software in the region.
The farm management software market in Asia Pacific is expected to expand at a robust pace in the coming years. The rapid urbanization, growing population, and the shift toward modern farming practices propel the market growth. UNFPA Asia Pacific stated that Asia and the Pacific region is home to 60% of the world’s population and is expected to increase in the future. Farmers in the region adopting farm management software to monitor crop health, and improve irrigation. The software also help them track weather patterns and forecast yields more accurately. They do this to meet the food demand of the growing population. These solutions are used to address concerns related to limited arable land, water scarcity, and lack of efficient resources. In Asia Pacific, growth trends differ by country. The farm management software market in India is shaped by government digitization programs and support systems. However, the China farm management software market growth is attributed to the rising adoption of smart farming technologies and investments in agri-tech platforms. Southeast Asia and Australia witness high adoption. The demand in these regions depends on farm size, compliance needs driven by exports, and priorities for water efficiency.
Source: Polaris Market Research Analysis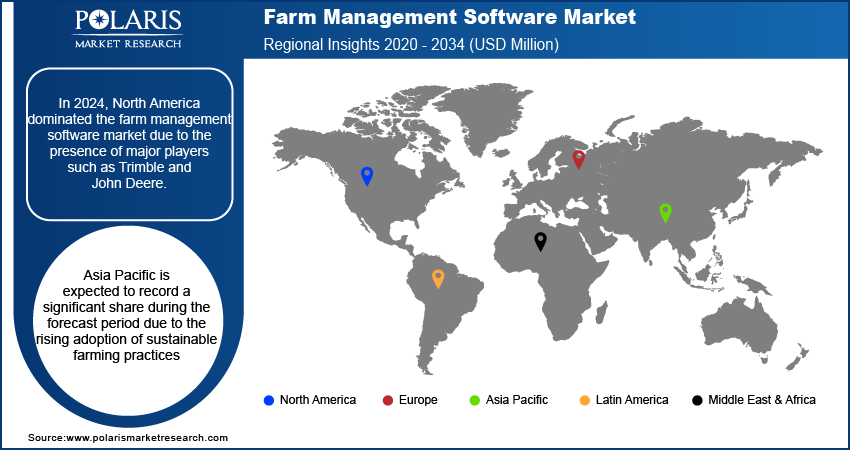
Curious About Regional Market Performance? Request Customization
Key Players and Competitive Analysis
The farm management software (FMS) market is highly competitive. Major farm management software providers focus on acquiring other companies, collaborating, and forming partnerships. They use these strategies to grow their product offerings and reach more customers. New startups push innovation with cloud-based and AI-powered FMS solutions, boosting competition. Established tech companies enter the market through partnerships. They use cloud platforms to provide scalable farm management tools. Diversifying product offerings is a crucial strategy in this market. Companies are bringing together IoT, drone analytics, and blockchain into their farm compliance software/traceability software.
The market is fragmented, with the presence of numerous global and regional farm management software companies. Major players in the market are Aegro, AgriERP, AGRIVI, AgriWebb, Agworld Pty Ltd, Bushel Inc., Conservis, Croptracker, eAgronom, Farmbrite, Navfarm, Syngenta, and xFarm Technologies.
Buyer Selection Checklist
| Evaluation Dimension | Key Buyer Focus Areas | Business Value/Impact |
| Strategic Fit | Alignment with enterprise productivity, sustainability, and compliance goals | Ensures technology supports long-term business strategy |
| Functional Coverage | End-to-end modules (crop, livestock, inventory, labor, finance) | Reduces reliance on multiple tools and manual processes |
| Module Depth | Advanced, configurable workflows and analytics per module | Supports complex multi-location operations |
| Integration Capability | ERP, accounting, IoT, GIS, satellite, equipment telematics, and APIs | Enables unified data ecosystem and automation |
| Deployment Flexibility | Cloud, hybrid, or web-based options | Supports scalability and IT governance needs |
| Offline Functionality | Field data capture with sync when connectivity returns | Maintains productivity in low-connectivity regions |
| Security & Compliance | Encryption, role-based access, and regulatory compliance | Protects sensitive business and farm data |
| Support Model | SLAs, local support, training, and customer success teams | Reduces downtime and adoption risk |
| Pricing Transparency | Clear subscription tiers, add-ons, and implementation fees | Enables accurate budgeting and TCO analysis |
| Total Cost of Ownership (TCO) | 3–5 year cost visibility, including upgrades and integrations | Supports ROI justification |
| Vendor Stability & Roadmap | Market presence, financial health, innovation pipeline | Reduces long-term vendor risk |
Source: Polaris Market Research Analysis
Key Companies:
- Aegro
- AgriERP
- AGRIVI
- AgriWebb
- Agworld Pty Ltd
- Bushel Inc.
- Conservis
- Croptracker
- eAgronom
- Farmbrite
- Navfarm
- Syngenta
- xFarm Technologies
Industry Developments
September 2025: BASF Digital Farming expanded xarvio FIELD MANAGER for AgBusiness into Argentina and Brazil, improving crop management and supporting better yields and profitability for crops like soybeans, focusing on commercial use and operational benefits.
July 2025: Topcon Agriculture introduced the UC7 Plus boom height control system to improve spraying accuracy and efficiency. Built on Norac technology, it automates boom adjustments to match terrain, helping reduce operator effort and improve field performance.
March 2025: xFarm Technologies and Checkplant, an AgTech company, joined forces. It aims to extend its reach into Latin America.
September 2024: AGRIVI partnered with the Barbados Agricultural Development and Marketing Corporation (BADMC) to introduce the innovative AI-driven advisory platform to improve the productivity and sustainability of Barbados' national agriculture.
July 2024: Syngenta launched its innovative digital agricultural platform, Cropwise. Cropwise combines advanced digital solutions to provide a complete farm management system to producers. It is expected to optimize the productivity and profitability of their operations.
Market Segmentation
By Component Outlook (Revenue, USD Billion, 2021–2034)
- Software
- Services
- System Integration & Consulting
- Maintenance & Support
- Managed Services
- Assisted Professional Services
By Application Outlook (Revenue, USD Billion, 2021–2034)
- Precision Farming
- Livestock Monitoring
- Smart Greenhouse
- Others
By Deployment Outlook (Revenue, USD Billion, 2021–2034)
- Web-Based
- Cloud-Based
By Regional Outlook (Revenue, USD Billion, 2021–2034)
- North America
- U.S.
- Canada
- Europe
- Germany
- France
- UK
- Italy
- Spain
- Netherlands
- Russia
- Rest of Europe
- Asia Pacific
- China
- Japan
- India
- Malaysia
- South Korea
- Indonesia
- Australia
- Vietnam
- Rest of Asia Pacific
- Middle East & Africa
- Saudi Arabia
- UAE
- Israel
- South Africa
- Rest of Middle East & Africa
- Latin America
- Mexico
- Brazil
- Argentina
- Rest of Latin America
Farm Management Software Market Report Scope
| Report Attributes | Details |
| Market Size in 2025 | USD 3.79 billion |
| Market Size in 2026 | USD 4.20 billion |
| Revenue Forecast in 2034 | USD 9.69 billion |
| CAGR | 11.0% from 2026 to 2034 |
| Base Year | 2025 |
| Historical Data | 2022–2024 |
| Forecast Period | 2026–2034 |
| Quantitative Units | Revenue in USD billion, 2021–2034 and CAGR from 2026 to 2034 |
| Report Coverage | Revenue Forecast, Market Competitive Landscape, Growth Factors, and Trends |
| Segments Covered |
|
| Regional Scope |
|
| Competitive Landscape |
|
| Report Format |
|
| Customization | Report customization as per your requirements with respect to countries, regions, and segmentation. |
Source: Polaris Market Research Analysis
Farm Management Software Market FAQ's
The global farm management software industry is projected to reach USD 9.69 billion by 2034, at a CAGR of 11.0%.
North America leads the market share. Large farm operations and advanced technology adoption drive the regional market growth. Strong digital infrastructure fuels the dominance.
Market participants emphasize the significance of integrating various technologies such as AI, IoT, machine learning, cloud computing, and big data analytics. These technologies enable real-time observation, accurate agricultural practices, and well-informed choices for farmers.
Precision farming dominates the market share. It allows for crop scouting, monitoring yield, mapping fields, and applying fertilizer at varying rates more efficiently.
Limited technical expertise and high initial costs hinder the software adoption. Also, lack of digital literacy among small farmers restrain the demand for FMS. Insufficient infrastructure in developing regions hinder adoption restricts the market growth.
The livestock monitoring segment is expected to grow at the fastest pace in the coming years.
Download Sample Report of Farm Management Software Market
Please fill out the form to request a customized copy of the research report.
