
Reports

Fill Finish Manufacturing Market Share, Size, Trends, Industry Analysis Report, 2026 - 2034
REPORT DETAILS
REPORT DETAILS
ABOUT THIS REPORT
Market Statistics
Market Overview
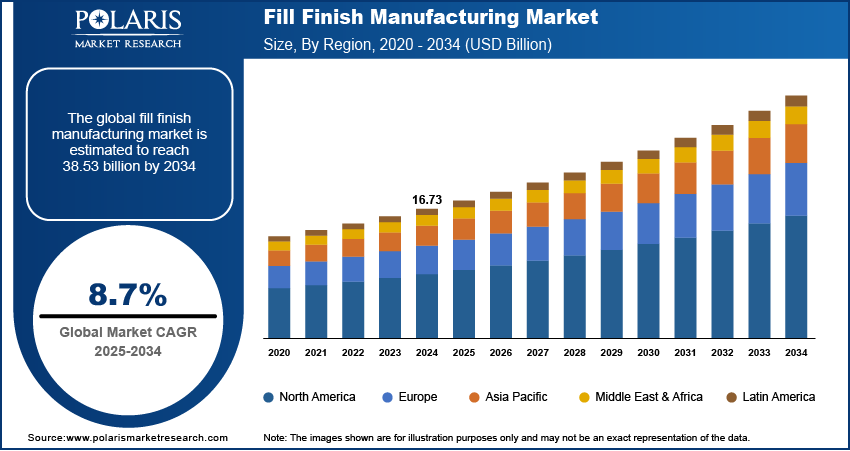
The global fill finish manufacturing market was valued at USD 18.25 billion in 2025 and is expected to grow at a CAGR of 8.8% during the forecast period. The growing demand for fill finish manufacturing is expected to be driven by rising demand for affordable drugs and increasing adoption of prefilled syringes.
Fill finish manufacturing is an important last step in pharmaceutical and biologics production, in which sterile drug substance vessels, including vials, prefilled syringes, ampoules, and cartridges, are handled in a controlled environment. As injectables, biologics, and vaccines have become more sophisticated, the importance of aseptic fill finish operations has also increased. It is considered a key process for maintaining drug product quality and effective drug supply chains.
Key Insights
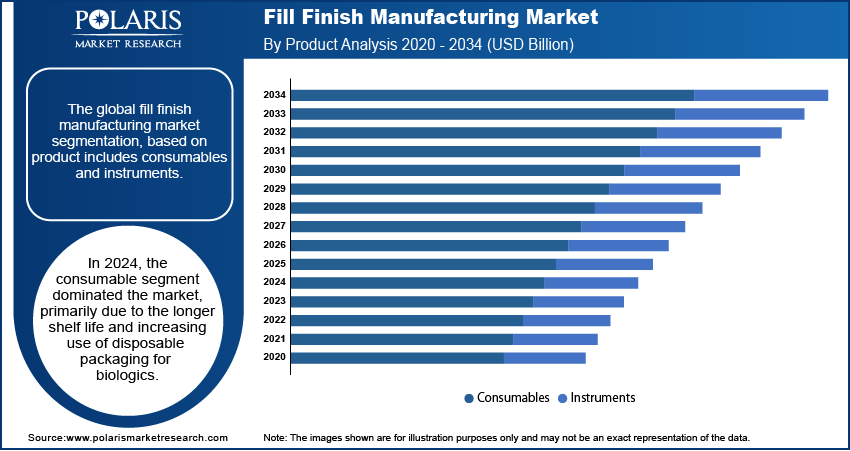
- In 2025, the consumables segment dominated the fill finish manufacturing market, primarily due to the longer shelf life and increasing use of disposable packaging for biologics. Consumables such as prefilled syringes and sterile vials reduce the risk of contamination and eliminate the burden of cleaning validation. Therefore, these products are highly preferred in biologics fill finish manufacturing and injectable fill finish packaging.
- The contract manufacturing organization (CMO) segment is expected to witness rapid growth during the forecast period. This is due to the rise in adoption of new medications and the outsourcing of the manufacturing of drug substances. The trend of increasing pharmaceutical outsourcing underpins this, as CMOs can offer specialized sterile facilities, strong regulatory expertise, and flexible fill finish manufacturing capabilities.
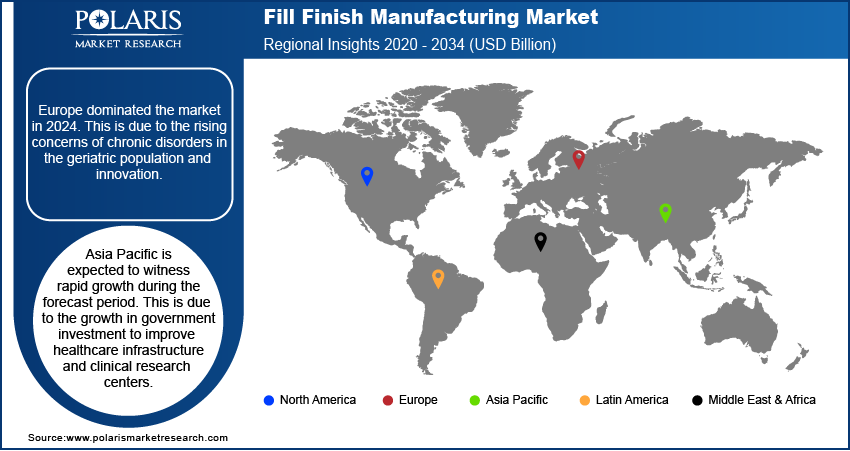
- Europe dominated the market in 2025. This is due to the rising concerns of chronic disorders in the geriatric population and innovation.
- Asia Pacific is expected to witness rapid growth during the forecast period. This is due to increased government investment in healthcare infrastructure and clinical research centers.
Industry Dynamics
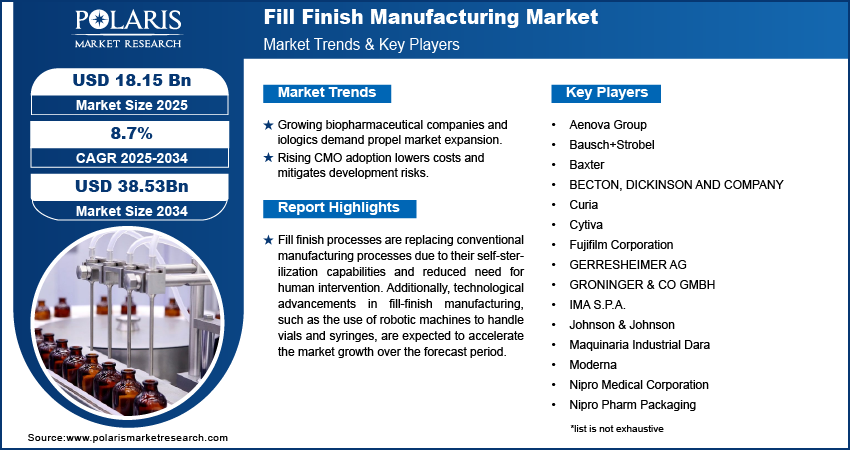
- The increasing number of biopharmaceutical companies and the growing demand for biologics drive the market demand.
- Biologics, mRNA therapy, and personalized medicine require very precise and sterile fill finish operations. Therefore, there is a growing need for advanced fill finish manufacturing capabilities in both emerging and mature markets.
- Implementing automation, robots, and AI-based inspection activities for the fill finish process requires significant investment. Small- and mid-sized pharmaceutical manufacturing companies face difficulty adopting advanced sterile technologies, such as Isolators and RABS, due to implementation and validation costs.
- This rise in personalized medicines and small-batch biologics is driving a growing demand for highly flexible, modular, and single-use fill finish manufacturing technology. This trend is also opening up opportunities for specialized CDMOs.
Market Statistics
2025 Market Size: USD 18.25 billion
2034 Projected Market Size: USD 39.09 billion
CAGR (2026-2034): 8.8%
Largest market in 2025: Europe
To Understand More About this Research: Download Sample Report
AI Impact on Fill Finish Manufacturing Market
- Artificial intelligence (AI) increases the accuracy and consistency of filling and sealing, helping eliminate product waste.
- AI spots errors early by monitoring patterns in production, reducing the risk of recalls and reworks.
- It speeds up operations by optimizing line performance and reducing unplanned downtime.
- Facilitates decision-making by interpreting production data to provide clear insights.
Fill finish processes are replacing conventional manufacturing processes due to their self-sterilization capabilities and reduced need for human intervention. Additionally, technological advancements in fill finish manufacturing, such as the use of robotic machines to handle vials and syringes, are expected to accelerate the market growth over the forecast period.
Furthermore, robotic production requires less maintenance, resulting in end products that are reliable and clean during aseptic fill finish. This reduces operating costs and propels market growth, as product quality and safety are the primary concerns. Fill finish production of end pharmaceutical products with sterilization and reduced human contact boosts market growth. These are mainly operated on isolators and restricted-access barrier systems (RABS), which help prevent contamination of the environment. These systems offer a more efficient environment for manufacturing various biopharmaceutical products, but come at a higher price. Most small-scale companies find it challenging to adopt these technologies due to their high cost and therefore seek alternatives, which restrains market development.
Technology & Process Analysis
Aseptic fill finish production increasingly employs advanced technologies such as robotic filling systems, isolators, and restrictive access barrier systems. These technologies have reduced human interaction in the fill finish process while minimizing the risk of product contamination. They have helped enhance production efficiency and reduce product losses. They help improve regulatory compliance, especially for high-value biologics and injectables.
Industry Dynamics
Growth Drivers
The global fill finish manufacturing market is driven by the increasing number of biopharmaceutical companies and the growing demand for biologics in both developed and developing nations. In addition, while manufacturing various biopharmaceutical products, novel procedures and equipment play a crucial role in maintaining product integrity throughout the fill finish process, thereby boosting market growth.
The increasing adoption of contract manufacturing organizations (CMOs) by various biotech companies is also considered a significant factor driving market expansion. Many small-scale biotechnological and biopharmaceutical companies are inclined to outsource their fill finish operations to CMOs, as the overall development costs are borne by both the CMO and the company, thereby reducing risk.
Moreover, CMOs have strong technical skills, which help drive innovation in drug discovery and maintain financial stability. For instance, Berkshire's sterile manufacturing CMO developed a new sterile fill finish procedure for clients with limited drug products. It was observed that 1.1 L of drug product is expected to be produced in a single run, which ultimately reduced product loss.
Segmental Insights
Product Analysis
The fill finish manufacturing market by product is segmented into consumables and instruments. The consumables segment accounted for the highest revenue share in 2025, owing to a longer shelf life and the rising use of disposable packaging for biologics. In addition, prefilled syringes (PFS) are expected to support market revenue growth due to the growing adoption of PFS across various applications, such as lyophilization, and the increasing outsourcing of fill finish. Prefilled syringes offer accurate dosing and reduce medication waste. They also work well with complex biologics. Their growing use in self-administration treatments is further contributing to the prefilled syringe fill finish market growth.
End Use Analysis
By end use, the fill finish manufacturing market is segmented into pharmaceutical & biopharmaceutical companies, contract manufacturing organizations, research & development laboratories, and academic research institutions. The contract manufacturing organizations segment is expected to witness the fastest growth during the forecast period, owing to the increasing number of new medications and outsourcing of drug substance manufacturing. In addition, CMO offers drug development services and supports drug innovation throughout the pharmaceutical industry's manufacturing process, an essential factor in propelling the market. Moreover, CMO expertise not only reduces financial risk but also enables pharmaceutical and biologics companies to outsource production, improving process effectiveness and accelerating growth.
Regional Analysis
Europe Fill Finish Manufacturing Market Insights
Europe accounted for the largest share in 2025 owing to the rising concerns of chronic disorders in the geriatric population and innovation in various drug developments. In addition, growing R&D investments in developing affordable biologics in regions such as France, Italy, and Germany are expected to drive market growth. Europe has established itself as a key hub for high-quality fill finish manufacturing operations, driven by the presence of well-established pharma companies and high regulatory standards in the region.
Asia Pacific Fill Finish Manufacturing Market Assessment
Asia Pacific is expected to witness the fastest growth during the forecast period due to growing government investment in improving healthcare infrastructure and clinical research Centers. In addition, the growing adoption of contract manufacturing organizations by many leading pharmaceutical companies and the increasing construction of fill finish plants in regions such as China, Japan, and India are expected to drive market growth. The market also benefits from favorable government policies and lower production costs across key economies in the region.
Competitive Insights
Major players in the fill finish manufacturing market are increasing their capacity, modernizing automation technology, and adding fill finish equipment focused on biologics to meet increasing demand from pharmaceutical and biotech companies worldwide.
Some of the leading fill finish manufacturing market players include Aenova Group, Bausch+ Strobel, Baxter, Becton, Dickinson and Company, Curia, Cytiva, Fujifilm Corporation, GERRESHEIMER AG, GRONINGER & Co. GmbH, IMA S.P.A., Johnson & Johnson, Maquinaria Industrial Dara, Moderna, Nipro Medical Corporation, Nipro Pharm Packaging, Optima Packaging Group GmbH, Piramal Pharma Solutions, Robert Bosch GmbH, Schott AG, SGD Pharma, Stevanato Group, Thermo Fisher Scientific, and West Pharmaceutical Services.
List Of Key Companies
- Aenova Group
- Bausch+ Strobel
- Baxter
- Becton, Dickinson and Company
- Curia
- Cytiva
- Fujifilm Corporation
- GERRESHEIMER AG
- GRONINGER & Co Gmbh
- IMA S.P.A.
- Johnson & Johnson
- Maquinaria Industrial Dara
- Moderna
- Nipro Medical Corporation
- Nipro Pharm Packaging
- Optima Packaging Group GmbH
- Piramal Pharma Solutions
- Robert Bosch GmbH
- Schott AG
- SGD Pharma
- Stevanato Group
- Thermo Fisher Scientific
- West Pharmaceutical Services
Industry Developments
- December 2024: Novo Holdings completed its USD 16.5 billion acquisition of Catalent, creating a dominant presence in GLP-1 fill finish capacity.
- October 2024: Lonza finalized its USD 1.2 billion purchase of Roche’s Vacaville plant and committed CHF 500 million to next-generation upgrades.
- September 2024: Fill Finish Technology collaborated with KBiotech. The collaboration enables their capability to bring together project expertise with innovative equipment solutions.
- March 2022: SGD Pharma launched its ready-to-use sterile 100 ml molded glass vials, which protect drug stability and eliminate scratches on vials to enhance visual inspection. These type I molded glass vials are used for fill finish parental drug products.
- February 2022: Moderna and Thermo Fisher Scientific entered a long-term strategic collaboration to scale up the range of aseptic fill finish manufacturing for Spikevax, Covid-19 vaccines, and other mRNA medicines in the U.S.
Market Segmentation
By Product Outlook (Revenue, USD Billion, 2021–2034)
- Consumables
- Prefilled Syringes
- Glass PFS
- Plastic PFS
- Vials
- Glass Vials
- Plastic Vials
- Cartridges
- Other Consumables
- Prefilled Syringes
- Instruments
- Systems
- Integrated Systems
- Standalone Systems
- Machine Type
- Automated Machines
- Semi-Automated & Manual Machines
- Systems
By Application Outlook (Revenue, USD Billion, 2021–2034)
- Vaccine Filling
- Parenteral Drug Filling
- Biopharmaceuticals Filling
- Diagnostic Product Filling
By End-Use Outlook (Revenue, USD Billion, 2021–2034)
- Pharmaceutical & Biopharmaceutical Companies
- Contract Manufacturing Organizations
- Research & Development Laboratories
- Academic Research Institutions
By Regional Outlook (Revenue, USD Billion, 2021–2034)
- North America
- US
- Canada
- Europe
- Germany
- France
- UK
- Italy
- Spain
- Netherlands
- Russia
- Rest of Europe
- Asia Pacific
- China
- Japan
- India
- Malaysia
- South Korea
- Indonesia
- Australia
- Vietnam
- Rest of Asia Pacific
- Middle East & Africa
- Saudi Arabia
- UAE
- Israel
- South Africa
- Rest of Middle East & Africa
- Latin America
- Mexico
- Brazil
- Argentina
- Rest of Latin America
Fill Finish Manufacturing Market Report Scope
| Report Attributes | Details |
| Market Size in 2025 | USD 18.25 billion |
| Market Size in 2026 | USD 19.84 billion |
| Revenue Forecast by 2034 | USD 39.09 billion |
| CAGR | 8.8% |
| Base Year | 2025 |
| Historical Data | 2021–2024 |
| Forecast Period | 2026–2034 |
| Quantitative Units | Revenue in USD billion, and CAGR from 2026 to 2034 |
| Report Coverage | Revenue Forecast, Market Competitive Landscape, Growth Factors, and Trends |
| Segments Covered |
|
| Regional Scope |
|
| Competitive Landscape | Fill Finish Manufacturing Industry Trend Analysis (2025) Company profiles/industry participants profiling include company overview, financial information, product/service benchmarking, and recent developments |
| Report Format | PDF + Excel |
| Customization | Report customization as per your requirements with respect to countries, regions, and segmentation. |
FAQ's
The fill finish manufacturing market stood at USD 18.25 billion in 2025. The market is projected to account for a CAGR of 8.8% between 2026 and 2034.
Fill finish manufacturing is the final pharmaceutical production stage. Here, sterile drugs are filled into containers, sealed, and packaged for distribution.
The fill finish manufacturing market is driven by the rising demand for affordable drugs and increasing adoption of prefilled syringes. The market also benefits from technological advancements in robotic automation.
The consumables segment leads the market due to longer shelf life and rising use of disposable packaging for biologics.
Europe leads the market for fill finish manufacturing due to innovations in various drug developments across the region.
The contract manufacturing organization (CMO) segment is expected to witness rapid growth during the forecast period.
Download Sample Report of Fill Finish Manufacturing Market
Please fill out the form to request a customized copy of the research report.
