

Overview
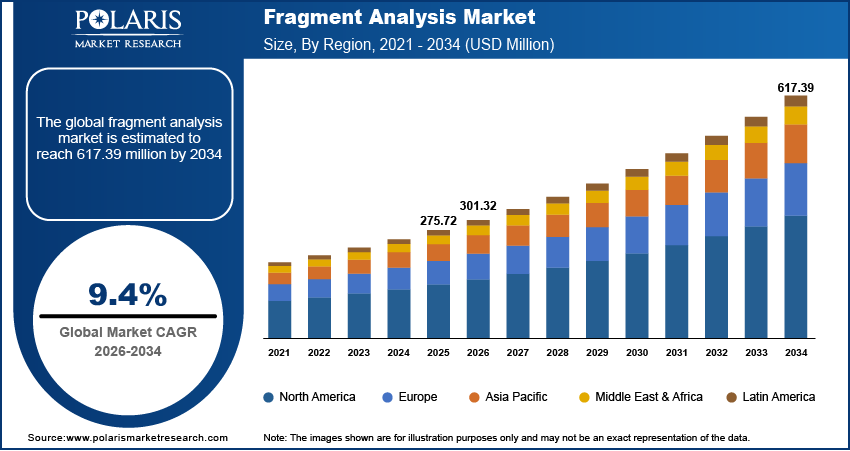
The global fragment analysis market is estimated around USD 275.72 million in 2025, with consistent growth anticipated during 2026–2034. Growing biotechnology and biopharmaceutical R&D pipelines coupled with increasing academic and research funding, the market is projected to grow at a moderate 9.4% CAGR during the forecast period.
Future Demand Scenarios
- Base scenario: demand grows steadily with routine adoption in clinical genetics, oncology testing, forensic workflows, and academic research, supported by stable instrument placements and consumable usage.
- Upside scenario: accelerated uptake of high-throughput platforms, wider integration of fragment-based assays in precision oncology, rapid expansion of population genomics programs, and increased deployment of automated data-analysis ecosystems.
- Conservative scenario: slower capital spending by laboratories, delays in research funding cycles, and reduced test volumes across clinical and forensic laboratories.
Key Insights
- The capillary electrophoresis segment held the largest share of the market in 2025 due to its entrenched status as the authoritative method for size-based DNA separation.
- PCR continues to advance as the foundational amplification engine underlying nearly every fragment analysis workflow.
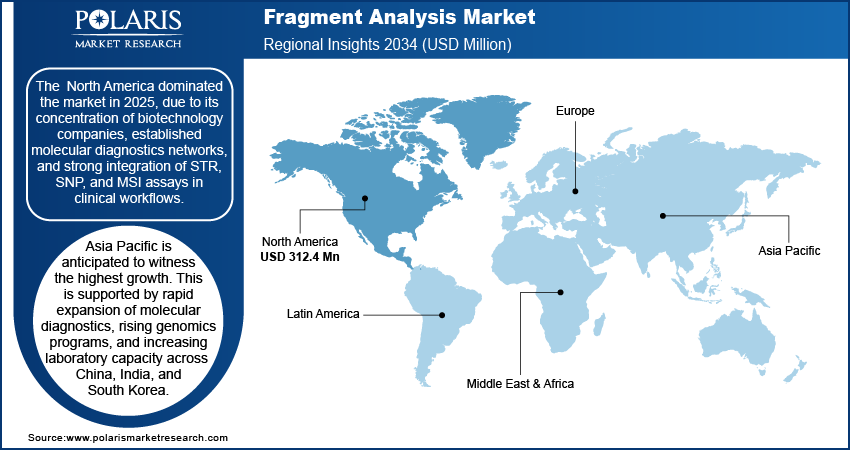
- The North America dominated the market in 2025 due to its strong biotechnology base, mature diagnostics networks, and widespread use of STR, SNP, and MSI assays in clinical settings
- North America is anticipated to witness the highest growth. This is owing to fast-growing molecular diagnostics activity, expanding genomics programs, and rising laboratory capacity across China, India, and South Korea.
Industry Dynamics
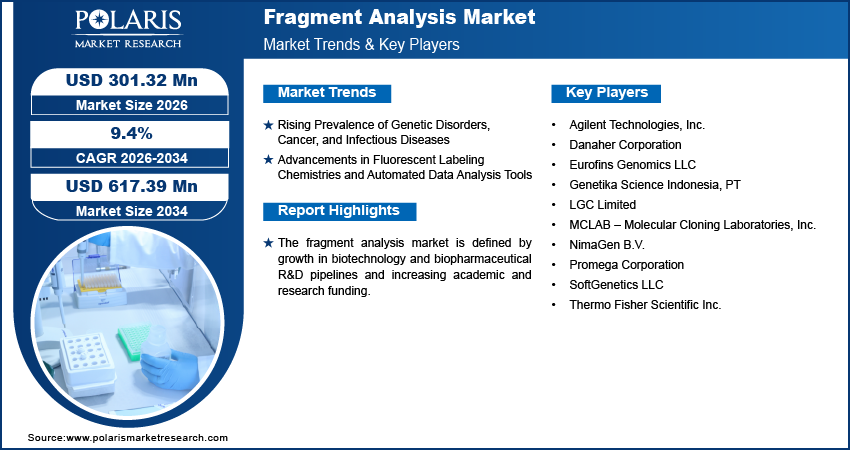
- Rising incidence of genetic disorders, cancer, and infectious diseases
- Improvements in fluorescent labeling and automated analysis tools
- Expanding biotech and biopharma R&D using MSI testing and CRISPR validation
- Higher academic and research funding in genomics and molecular biology
Market Statistics
- 2025 Market Size: USD 275.72 million
- 2034 Projected Market Size: USD 617.39 million
- CAGR (2026-2034): 9.4%
- North America: Largest market in 2025
What is Fragment Analysis and Why It Matters
Fragment analysis is a foundational genomic measurement technique that delivers high-clarity size resolution across nucleic acid fragments. It underpins DNA fragment analysis, RNA fragment analysis, microsatellite analysis, STR analysis, and MSI testing-functioning as an integral input to high-confidence workflows in research, clinical diagnostics, and forensic applications. Demand is accelerated in oncology, hereditary testing, population genetics, and forensic identification, impelled by the growing requirements for accurate and reproducible sizing of nucleic acids. Ensure safe and optimal access to best-in-class fragment analysis resources, and thus maintain data integrity and continuity and a position of competitive strength in a high-quality molecular market.
Fragment Analysis Workflow:
Fragment analysis follows a systematic laboratory workflow designed to obtain correct size-based genetic information. Each step enhances data clarity, reproducibility, and interpretability.
-
Sample Extraction
It starts with DNA or RNA extraction. Clinical labs provide samples usually from blood, tissue, or swabs, while research and agricultural programs obtain it from plants or animals. The quality here directly affects results downstream as contaminants or degraded nucleic acids stop amplification and the separation of fragments.
-
PCR Amplification and Fluorescent Labeling
These nucleic acids then move to fragment analysis, where a specific region is targeted by using primers. The primers carry fluorescent dyes incorporated into the fragments generated. Labeling is a necessary step, given that it is the signal detected by the instrument later on. Multiplex PCR reactions permit a number of regions to be amplified in one run, enhancing efficiency without increasing the volume of samples.
-
Separation Through Capillary Electrophoresis (CE)
After amplification, fragments are injected into a thin capillary filled with polymer. Capillary electrophoresis fragment analysis separates fragments based on length. The smaller fragments travel faster, while larger pieces move more slowly. This separation based on size is essentially the principle of the technique. Several capillaries are supported in the modern electrophoresis systems, which allow a semi-automated high-throughput run with consistent performance.
-
Data Collection and Peak Calling
The fluorescent signal is detected as the fragments pass through the capillary. These signals are then converted into peaks on an electropherogram by the system. Each peak denotes a fragment. For the companies Thermo Fisher, Agilent, and Sciex, automated detection and processing of the signals are done by their genetic analyzers. This flow from raw signal to peak profile is the backbone of the analytical workflow.
-
Size Estimation and Allele Calling
The peaks are compared with a size standard to estimate fragment length. Fragment analysis software, like GeneMapper, PeakScanner, and similar platforms, automatically carry out allele calling, sizing, and profile assignment. The final product consists of fragment sizes, allelic labels, and quality values useful for interpreting results in a clinical, forensic, or scientific capacity.
6. Instruments and Software Involved
Fragment analysis is carried out on the basis of genetic analyzers, electrophoresis, and specialized platforms. High-quality capillary electrophoresis equipment is a key factor in precise separation and resolution of fragments. Software tools support automated data interpretation with minimal operator error and reporting format standardization. These systems together permit efficient processing by laboratories in large batches of samples with reproducibility.
7. Key Quality Parameters
Fundamental performance measures surround the basis of accuracy in fragment analysis. Precision reflects the consistency of sizing generated through multiple runs of any given sample. Resolution determines how well closely sized fragments are distinguished. Reproducibility ensures that different analysts or instruments produce comparable results. These parameters matter as clinical and forensic applications rely on dependable fragment sizing to make informed decisions.
Fragment Analysis Applications
Fragment analysis serves as a fast, size-centric genetic profiling strategy that fits clinical, forensic, and research settings where length variation carries direct interpretive value. The technique remains widely used as it delivers stable outputs, accommodates high sample volumes, and avoids the operational burden of full sequencing.
Clinical Testing
Diagnostic groups use fragment sizing techniques for PGT-M, prenatal testing, and MSI analysis. The sensitivity for size changes in repeats allowing for reliable testing for embryos, prenatal evaluation for abnormal conditions in the fetus, and cancer pathway identification. Laboratories use this technique to achieve fixed turnaround times for standardized companion diagnostic testing.
- Case Study Snippet
A cancer center began using MSI testing by fragment analysis as a way of lessening reliance on outside sequencing labs. The shift cut per-sample cost by more than half and improved reporting times from five days to under 48 hours. The shorter turnaround improved therapy selection decisions for oncology teams.
Forensics and Paternity
STR profiling central to criminal identification and kinship verification depends on fragment length patterns. Forensic analysts employ automated CE platforms to enhance stability in processing volumes and eliminate evidentiary backlogs.
- Case Study Snippet
A state forensic lab upgraded to a 24-capillary CE system for STR profiling. The transition allowed analysts to clear over 30 percent of the backlog within three months by enabling reliable high-throughput fragment processing.
Research and Agriculture
Researchers apply SNP, VNTR, and related assays to characterize population structure, developmental traits, and genomic variability. Breeding programs use fragment analysis to verify parentage, track markers, and evaluate large cohorts with minimal cost.
- Case Study Snippet
A seed development company adopted a fragment-based VNTR genotyping technique that enabled the screening of a large number of plant samples for drought-tolerant genetic markers. This made it possible for the company to boost the process of product development and accelerate the product development cycles.
Technologies Used in Fragment Analysis
The analysis of fragment data relies on a suite of methods that serve a common purpose of detecting differences in size of DNA or RNA molecules. These technologies determine throughput, resolution, operational cost, and the overall reliability of results. Laboratories choose specific platforms based on testing volume, workflow design, and the depth of analysis required.
-
Capillary Electrophoresis (Core Method)
Capillary electrophoresis is the structural backbone of fragment analysis, allowing for high-resolution separation through polymer-filled capillaries. This separates fragments by their speed of migration under an applied electric field. Fluorescently tagged PCR products generate sharp peak profiles, while multi-capillary instruments elevate throughput without expanding instrument footprint. This creates a stable platform for STR profiling, MSI assessment, and routine genotyping across clinical and forensic environments that depend on uniformity and reproducibility.
-
PCR-Based Fragment Analysis
PCR amplification informs the upstream structure of fragment workflows by enriching target loci and allowing multiplexed reactions that collapse multiple assays into a single, dye-encoded system. This reduces reagent load, compresses hands-on intervals, and affords laboratories configuration control over primers, dye combinations, and panel structures. High-resolution melt analysis sometimes enters the workflow as a preliminary screen, filtering straightforward variants before CE-based sizing delivers definitive outputs.
-
Fragment Analysis vs NGS vs Sanger Sequencing
Fragment analysis a performance tier between the precision of Sanger sequencing and the expansive depth of NGS, offering speed, cost efficiency, and stability for size-based variants that do not require sequence-level detail. NGS excels in complex variant landscapes and broad genomic interrogation, while Sanger remains valuable in targeted, low-throughput confirmation. Laboratories integrate these methods strategically, selecting fragment analysis where length variation is the primary analytical determinant and reserving sequencing platforms for interpretive demands that exceed size measurement alone.
Fragment analysis signifies a performance level between the precision of Sanger sequencing and the broad scope of NGS that offers speed, economy, and reproducibility of size variants that do not require sequence information. NGS is better suited to complex variants and whole genomic analyses, while Sanger sequencing is useful for targeted analyses. These technologies are effectively used in the lab in terms of fragment analysis being used depending on the relevance of length information to the final result and sequencing being used depending on the level of interpretation required.
|
Parameter |
Capillary Electrophoresis (CE) |
PCR-Based Fragment Analysis |
NGS |
Sanger Sequencing |
|
Primary Function |
Size-based separation of fluorescently labeled fragments |
Target amplification and multiplexing for CE |
High-depth sequence-level detection |
Targeted sequence confirmation |
|
Resolution |
1–2 bp length differentiation |
Primer-dependent; prepares input for CE |
Single-nucleotide across broad regions |
Single-nucleotide precision |
|
Ideal Use Cases |
STR profiling, MSI testing, VNTR sizing, genotyping |
Research panels, clinical assays, multiplex workflows |
Comprehensive mutation profiling, large genomic panels |
Variant confirmation, low-throughput diagnostics |
|
Throughput |
Moderate–high (multi-capillary) |
Moderate |
Very high |
Low |
|
Turnaround Time |
Hours |
Hours |
1–3 days |
Hours–1 day |
|
Operational Complexity |
Medium |
Low–medium |
High |
Low–medium |
|
Scalability |
Strong with multi-capillary CE |
Strong |
Very strong |
Limited |
|
Data Output |
Electropherogram peak profiles |
Amplified fragments |
FASTQ/BAM sequence files |
Chromatograms |
|
Cost Tier Instrument |
USD 45,000–300,000 |
USD 5,000–40,000 |
USD 50,000–1,000,000+ |
USD 60,000–150,000 |
|
Cost Tier Per Sample |
USD 8–20 |
USD 1–3 |
USD 80–1,200+ (panel/WGS dependent) |
USD 6–12 |
|
Cost Tier Operational Level |
Medium |
Low |
Very high |
Medium |
Drivers & Opportunities
Rising Prevalence of Genetic Disorders, Cancer, and Infectious Diseases
Fragment analysis demand grows as clinicians face rising caseloads involving hereditary disorders, oncology diagnostics, and pathogen tracking. Laboratories need high-resolution sizing to detect allelic shifts with clarity. Cancer incidence projections intensify this requirement. The World Health Organization predicts over 35 million new cancer cases by 2050, a drastic 77% increase from the estimates for 2022. This growth compels laboratories toward faster, high-precision systems. Short analytical cycles are of great relevance. Precise discrimination of minimal fragment variations is crucial for clinical decision pathways.
Advancements in Fluorescent Labeling Chemistries and Automated Data Analysis Tools
Advancements in labeling chemistries are pushing the performance ceiling of fragment analysis platforms. Stability, signal consistency, and positional accuracy are variously improved with next-generation fluorescent architectures. In November 2025, IOCB Prague researchers introduced a method of "Stick and Glue" that anchors the dyes at fixed molecular sites and then locks them through light activation. The resulting tags are stable inside living cells and yield sharper outputs. This stability yields cleaner electropherograms and improves allele-calling accuracy. Automated analytics systems further streamline the workflows. Cumulatively, these improve throughput and allow reliable multiplexing in challenging genomic applications.
Advantages, Limitations and Buying Considerations
Fragment analysis maintains its position in clinical, forensic, and research environments due to its stable performance, together with controlled operational costs and well-established pathways for validation & accreditation, such as CLIA and IVDR. Laboratories adopt it where the only requirement is a size-based genetic signal that are clearly presented without the overhead of sequencing technologies. Its relative strengths and boundaries drive purchasing strategies, instrument configuration decisions, and overall workflow design.
Why Labs Still Choose Fragment Analysis
Labs continue to depend on their use of fragment analysis as they provide fast, size-based genotyping with predictable turnaround times and excellent adaptability to regulated lab processes. The process is easily scalable from a small number of samples to a large number through the availability of kit reagents for fragment analysis and specialized software that supports automated allele analysis in the process. The factors play an essential part in ensuring stable operating costs, easy interpretation, and the promotion of regulatory compliance requirements.
Vendor Selection Checklist
|
Evaluation Category |
Key Criteria to Review |
What the Lab Should Verify |
|
Instrument Performance & Configuration |
Capillary count, run speed, resolution stability, automation features |
Confirm alignment with testing volume; assess reliability during peak load; evaluate support for lab workflow automation |
|
Instrument Buying Guide Factors |
Footprint, maintenance requirements, service contracts, upgrade options |
Ensure vendor provides transparent lifecycle costs, responsive technical support, and scalable hardware paths |
|
Fragment Analysis Kits |
Availability of validated STR, MSI, and genotyping kits; compliance documentation |
Verify kit compatibility with chosen instrument and accreditation frameworks (CLIA, IVDR) |
|
Reagents for Fragment Analysis |
Polymer types, fluorescent dye chemistry, primer compatibility, batch-to-batch consistency |
Confirm predictable sizing performance, supply stability, and competitive pricing models |
|
Software & Data Management |
Automated allele calling, QC tools, LIMS integration, reporting features |
Check that software reduces manual review burden and supports standardized audit-ready output |
|
Validation & Accreditation Requirements |
Vendor-provided validation data, QC materials, regulatory certificates (CLIA, IVDR) |
Ensure documentation supports internal validation, external audits, and accreditation renewals |
|
Workflow Compatibility & Integration |
Fit with existing extraction, PCR, and downstream systems |
Validate cross-platform compatibility and minimal workflow disruptions during onboarding |
|
Training & Technical Support |
Onsite/remote training, troubleshooting response times, protocol support |
Confirm vendor expertise and long-term assistance availability for method optimization |
|
Operational Consumable Costs |
Instrument cost, per-sample consumable pricing, long-term reagent costs |
Assess total cost of ownership across multi-year operation, including service and consumable commitments |
|
Scalability & Future Expansion |
Availability of high-capillary upgrades, optional modules, or workflow expansions |
Ensure instrument and kits scale with growing test volumes or new assay additions |
|
Outsourcing vs. In-House Support |
Availability of vendor-affiliated service labs or reference testing |
Determine whether external services are viable for low-volume or overflow scenarios |
When Fragment Analysis Is Not Enough
Fragment analysis is limiting when laboratories need sequence-level granularity, such as point mutations, structural variants, or wide genomic coverage, for example, in oncology and rare-disease applications. In high-throughput environments and population studies, the capacity of multi-capillary systems is often exceeded, which has led several labs to combine fragment analysis with NGS or Sanger sequencing to meet higher variant complexity, scalability of multiplexing, and deeper analytics needs.
Choosing Platforms, Kits and Services
The instrument selection will be based on an instrument buying guide logic that weighs capillary count, automation features, and compatibility with existing systems to support lab workflow automation. Assay consistency is shaped by reagent choices like polymer matrices, dye chemistries, and primer sets, while STR, MSI, and targeted genotyping with validated kits reduce the load of development and strengthen validation & accreditation compliance for CLIA/IVDR. Labs also assess options for software integration and decide between in-house testing for tighter control or outsourced services for low-volume operational needs.
Segmental Insights
This report provides granular coverage of the fragment analysis market by product & service, technology, application, end use, enabling readers to identify the fastest-growing and most profitable demand pockets.
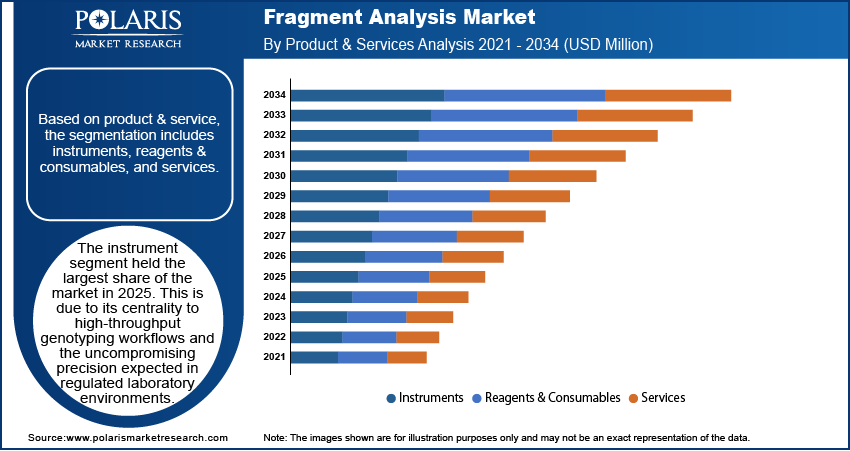
By Product & Service
- Instruments
The instrument category retained its strong revenue footprint for 2025, given its core function for high-throughput genotyping and uncompromising precision anticipated in regulated laboratory settings. Capillary electrophoresis platforms, multiplex-capable thermal cyclers, and integrated detection modules are part of a layer of infrastructure that laboratories treat as indispensable. Their stability in calibration, reproducibility between runs, and compatibility with increasingly complex fluorescent chemistries perpetuate this status.
- Reagents & Consumables
Fragment analysis thus represented the segment that moved most quickly during the forecast horizon, considering the unyielding consumption cycle native to the process. Each run consumes a constellation of chemistry components whose performance dictates signal clarity, allele separation sharpness, and downstream interpretability. Volatility in manufacturing lead times, combined with persistent innovation in fluorescent labeling chemistries, generates rapid replacement cycles and category expansion.
-
- PCR master mixes
Master mixes operate as the biochemical scaffolding upon which amplification precision rests. Even marginal shifts in buffer formulation or polymerase blend alter peak morphology and dropout probabilities. Their prominence in multiplexed assays is escalating due to demand for dense data generation with minimal workflow expansion.
-
- Fluorescent dyes and labels
This subcategory is shaped by a steady infusion of improved dye architectures with narrower emission spectra, extended photostability, and reduced spectral overlap. The increasing adoption of multi-channel detection systems accelerates dye innovation, as laboratories scale multiplexing capacity to extract more allelic information from fewer reaction cycles.
-
- DNA size standards & ladders
Size standards anchor the analytical grid. Without precise, stable migration references, allele calling collapses into ambiguity. Their dependence runs across every diagnostic, research, and forensic workflow that deploys capillary electrophoresis.
-
- Capillary arrays
Arrays represent the mechanical and optical heart of electrophoretic separation. Demand correlates directly to instrument utilization, as arrays degrade with cumulative injection cycles. High-volume laboratories cycle through them rapidly, making this a structurally recurring revenue stream.
-
- Others
Additional consumables include buffer systems, microtubes, and plates; enzymatic cleanup kits form the auxiliary backbone of running experiments uninterruptedly. Their aggregate contribution is substantial, despite appearing operationally routine.
- Services
The service offerings continued to expand at a healthy rate, facilitated by outsourcing trends across smaller laboratories, capacity constraints within academic centers, and the growing requirement for validated, audit-ready interpretation pipelines. In data-intensive environments, such as clinical genetics, forensic testing depends on the service providers for allele calling, quality control, and large-scale data harmonization.
Product & Services Segment Analysis
|
Segment |
Market Share Ranking |
Fastest-Growing Indicator |
Core Performance Drivers |
|
Instruments |
High |
No |
Throughput requirements; calibration stability. |
|
Reagents & Consumables |
High |
Yes |
High run consumption; expanding fluorescent chemistries. |
|
PCR Master Mixes |
Medium |
Yes |
Multiplex amplification accuracy. |
|
Fluorescent Dyes & Labels |
Medium |
Yes |
Enhanced photostability and spectral clarity. |
|
DNA Size Standards & Ladders |
Medium |
No |
Reliable migration references. |
|
Capillary Arrays |
Medium |
No |
Direct link to instrument usage cycles. |
|
Other Consumables |
Low |
No |
Routine workflow supplies. |
|
Services |
Medium |
Yes |
Outsourced analysis and workflow overflow support. |
The report evaluates each grade by market size, share, growth rate, and indicative pricing differentials.
By Technology
- Capillary Electrophoresis (CE)
CE retained the highest share due to its entrenched status as the authoritative method for size-based DNA separation. Its long-established analytical signatures peak sharpness, migration predictability, multicolor detection form the methodological grammar of fragment analysis. Even as competing approaches emerge, CE’s calibration stability, regulatory familiarity, and interpretive continuity sustain its gravitational pull.
- Polymerase Chain Reaction (PCR)
PCR is continually improving and represents the core amplification technology that drives nearly all fragment analysis methods. As the level of multiplex continues to increase, the focus on the amplification plates that contain highly precise ramp rate and temperature uniformity over large volume plates intensifies. Improvement in hot start enzymes and inhibitor-resistant formulations drives the growth.
Although it commands a smaller share, sequencing-based fragment interrogation accelerates quickly due to the surge in targeted panels, microsatellite instability assays, and hybrid workflows where sequencing augments CE-based methods. Its momentum originates from the ability to extract layered structural information that extends beyond mere fragment length.
- Others
Alternative analytical modes including microfluidic separation and emerging electro-optical detection architectures occupy a narrow but expanding niche. These appeal to rapid-turnaround environments where simplified handling and compact footprints outweigh ultra-high resolution.
By Application
- Genotyping & Polymorphism Analysis
Fragment-level signatures anchor the largest demand block within this application. Research, clinical, and breeding programs depend on fragment level signatures to classify allelic states, quantify distributions of polymorphism, and compare population structures.
-
- SNP and Indel Genotyping
The adoption of the technology accelerates due to the requirement for rapid and clear sizing changes that are sensitive to single-base changes and deletions.
-
- Microsatellite / STR / VNTR Analysis
The steep growth curve is contributed by the need for forensic accreditation, ancestry mapping, and parentage verification, where STR patterns are used as identifiers.
-
- Others
Other applications range from multiplex marker panels, to linkage studies and trait-selection programs in agrigenomics.
- Molecular Diagnostics
Clinical diagnostics currently use fragment analysis to assess repeat expansions, monitor minimal residual disease signatures, and characterize allelic imbalances in oncology. CE compliant workflows have been preferred in hospitals for traceability and familiarity with regulations.
- Forensic & Paternity Testing
This segment remains structurally resilient. STR-based identification and kinship analysis represent the backbone of casework workflows. The legal system’s reliance on validated fragment signatures underscores a continuous demand.
- Agricultural & Animal Genomics
Breeding programs use fragment-based markers in classifying phenotypes, purity testing, and accelerating the cycles within the selection process. The application domain is reinforced with rising investments in seed genetics and livestock improvement.
- Others
Other applications include microbiome profiling, environmental monitoring, and industrial QC assays, where fragment signatures give rapid differentiation.
Genotyping & Polymorphism Analysis and Molecular Diagnostics Segment Analysis
|
Segment |
Market Share Ranking |
Fastest-Growing Indicator |
Core Performance Drivers |
|
Genotyping & Polymorphism Analysis |
High |
Yes |
Demand for allele classification, STR profiling, and high-density marker analysis. |
|
SNP & Indel Genotyping |
Medium |
Yes |
Need for rapid detection of short-length variants. |
|
Microsatellite / STR / VNTR Analysis |
High |
No |
Forensic and ancestry workflows requiring precise size resolution. |
|
Other Genotyping Sub applications |
Low |
No |
Linkage studies, multiplex marker panels. |
|
Molecular Diagnostics |
Medium |
Yes |
Clinical use in repeat expansions, oncology markers, and hereditary condition assessment. |
By End Use
- Academic & Research Institutes
This category leads the way due to wide-ranging exploration in genetics, molecular biology, and developmental biology. Experimental diversity in academic settings fundamentally drives continuous reagent turnover and instrument usage.
- Hospitals & Diagnostic Laboratories
Clinical laboratories base their operational processes on fragment analysis with respect to repeat-expansion disorders, hereditary conditions, and oncology markers that demand size-resolved outputs. Reliability in throughput and clarity of interpretation strengthen this anchor.
- Biotechnology & Pharmaceutical Companies
Pharma and biotech entities deploy fragment analysis for genotoxicity studies, clone verification, cell-line authentication, and biomarker development. The controlled, reproducible nature of fragment signatures aligns with regulated R&D pipelines.
- Others
Specialized use cases requiring precise separation profiles are performed by residual demand providers such as contract test providers, agricultural biotech firms, and specialty QC labs applying fragment analysis.
Regional Analysis
North America Market Assessment
The North American region dominated the market in 2025 fueled by the concentration of biotechnology firms in the region, established molecular diagnostics networks, and the strong integration of STR, SNP, and MSI assays in the clinical workflows. In May 2024, Northwell unveiled a new USD 3.2 million molecular diagnostics laboratory in the United States. The facility represented the strategic expansion of diagnostic testing capability and underlined the rising investment in molecular-diagnostics infrastructure to support public health and clinical research. Genetic testing volumes grow across oncology, hereditary disorders, and pharmacogenomics. In addition, forensic laboratories still use STR profiling as one of the tools; thus, that keeps fragment analysis systems highly utilized. The region's focus on performance-driven operations accelerates upgrades, assay expansions, and the adoption of high-throughput platforms.
Asia Pacific Fragment Analysis Market Insights
Asia Pacific is anticipated to witness the highest growth. This is supported by rapid expansion of molecular diagnostics, rising genomics programs, and increasing laboratory capacity across China, India, and South Korea. In China, PacBio and Berry Genomics secured regulatory approval from China’s National Medical Products Administration (NMPA) for the Sequel II CNDx system the world’s first clinically approved long-read sequencer. Clinical centers expand MSI, STR, and SNP testing, while research institutions scale population genetics and oncology workflows. China builds internal supply chains for instruments and reagents, creating a self-reinforcing demand cycle. India and Southeast Asia amplify adoption through diagnostic modernization and greater use of CE-based assays across hospitals and academic labs.
Europe Fragment Analysis Market Overview
The Europe growth in the Fragment Analysis market is attributed to precision medicine initiatives, tighter regulatory expectations, and strong clinical genomics adoption. Diagnostic laboratories in Germany, the UK, and France increase use of high-resolution fragment analysis for oncology, inherited disease testing, and quality-controlled workflows. Forensic science maintains sizable demand for STR systems. Population genetics, ancestry studies, and biodiversity programs further broaden the region's application base, reinforcing Europe’s position as a mature and methodical market.
Heat Map Analysis
|
Region |
Demand Intensity |
Technology Penetration |
Clinical & Research Consumption |
Regulatory Influence |
Growth Momentum |
|
North America |
Very High |
High |
Very High |
High |
High |
|
Asia Pacific |
High |
Medium–High |
High |
Medium |
Very High |
|
Europe |
Medium–High |
Medium–High |
Medium–High |
Very High |
Medium |
Key Players & Competitive Analysis Report
The fragment analysis market is relatively competitive, with leading participation by genomics technology providers and specialized molecular biology solution providers. Competition focuses on the sensitivity of instrumentation, automation of workflows, reagent quality, and software-driven interpretation of data. The companies are developing capillary electrophoresis systems, fluorescence-based detection chemistries, and high-precision sizing kits to support applications in genetic disease testing, forensic profiling, microbial identification, and pharmacogenomics.
Key companies operating in the global fragment analysis market include Agilent Technologies, Inc., Danaher Corporation, Eurofins Genomics LLC, Genetika Science Indonesia, PT, LGC Limited, MCLAB – Molecular Cloning Laboratories, Inc., NimaGen B.V., Promega Corporation, SoftGenetics LLC, and Thermo Fisher Scientific Inc.
Key Players
- Agilent Technologies, Inc.
- Danaher Corporation
- Eurofins Genomics LLC
- Genetika Science Indonesia, PT
- LGC Limited
- MCLAB – Molecular Cloning Laboratories, Inc.
- NimaGen B.V.
- Promega Corporation
- SoftGenetics LLC
- Thermo Fisher Scientific Inc.
Costs, Trends and Future Outlook
Fragment analysis retains strong value as it pairs stable operating costs with a mature technology base that supports efficient, size-focused genetic testing. Labs assess expenses across instruments, consumables, software, and long-term workflow maintenance, while industry trends such as automation, microfluidics, and AI-driven interpretation continue to elevate throughput and data consistency.
- Pricing Considerations
The cost structure changes within instrumentation capacity, reagent type selection, and annual volume, from entry-level multi-capillary systems. As for per-sample pricing, most are dependent on polymer matrices, fluorescent dyes, PCR components, and maintenance cycles. On the other hand, total cost of ownership reflects software licensing, calibrations, training, and service contracts. As a lab with standardized protocols generally reaches a low TCO due to optimized reagent usage and minimal manual handling.
- Technology Advancements
AI-driven interpretation systems already facilitate automated peak calling, QC checks, and reporting, reducing analyst workload while enhancing reproducibility. Cloud-based platforms enable multi-site groups to centralize data pipelines and adhere to consistent interpretation rules. Microfluidic CE systems are gaining interest as compact, fast-run complements, reducing reagent use, while enabling distributed or research-oriented applications.
- Future Scenarios
Fragment analysis will remain one of the central tools in genetic testing, finding support from cost efficiency and relevance for assays based on size-dependent variation. Newborn screening programs, population-scale genomics, and targeted clinical areas such as oncology and reproductive genetics should sustain demand, while the technology diffuses into emerging markets based on its affordability and reliability.
Industry Developments
- April 2025: QIAGEN announced plans to launch three new sample-preparation instruments by 2026 to improve automation in molecular laboratories. The development supported fragment analysis workflows by enabling more consistent, high-quality DNA and RNA preparation.
Fragment Analysis Market Segmentation
By Product & Services Outlook (Revenue, USD Million, 2021-2034)
- Instruments
- Reagents & Consumables
- PCR master mixes
- Fluorescent dyes and labels
- DNA size standards & ladders
- Capillary arrays
- Others
- Services
By Technology Outlook (Revenue, USD Million, 2021-2034)
- Capillary Electrophoresis
- Polymerase Chain Reaction
- DNA Sequencing
- Others
By Application Outlook (Revenue, USD Million, 2021-2034)
- Genotyping & Polymorphism Analysis
- SNP and Indel Genotyping
- Microsatellite / STR / VNTR Analysis
- Others
- Molecular Diagnostics
- Forensic & Paternity Testing
- Agricultural & Animal Genomics
- Others
By End Use Outlook (Revenue, USD Million, 2021-2034)
- Academic & Research Institutes
- Hospitals & Diagnostic Laboratories
- Biotechnology & Pharmaceutical Companies
- Others
By Regional Outlook (Revenue, USD Million, 2021-2034)
- North America
- US
- Canada
- Europe
- Germany
- France
- UK
- Italy
- Spain
- Netherlands
- Russia
- Rest of Europe
- Asia Pacific
- China
- Japan
- India
- Malaysia
- South Korea
- Indonesia
- Australia
- Vietnam
- Rest of Asia Pacific
- Middle East & Africa
- Saudi Arabia
- UAE
- Israel
- South Africa
- Rest of Middle East & Africa
- Latin America
- Mexico
- Brazil
- Argentina
- Rest of Latin America
Fragment Analysis Market Report Scope
|
Report Attributes |
Details |
|
Market Size in 2025 |
USD 275.72 Million |
|
Market Size in 2026 |
USD 301.32 Million |
|
Revenue Forecast by 2034 |
USD 617.39 Million |
|
CAGR |
9.4% from 2026 to 2034 |
|
Base Year |
2025 |
|
Historical Data |
2021–2024 |
|
Forecast Period |
2026–2034 |
|
Quantitative Units |
Revenue in USD Million and CAGR from 2026 to 2034 |
|
Report Coverage |
Revenue Forecast, Competitive Landscape, Growth Factors, and Industry Trends |
|
Segments Covered |
|
|
Regional Scope |
|
|
Competitive Landscape |
|
|
Report Format |
|
|
Customization |
Report customization as per your requirements with respect to countries, regions, and segmentation. |
FAQ's
The global market size was valued at USD 275.72 million in 2025 and is projected to grow to USD 617.39 million by 2034.
The?North America region holds the largest share in the fragment analysis market, due to its dense biotechnology presence, mature molecular diagnostics networks, and broad use of STR, SNP, and MSI assays across clinical workflows.
STR analysis evaluates short tandem repeats in DNA to generate a unique genetic profile for an individual.
A few of the key players in the market are Agilent Technologies, Inc., Danaher Corporation, Eurofins Genomics LLC, Genetika Science Indonesia, PT, LGC Limited, MCLAB – Molecular Cloning Laboratories, Inc., NimaGen B.V., Promega Corporation, SoftGenetics LLC, Thermo Fisher Scientific Inc.
Key factors include rising prevalence of genetic disorders, cancer, and infectious diseases and advancements in fluorescent labeling chemistries and automated data analysis tools.
Page last updated on:
Dec-2025
Research Methodology
A robust system of research, verification, and forecasting designed to ensure reliable and actionable market insights.
Polaris Market Research uses a clear and structured approach to deliver insights that clients can rely on. The process combines detailed primary and secondary research, including direct communication with industry experts. The detailed information helps build a complete picture of market trends and developments. Secondary data is gathered from credible sources such as industry reports, company filings, government source links, and trusted organization databases. It is then cross-checked through discussions with key stakeholders across the value chain. Market size and forecasts are developed using both bottom-up and top-down methods to ensure accuracy and consistency in the final results.

Project Setup
Step 1 & 2:
- We start every project by clearly understanding the client’s objective or goal, then defining the market scope, and aligning regions, segments, and timelines.
- Once the foundation is set, we collect data from all-around of sources, including company reports, government databases, and paid industry platforms.
- Our research is based on secondary data, which helps us build a strong understanding of the market across regions and industries. Then we validate this information through primary research by speaking directly with industry experts, companies, and stakeholders.
- By combining secondary and primary research, we ensure that our market insights are accurate, practical, and closely aligned with real market conditions.
Data Collection
We gather information from both public and verified sources:

Data Structuring
Step 3:
- All collected data is organized into a consistent format to ensure accurate analysis. Since inputs come from multiple sources, they are standardized and aligned before use.
- The data is segmented by product, application, and region, and mapped across a defined historical period (2020–2024). All values are converted into common units (USD Mn/Bn), and volume and pricing are aligned where required to estimate revenue.
- Any overlaps or inconsistencies are reviewed and adjusted to maintain accuracy (<5% variance threshold).
- The result is a structured dataset that allows for clear comparison across regions and supports reliable analysis and forecasting.
Structured Market Dataset, USD Mn/Bn

4. Data Structuring
Step 4: TOP-DOWN APPROACH
- We start with the overall market size at a global or macro level.
- The market is then narrowed down based on scope and industry relevance.
- We apply penetration rates and split the data by region and segment.
- This helps us estimate the market size for specific segments.
- The numbers are validated through cross-checks to ensure accuracy.

Step 5: BOTTOM-UP APPROACH
- We begin by analyzing data from leading companies in the market.
- Revenue data is collected and mapped across different segments.
- The data is then aggregated to estimate the total market size.
- To fill in any gaps, adjustments are made based on industry standards.
- Validation checks make sure that the results are correct.

5. Data Structuring
Step 6:
At Polaris Market Research, we employ a methodical forecasting strategy. This approach blends the analysis of historical data with real-time market validation. To forecast future trends with precision, we examine past patterns, pricing fluctuations, and the interplay of supply and demand. To ensure our conclusions reflect the present market landscape, we actively seek input from industry experts and key stakeholders.
To refine our predictions, we carefully consider critical elements such as market drivers and restraints, fluctuations in raw material costs, emerging technologies, and the production capabilities of various regions. Furthermore, we assess regulatory frameworks and potential policy shifts to gauge their potential impact on market expansion.
All this information is synthesized to generate precise forecasts for each segment and region. These forecasts illuminate the current state of the market and highlight forthcoming opportunities.

6. Data Structuring
Step 7:
In the final stage, we validate all our estimates using a triangulation method, where data is cross-checked from multiple reliable sources, like company data, primary interviews, and secondary research. This helps us make sure that our numbers are correct and fit with the rest of the market.
This process involves verifying data consistency across various segments and geographic areas. It also requires comparing historical trends with the assumptions support the forecast. Any discrepancies involve adjustments to ensure everything remains aligned and dependable.
Once the data is finalized, we prepare the final outputs, including market size estimates, segment-wise breakdowns, and growth metrics. These are delivered in structured formats such as tables, charts, and data files for easy analysis and use.
We collaborate closely with clients, ensuring the final products align with their requirements. This includes offering tailored adjustments, supplementary data analyses, and continuous assistance. Furthermore, we monitor market trends post-delivery, providing updates and refinements to maintain the insights' relevance as time passes.
Post-delivery, we continue to monitor market shifts, offering updates and adjustments to ensure the insights remain relevant over time.
Validation
Triangulation Framework
- Company-level data
- Primary inputs from industry participants
- Secondary benchmarks and published data
- Variance maintained within ±5-10%
- Adjustments applied to align estimates
- Segment values validated against overall market structure
Quality Check
Data Consistency & Integrity
- Segment totals validated to 100%
- Regional estimates aligned with global market size
- Historical trends compared against forecast outputs
- Assumptions reviewed for cross-segment and regional alignment
Output & Delivery
Final Outputs
- Market size estimates (USD Mn/Bn)
- Segment-wise distribution (%)
- Growth metrics (CAGR %)
- Structured tables and charts
- Segment-level datasets
- Excel-based data files for further analysis
Client Alignment & Support
- Deliverables are aligned with defined client requirements and scope
- Custom data cuts and segment splits are incorporated as required
- Post-delivery queries are addressed through analyst interactions
- Additional clarifications and data support are provided upon request
Client Continuity & Updates
- Market developments are tracked post-delivery to capture changes in key trends
- Updated data and revisions are provided based on new market inputs
- Additional refinements and data cuts are shared as required
- Continued analyst engagement supports evolving client requirements
