

Overview
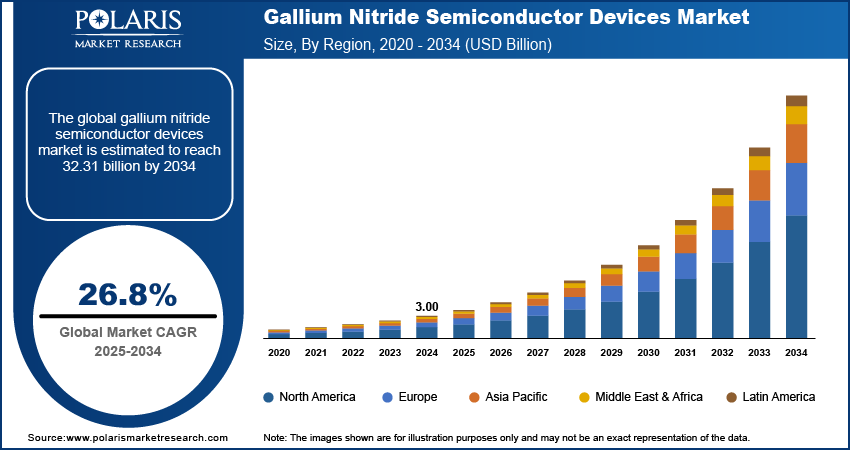
The gallium nitride semiconductor devices market was valued at USD 3.00 billion in 2024 growing at a CAGR of 26.8% from 2025-2034. Rising adoption of GaN devices in 5G communication systems and the expanding EV charging infrastructure are driving market growth.
Key Insights
- Power semiconductors led the market in 2024 due to widespread use in EVs, industrial automation, and energy-efficient power conversion.
- Aerospace & defense is expected to expand at the maximum CAGR, led by increasing deployment of GaN-based communication & radar systems.
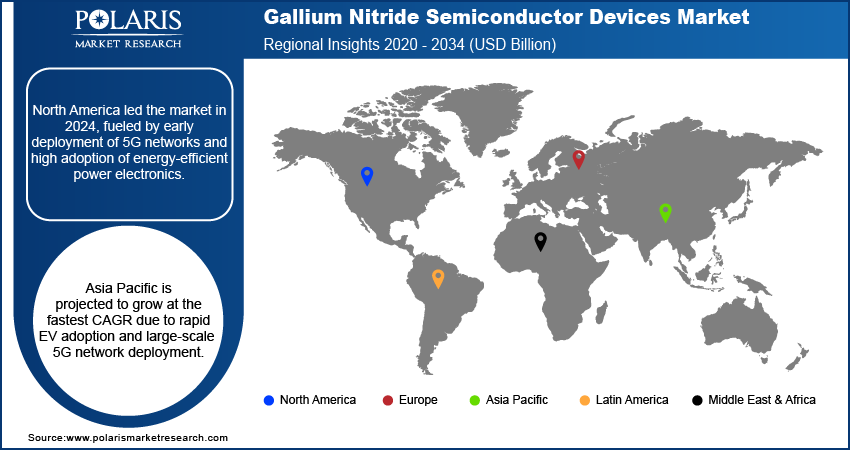
- North America led the market in 2024 owing to early 5G adoption and robust semiconductor manufacturing presence.
- The U.S. led North America in 2024 with advanced semiconductor infrastructure and high adoption of energy-efficient technologies.
- Asia Pacific is projected to record the fastest growth, driven by rapid EV adoption and large-scale 5G deployment.
- China led Asia Pacific due to industrial growth and government incentives toward semiconductor manufacturing and EV infrastructure.
Industry Dynamics
- Increasing use of GaN devices in 5G communications systems is driving demand across telecom infrastructure.
- Growth in EV and charging infrastructure is fueling the demand for high-efficiency GaN power devices.
- Huge material and manufacturing costs are restraining large-scale commercialization of GaN semiconductors.
- GaN-on-Silicon and power IC technology advancements are creating new market opportunities.
Market Statistics
- 2024 Market Size: USD 3.00 Billion
- 2034 Projected Market Size: USD 32.31 Billion
- CAGR (2025-2034): 26.8%
- North America: Largest Market Share
Gallium nitride (GaN) semiconductor devices are new-generation electronic devices used for high-power, high-frequency, and energy-saving applications in the communication, automotive, and industrial markets. For instance, in July 2025, Renesas released three 650V Gen IV Plus GaN FETs for dense power conversion in AI data centers, industrial systems, and charging, with enhanced efficiency and thermal performance. These devices provide high performance in 5G base stations, RF systems, electric vehicles, and data centers with high switching efficiency and small size.
Growing 5G network deployments, increasing EV infrastructure, and rising usage of energy-efficient power electronics are fueling demand for GaN-based devices globally. Industries are turning towards GaN solutions in order to attain higher signal transmission speed, less energy loss, and enhanced thermal performance.
Major manufacturers are concentrating on creating GaN-on-Silicon and GaN-on-Diamond technologies to make their products more scalable and cost-effective. Ongoing innovation, coupled with increasing investments in semiconductor manufacturing and renewable energy integration, is driving robust growth opportunities for GaN semiconductor device providers.
Drivers & Opportunity
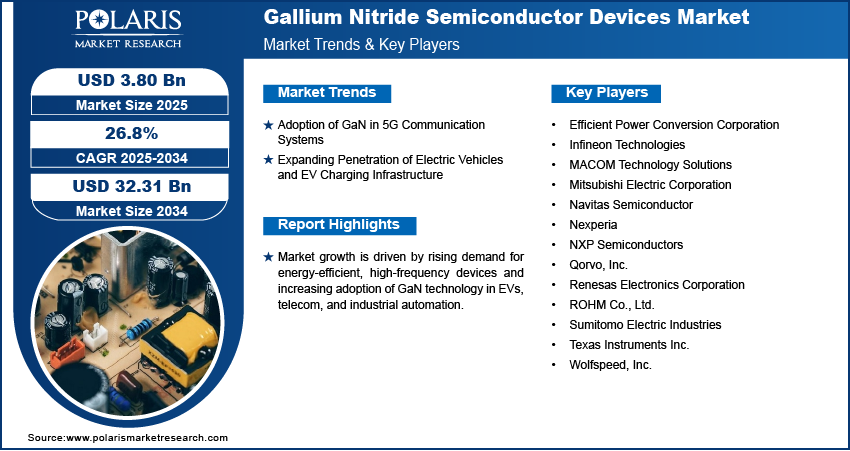
Adoption of GaN in 5G Communication Systems: Increasing use of GaN devices in 5G communication systems is driving demand in telecom and RF infrastructure. 5G Americas and Omdia released that the number of global 5G connections crossed 2.6 billion in Q2 of 2025, growing 32% year-on-year, and are likely to reach close to 9 billion in 2030, constituting 60% of all wireless connections. GaN components support high-frequency operation with reduced power loss and smaller size. GaN-based RF amplifiers are utilized by network operators for extending support to mmWave and massive MIMO technologies. This is fueling greater deployment of GaN semiconductors in future communication systems.
Expanding Penetration of Electric Vehicles and EV Charging Infrastructure: Wider adoption of electric vehicles and EV charging equipment is driving demand for high-efficiency GaN power devices. According to International Energy Agency (IEA), worldwide electric car sales totaled over 17 million in 2024, up over 25%, with the 3.5 million increases from 2023 exceeding EV sales in 2020. GaN allows for faster switching, increased energy efficiency, and minimized system size in inverters and chargers. Automotive firms are incorporating GaN devices into onboard chargers and powertrains. This is helping to drive the adoption of GaN technology in the electric mobility space.
Segmental Insights
Component Analysis
Based on component, the segmentation includes transistor, diode, rectifier, power IC, supply and inverter, amplifiers, lighting and laser, switching systems, and other components. The transistor segment led the market during 2024 due to its efficiency and extensive use in communication systems, RF amplifiers, and power conversion. Robust uptake in the telecom, automotive, and industrial markets continues to keep it leading across the globe.
The power IC segment is anticipated to expand at the highest CAGR in the forecast period based on rising integration in EV chargers, data centers, and renewable energy systems. The growth in demand for power management solutions that are smaller and high in efficiency is driving the use of power ICs in various applications.
Product Analysis
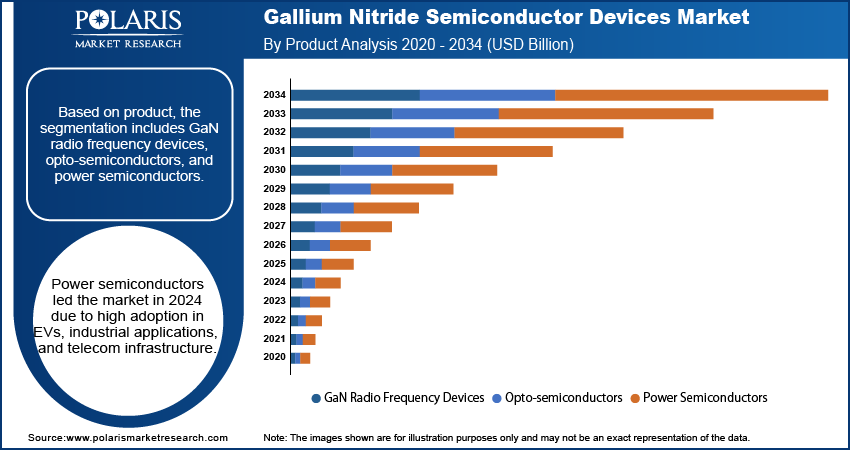
Based on product, the segmentation includes GaN radio frequency devices, opto-semiconductors, and power semiconductors. Power semiconductors segment dominated the market in 2024 with its energy-efficient power conversion. Universal implementation in EVs, industrial automation, and telecom infrastructure further establishes its market dominance.
GaN RF devices is expanding at the highest growth rate over the forecast period owing to its deployment in 5G base stations, radar systems, and high-frequency wireless networks. Their growing demand for high-frequency, low-loss, and energy-efficient components is boosting their speedy adoption.
Wafer Size Analysis
Based on wafer size, the segmentation includes 2-inch, 4-inch, 6-inch, and 8-inch. The 6-inch wafer is leading segment in 2024 driven by its cost efficiency, manufacturing yield, and compatibility with high-volume GaN device production. 6-inch wafers are favored by manufacturers for mass market applications in power electronics and RF systems. Innoscience launched four 700V SolidGaN power devices with up to 50% better efficiency and high-frequency switching capability for 1–6 kW applications in August 2025.
The 8-inch wafer segment is expected to exhibit the highest growth due to growing requirement for large-scale GaN device manufacturing. Improved efficiency in high-power applications is promoting the adoption of 8-inch wafers in industrial and automotive applications.
End User Analysis
Based on end user, the segmentation includes aerospace & defense, automotive, consumer electronics, healthcare, information & communication technology, industrial & power, and other end user. The automotive industry led the market during the year 2024, owing to mass adoption of EVs and incorporation of GaN devices in inverters, onboard chargers, and powertrains. The transition towards energy-efficient and high-performance EVs is also stimulating market growth.
The aerospace and defense is anticipated to develop at the highest CAGR over the forecast period as a result of rising deployment of GaN-based electronic warfare systems, satellite communication, and radar. Advanced aerospace and growing defense modernization programs are contributing to the high demand for GaN devices.
Regional Analysis
North America predominated the market due to the early adoption of GaN devices for 5G communication infrastructure to enable high-frequency and energy-saving telecom systems. In October 2025, Alpha and Omega Semiconductor offers SiC and GaN power solutions to enable 800 VDC power architecture for future AI data centers to enhance efficiency and lower cooling and maintenance costs. Furthermore, the availability of leading semiconductor manufacturers spurs innovation and mass deployment.
The U.S. Gallium Nitride Semiconductor Devices Market Insights
The U.S. dominated the gallium nitride semiconductor devices industry due to early deployment of 5G infrastructure and high demand for RF and power electronics. Moreover, strong presence of semiconductor manufacturers fosters innovation. In addition, government funding for EV and defense projects is supporting growth.
Europe Gallium Nitride Semiconductor Devices Market Insights
Europe holds the substantial market share, fueled by growing penetration of GaN devices in auto and renewable energy segments in Germany and France. For example, in May 2025, Infineon introduced radiation-hardened GaN transistors with CoolGaN technology, qualified for space applications, for high-efficient satellite and deep-space solutions. Moreover, government policies encouraging energy-efficient power electronics are driving adoption.
Asia Pacific Gallium Nitride Semiconductor Devices Market Insights
Asia Pacific is projected to grow at the fastest CAGR due to rapid adoption of electric vehicles and expansion of EV charging infrastructure across China and Japan. Moreover, growing deployment of 5G networks in India and South Korea is increasing demand for high-performance GaN devices. In addition, rising industrial automation is contributing to market expansion.
China Gallium Nitride Semiconductor Devices Market Insights
China is driving market growth with rapid expansion of EV infrastructure and increasing industrial automation. Additionally, mass 5G network deployment is driving demand for high-frequency GaN devices in increasingly greater volumes. According to the China Ministry of Industry and Information Technology (MIIT), as of November 2024, China had 4.19 million 5G base stations, 5G utilized in 74 out of 97 priority economic sectors, and more than 15,000 "5G+ industrial internet" projects leading to smarter, greener production.
Key Players & Competitive Analysis Report
The gallium nitride (GaN) semiconductor devices market is moderately competitive, with firms improving device performance by leveraging GaN-on-Silicon technology, high-efficient power ICs, and state-of-the-art RF and power electronics solutions. Partnership with telecom operators, automobile OEMs, and industrial integrators also increases market penetration and adoption worldwide.
Key players in the market for gallium nitride semiconductor devices are Wolfspeed, Inc., Qorvo, Inc, MACOM Technology Solutions, Infineon Technologies, Sumitomo Electric Industries, Navitas Semiconductor, Efficient Power Conversion Corporation, Nexperia, NXP Semiconductors, ROHM Co., Ltd., Mitsubishi Electric Corporation, Renesas Electronics Corporation, and Texas Instruments Inc.
Key Players
- Efficient Power Conversion Corporation
- Infineon Technologies
- MACOM Technology Solutions
- Mitsubishi Electric Corporation
- Navitas Semiconductor
- Nexperia
- NXP Semiconductors
- Qorvo, Inc.
- Renesas Electronics Corporation
- ROHM Co., Ltd.
- Sumitomo Electric Industries
- Texas Instruments Inc.
- Wolfspeed, Inc.
Industry Development
- October 2025: Imec has initiated a 300mm GaN program aimed at creating advanced, cost-effective power devices and speeding up semiconductor innovation.
- December 2024: ROHM and TSMC are collaborating to develop and mass-produce GaN power devices for electric vehicles using GaN-on-silicon technology.
- October 2024: Texas Instruments has quadrupled its GaN semiconductor production by adding a new 200mm wafer facility in Japan and expanding internal manufacturing.
Gallium Nitride Semiconductor Devices Market Segmentation
By Component (Revenue, USD Billion, 2020–2034)
- Transistor
- Diode
- Rectifier
- Power IC
- Supply and Inverter
- Amplifiers
- Lighting and Laser
- Switching Systems
- Other Components
By Product (Revenue, USD Billion, 2020–2034)
- GaN Radio Frequency Devices
- Opto-semiconductors
- Power Semiconductors
By Wafer Size (Revenue, USD Billion, 2020–2034)
- 2-inch
- 4-inch
- 6-inch
- 8-inch
By End User (Revenue, USD Billion, 2020–2034)
- Aerospace & Defense
- Automotive
- Consumer Electronics
- Healthcare
- Information & Communication Technology
- Industrial & Power
- Other End User
By Region (Revenue, USD Billion, 2020–2034)
- North America
- The U.S.
- Canada
- Europe
- Germany
- France
- UK
- Italy
- Spain
- Netherland
- Russia
- Rest of Europe
- Asia Pacific
- China
- India
- Japan
- Malaysia
- South Korea
- Indonesia
- Australia
- Rest of Asia Pacific
- Latin America
- Mexico
- Brazil
- Argentina
- Rest of Latin America
- Latin America
- Saudi Arabia
- UAE
- South Africa
- Israel
- Rest of South Africa
Gallium Nitride Semiconductor Devices Market Report Scope
|
Report Attributes |
Details |
|
Market Size in 2024 |
USD 3.00 Billion |
|
Market Size in 2025 |
USD 3.80 Billion |
|
Revenue Forecast by 2034 |
USD 32.31 Billion |
|
CAGR |
26.8% from 2025 to 2034 |
|
Base Year |
2024 |
|
Historical Data |
2025-2034 |
|
Forecast Period |
2025-2034 |
|
Quantitative Units |
Revenue in USD Billion and CAGR from 2025 to 2034 |
|
Report Coverage |
Revenue Forecast, Competitive Landscape, Growth Factors and Industry Trends |
|
Segments Covered |
|
|
Regional Scope |
|
|
Competitive Landscape |
|
|
Report Format |
|
|
Customization |
Report customization as per your requirements with respect to countries, regions and segmentation. |
FAQ's
The global market size was valued at USD 3.00 billion in 2024 and is projected to grow to USD 32.31 billion by 2034.
The global market is projected to register a CAGR of 26.8% during the forecast period.
North America dominated the GaN semiconductor devices market in 2024 due to early 5G adoption and a strong semiconductor manufacturing base.
A few of the key players in the market are Wolfspeed, Inc., Qorvo, Inc, MACOM Technology Solutions, Infineon Technologies, Sumitomo Electric Industries, Navitas Semiconductor, Efficient Power Conversion Corporation, Nexperia, NXP Semiconductors, ROHM Co., Ltd., Mitsubishi Electric Corporation, Renesas Electronics Corporation, and Texas Instruments Inc.
Power semiconductors dominated in 2024 owing to widespread use in EVs, industrial automation, and energy-efficient power conversion.
Aerospace & defense is projected to grow fastest, driven by rising deployment of GaN-based radar, satellite communication, and electronic warfare systems.
Page last updated on:
Aug-2023
Research Methodology
A robust system of research, verification, and forecasting designed to ensure reliable and actionable market insights.
Polaris Market Research uses a clear and structured approach to deliver insights that clients can rely on. The process combines detailed primary and secondary research, including direct communication with industry experts. The detailed information helps build a complete picture of market trends and developments. Secondary data is gathered from credible sources such as industry reports, company filings, government source links, and trusted organization databases. It is then cross-checked through discussions with key stakeholders across the value chain. Market size and forecasts are developed using both bottom-up and top-down methods to ensure accuracy and consistency in the final results.

Project Setup
Step 1 & 2:
- We start every project by clearly understanding the client’s objective or goal, then defining the market scope, and aligning regions, segments, and timelines.
- Once the foundation is set, we collect data from all-around of sources, including company reports, government databases, and paid industry platforms.
- Our research is based on secondary data, which helps us build a strong understanding of the market across regions and industries. Then we validate this information through primary research by speaking directly with industry experts, companies, and stakeholders.
- By combining secondary and primary research, we ensure that our market insights are accurate, practical, and closely aligned with real market conditions.
Data Collection
We gather information from both public and verified sources:

Data Structuring
Step 3:
- All collected data is organized into a consistent format to ensure accurate analysis. Since inputs come from multiple sources, they are standardized and aligned before use.
- The data is segmented by product, application, and region, and mapped across a defined historical period (2020–2024). All values are converted into common units (USD Mn/Bn), and volume and pricing are aligned where required to estimate revenue.
- Any overlaps or inconsistencies are reviewed and adjusted to maintain accuracy (<5% variance threshold).
- The result is a structured dataset that allows for clear comparison across regions and supports reliable analysis and forecasting.
Structured Market Dataset, USD Mn/Bn

4. Data Structuring
Step 4: TOP-DOWN APPROACH
- We start with the overall market size at a global or macro level.
- The market is then narrowed down based on scope and industry relevance.
- We apply penetration rates and split the data by region and segment.
- This helps us estimate the market size for specific segments.
- The numbers are validated through cross-checks to ensure accuracy.

Step 5: BOTTOM-UP APPROACH
- We begin by analyzing data from leading companies in the market.
- Revenue data is collected and mapped across different segments.
- The data is then aggregated to estimate the total market size.
- To fill in any gaps, adjustments are made based on industry standards.
- Validation checks make sure that the results are correct.

5. Data Structuring
Step 6:
At Polaris Market Research, we employ a methodical forecasting strategy. This approach blends the analysis of historical data with real-time market validation. To forecast future trends with precision, we examine past patterns, pricing fluctuations, and the interplay of supply and demand. To ensure our conclusions reflect the present market landscape, we actively seek input from industry experts and key stakeholders.
To refine our predictions, we carefully consider critical elements such as market drivers and restraints, fluctuations in raw material costs, emerging technologies, and the production capabilities of various regions. Furthermore, we assess regulatory frameworks and potential policy shifts to gauge their potential impact on market expansion.
All this information is synthesized to generate precise forecasts for each segment and region. These forecasts illuminate the current state of the market and highlight forthcoming opportunities.

6. Data Structuring
Step 7:
In the final stage, we validate all our estimates using a triangulation method, where data is cross-checked from multiple reliable sources, like company data, primary interviews, and secondary research. This helps us make sure that our numbers are correct and fit with the rest of the market.
This process involves verifying data consistency across various segments and geographic areas. It also requires comparing historical trends with the assumptions support the forecast. Any discrepancies involve adjustments to ensure everything remains aligned and dependable.
Once the data is finalized, we prepare the final outputs, including market size estimates, segment-wise breakdowns, and growth metrics. These are delivered in structured formats such as tables, charts, and data files for easy analysis and use.
We collaborate closely with clients, ensuring the final products align with their requirements. This includes offering tailored adjustments, supplementary data analyses, and continuous assistance. Furthermore, we monitor market trends post-delivery, providing updates and refinements to maintain the insights' relevance as time passes.
Post-delivery, we continue to monitor market shifts, offering updates and adjustments to ensure the insights remain relevant over time.
Validation
Triangulation Framework
- Company-level data
- Primary inputs from industry participants
- Secondary benchmarks and published data
- Variance maintained within ±5-10%
- Adjustments applied to align estimates
- Segment values validated against overall market structure
Quality Check
Data Consistency & Integrity
- Segment totals validated to 100%
- Regional estimates aligned with global market size
- Historical trends compared against forecast outputs
- Assumptions reviewed for cross-segment and regional alignment
Output & Delivery
Final Outputs
- Market size estimates (USD Mn/Bn)
- Segment-wise distribution (%)
- Growth metrics (CAGR %)
- Structured tables and charts
- Segment-level datasets
- Excel-based data files for further analysis
Client Alignment & Support
- Deliverables are aligned with defined client requirements and scope
- Custom data cuts and segment splits are incorporated as required
- Post-delivery queries are addressed through analyst interactions
- Additional clarifications and data support are provided upon request
Client Continuity & Updates
- Market developments are tracked post-delivery to capture changes in key trends
- Updated data and revisions are provided based on new market inputs
- Additional refinements and data cuts are shared as required
- Continued analyst engagement supports evolving client requirements
