
Global Inulin Market Trends, Forecast, Analysis Report, 2026-2034
REPORT DETAILS
Market Statistics
The global inulin market size was valued at USD 2.53 billion in 2025 and is expected to register a CAGR of 6.52% from 2026 to 2034. Market growth is attributed to rising consumer preference for natural prebiotics and functional foods. Recent scientific research into the human gut microbiome has significantly expanded the use of prebiotic fibers such as inulin in functional foods and dietary supplements. As a soluble dietary fiber, inulin powder supports digestive health while improving mineral absorption and metabolic function. These benefits have accelerated its adoption in functional beverages, dairy alternatives, and plant-based food products. It strengthened inulin position in the functional food ingredients market.
Market Insights
- By source, the chicory segment accounted for a revenue share in 2025. Manufacturers seek chicory as a feasible source of inulin, holding the largest market share.
- Based on application analysis, the food and beverage segment dominated the market share in 2025. The dominance is driven by its inherent qualities, such as its ability to serve as a soluble dietary fiber and prebiotic.
- Europe led the global market in 2025 due to the growing emphasis on healthy and functional foods and increasing health-conscious consumer base.
- The Asia Pacific inulin market is poised to register the highest CAGR during the forecast period. The expanding middle class, particularly in densely populated countries like China and India, is driving the market growth.
Industry Dynamics
- Rising geriatric population and increasing disposable Income of consumers propel the inulin powder market growth.
- The growing popularity and diverse applications of inulin boost the market penetration.
- The high production costs associated with extraction hinder the market expansion.
- Inulin is considered as a natural and plant-derived alternative. The emerging trend of clean-label and natural products boosts the market growth.
Market Statistics
Market Size in 2026: USD 2.53 billion
Projected Market Size in 2034: USD 4.46 billion
CAGR, 2026–2034: 6.52%
Largest Regional Market, 2025: Europe
Source: Polaris Market Research Analysis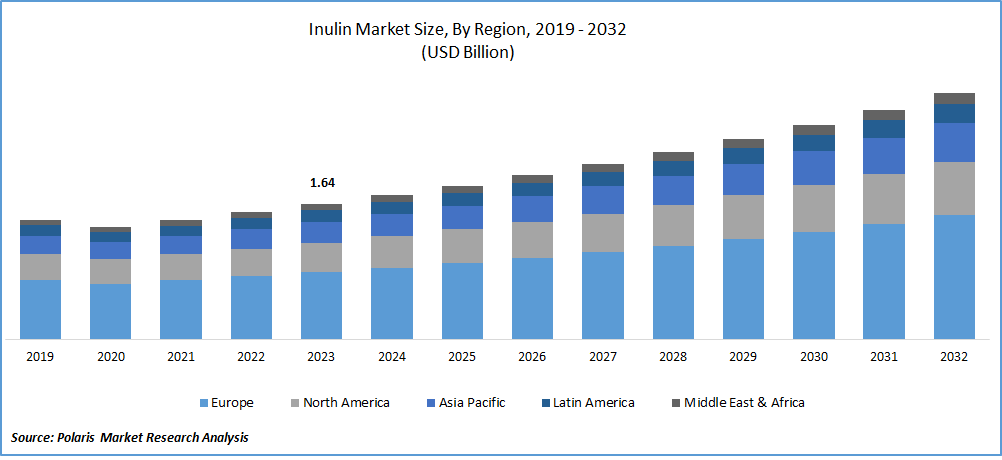
To Understand More About this Research:Download Sample Report
What is Inulin?
Inulin is a naturally occurring polysaccharide. It is often extracted from plants like chicory roots. It belongs to the fructan group and consists of chains of fructose molecules linked together by β (2-1) glycosidic bonds. Inulin can function as a prebiotic ingredient. It promotes the growth of beneficial gut bacteria. This characteristic drives its use in the food and beverage industry. Inulin acts as a soluble fiber. Due to its texturizing and gelling properties, the popularity of inulin in powder form is rising in various food products.
The increasing demand for dietary fiber and functional foods boosts need for inulin in the global prebiotic ingredient market. Food, nutraceutical, and pharmaceutical manufacturers are using inulin powder in their products to increase nutritional value, improve texture, and support digestive health. More consumers are becoming aware of gut microbiome health. Thus, the global inulin market analysis shows strong demand in both developed and emerging markets.
The increasing popularity and variety of uses for this versatile carbohydrate shape the market. Inulin is used not just in food but also in medicines and dietary supplements because of its potential health benefits. It is known to support digestive health, improve calcium absorption, and help with weight management. These benefits respond to the rising consumer demand for ingredients that boost overall well-being.
The COVID-19 pandemic has increased consumer health awareness. Consumers are buying immune health supplements and nutritional supplements. There is a rising demand for sustainable and organic food & beverages products. The prevalence of lifestyle-related health conditions, such as obesity and digestive disorders, is rising. This increase drives demand for functional ingredients like inulin. Many see inulin as a natural, plant-based option. Therefore, the rising popularity of clean-label and natural products fuels the market expansion.
The high production costs associated with extracting, especially from chicory roots, act as a restraining factor. Also, the limited availability of raw materials and fluctuations in their prices may impact the overall cost dynamics of production. Regulatory complexities and standards about health claims associated with inulin products pose challenges for industry players.
Inulin Market Growth Drivers
Increased Geriatric Population and Disposable Income of Consumers
The growth of the market is fueled by the growing elderly population and rising disposable income among consumers. Older people are increasingly looking for dietary solutions to deal with health issues related to aging. Inulin is known for its benefits to digestive health and overall well-being. This makes it a popular ingredient in products aimed at this group. As consumers' disposable income increases, they can make better and healthier choices regarding their diets. With higher income levels, people are more likely to invest in products that provide health benefits. Inulin is a natural and flexible ingredient used in many food and drink products. This has led to more consumers choosing inulin-based products, as they are willing to spend on items that support their wellness.
Rising Focus on Preventive Healthcare and Personalized Nutrition
The growing prevalence of digestive disorders, obesity, and metabolic diseases has increased consumer interest in gut-health ingredients and prebiotic supplements. The increasing use of inulin powder in reduced-sugar food formulations is also contributing to market expansion. Food manufacturers are using inulin as a natural replacement for sugar and fat in bakery products, dairy alternatives, and snack foods. The global trend toward preventive healthcare and personalized nutrition is increasing demand for functional ingredients like inulin.
Source: Polaris Market Research Analysis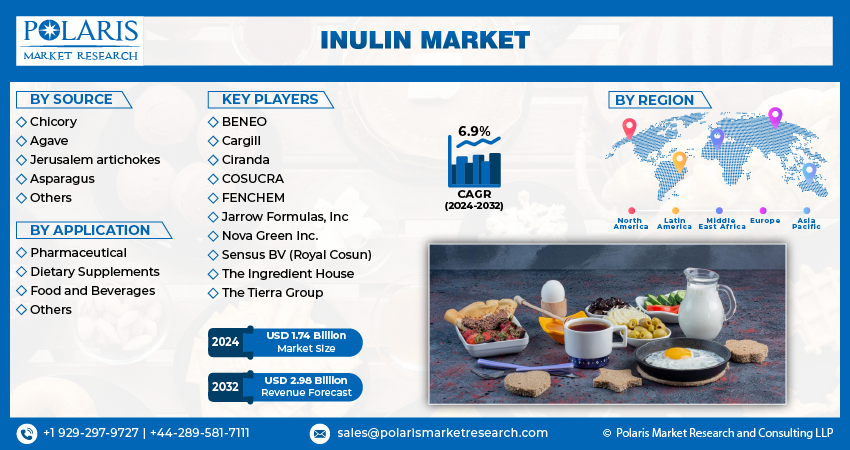
Get Full Segment-Level Forecasts & Insights: Download Sample Report
Segmentation Analysis
By Source Analysis
Based on source segment, the market is segmented into chicory, agave, Jerusalem artichokes, asparagus, and others. The chicory segment held the largest market share in 2025. Chicory roots are key raw materials for commercial inulin production. It is due to their high fructan concentration and efficient extraction process. Large-scale cultivation in Europe, particularly in Belgium, France, and the Netherlands, boost the chicory root inulin market growth. Easy availability in powdered and liquid form also drives the segment growth. There is a rising demand for natural prebiotics in functional foods, dairy alternatives, and dietary supplements. This factor propels the segment dominance. Cost-effectiveness and established supply chains bolster the segment expansion.
By Application Analysis
The food and beverage segment dominated the market in 2025. Inulin is a soluble dietary fiber and a prebiotic. Thus, it is a popular ingredient in many food and beverage products. Inulin powder improves the nutritional value of food without compromising taste and texture. The powder is often considered a substitute for fat or sugar. This helps create healthier, lower-calorie options. These benefits fit the trend toward healthier lifestyles.
Inulin is derived from chicory roots, asparagus, soybean, and other natural sources. This fits with the growing consumer preference for natural and clean-label products. As consumers become more health-conscious, they seek functional ingredients in their diets. This factor leads to a surge in demand for inulin powder in the food and beverage sector. Inulin's prebiotic properties support gut health and overall well-being. Increasing aging population and more awareness of digestive health propel demand for products that include functional ingredients.
Source: Polaris Market Research Analysis
Need Granular Data Across All Market Segments? Request Customization
Regional Insights
Europe held the largest share of the global market in 2025. This is because more people are focusing on healthy and functional foods. European consumers are increasingly aware of their health. Inulin has prebiotic and dietary fiber properties. This makes it a good match for health and wellness trends. As a result, food and beverage manufacturers use it in a variety of products.
European consumers strongly prefer natural and clean-label products. Inulin, derived from natural sources, is perceived as a natural and plant-based ingredient. Thus, consumer demand for clean-label products boosts the Europe inulin market growth. Rising investments in research and development encourage new product formulations that use inulin. Europe has presence of several major inulin manufacturers and chicory processing facilities. This makes Europe an important center for inulin production. Strong regulatory support for functional foods promotes innovation in the European inulin industry.
The Asia Pacific inulin market is poised to showcase the fastest CAGR in the market over the forecast period. The region is experiencing a notable shift in dietary preferences and lifestyles, with an increasing focus on health and wellness. Awareness of the benefits of dietary fibers and prebiotics, like inulin, is growing. As a result, consumers in the Asia Pacific are interested in functional foods and ingredients that support digestive health and overall well-being. The middle class population is high in densely populated countries like China and India. Rising disposable income of this population drives demand for functional ingredients. Increasing consumption of functional nutrition products boosts the regional market expansion. Also, rising incidence of lifestyle-related health conditions, including gastrointestinal problems and obesity, propels the demand for dietary solutions. Solutions used to address these concerns are made using inulin powder. This factor fuels the market for inulin in Asia Pacific.
Source: Polaris Market Research Analysis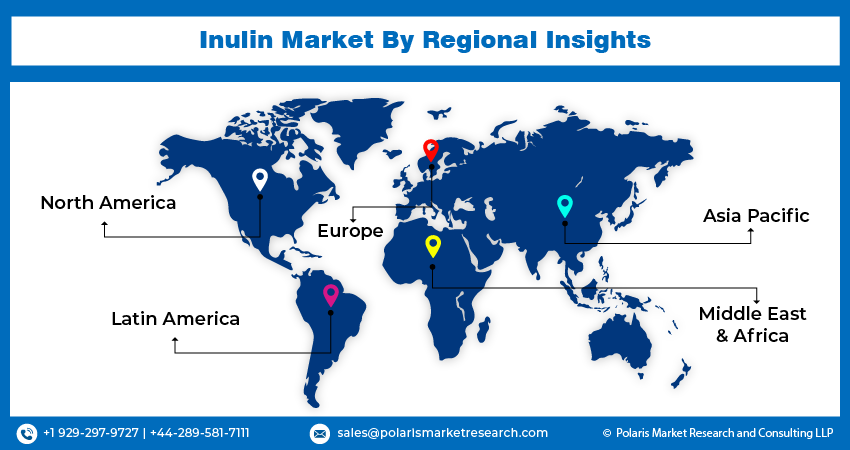
Curious About Regional Market Performance? Request Customization
Key Market Players & Competitive Insights
The leading market players emphasize expanding their presence across various geographies, especially in developing regions. Inulin manufacturers are also launching new inulin products in powder and liquid forms to meet consumer demand. Major players are working on expanding their functional ingredient offerings. They invest in production facilities and create new inulin-based formulations for food and nutraceutical uses. Partnerships between inulin manufacturers and food brands speed up product innovation in the global market.
List of Inulin Market Players
- BENEO
- Cargill
- Ciranda
- COSUCRA
- FENCHEM
- Jarrow Formulas, Inc
- Nova Green Inc.
- Sensus BV (Royal Cosun)
- The Ingredient House
- The Tierra Group
Inulin Industry Developments
- June 2025: Univar Solutions Belgium N.V., a global distributor of specialty ingredients and chemicals, strengthened its partnership with Ingredion Incorporated. Through Univar’s Foodology division, the partnership will broaden Ingredion’s distribution of food and beverage ingredients in the Benelux region. (Source: univarsolutions.com)
- December 2024: GlycoFix launched its new glucose-control capsules. The capsules are formulated with cinnamon extract, bitter melon, and inulin. They naturally support healthy blood sugar levels and boost energy. They also manage hunger and promote metabolic wellness. (Sourcr: marketingbykevin.com)
Inulin Market Segmentation
By Source Outlook (Revenue – USD Billion, 2021–2034)
- Chicory
- Agave
- Jerusalem Artichokes
- Asparagus
- Others
By Form Outlook (Revenue – USD Billion, 2021–2034)
- Liquid
- Powder
By Application Outlook (Revenue – USD Billion, 2021–2034)
- Pharmaceutical
- Dietary Supplements
- Food and Beverages
- Animal Feed Additives
- Others
By Sales Channel Outlook (Revenue – USD Billion, 2021–2034)
- Direct Sales
- Indirect Sales
By Regional Outlook (Revenue – USD Billion, 2021–2034)
- North America
- U.S.
- Canada
- Europe
- Germany
- UK
- France
- Italy
- Spain
- Russia
- Netherlands
- Rest of Europe
- Asia Pacific
- China
- India
- Japan
- South Korea
- Indonesia
- Malaysia
- Rest of Asia Pacific
- Latin America
- Argentina
- Brazil
- Mexico
- Rest of Latin America
- Middle East & Africa
- UAE
- Saudi Arabia
- Israel
- South Africa
- Rest of Middle East & Africa
Inulin Market Report Scope
| Report Attributes | Details |
| Market Size in 2025 | USD 2.53 billion |
| Market Size in 2026 | USD 2.69 billion |
| Revenue Forecast in 2034 | USD 4.46 billion |
| CAGR | 6.52% from 2026 to 2034 |
| Base Year | 2025 |
| Historical Data | 2022–2024 |
| Forecast Period | 2026–2034 |
| Quantitative Units | Revenue in USD billion, 2021–2034 and CAGR from 2026 to 2034 |
| Report Coverage | Revenue Forecast, Market Competitive Landscape, Growth Factors, and Trends |
| Segments Covered |
|
| Regional Scope |
|
| Competitive Landscape |
|
| Report Format |
|
| Customization | Report customization as per your requirements with respect to countries, regions, and segmentation. |
Source: Polaris Market Research Analysis
Inulin Market FAQ's
The global market was valued at USD 2.53 bilslion in 2025. It is projected to reach USD 4.46 billion by 2034 at a CAGR of 6.52%.
Upsurging demand for gut health support and clean-label transparency boosts inulin requirement. Further, increasing preference for plant-based options fuels the market growth.
The chicory segment held the largest revenue share in 2025. The dominance is driven by its recognized prebiotic health benefits and stable raw material availability.
Europe dominated the global market revenue share in 2025. Strong chicory cultivation, clean-label demand, and consumer health awareness support the regional market growth.
Inulin is used to support gut health and boost calcium absorption. It also replaces fat or sugar in food products.
Various industries, including food and beverage, pharmaceuticals, nutraceuticals, and animal feed, use inulin. They use it for its functional, nutritional, and texturizing properties.
Inulin improves digestive health and enhances calcium absorption. It acts as a natural fat and sugar substitute in food formulations.
Download Sample Report of Inulin Market
Please fill out the form to request a customized copy of the research report.
