
Reports

Harmonic Filter Market Size, Share, Growth | Trends, 2025-2034
REPORT DETAILS
REPORT DETAILS
ABOUT THIS REPORT
Market Statistics
Market Overview
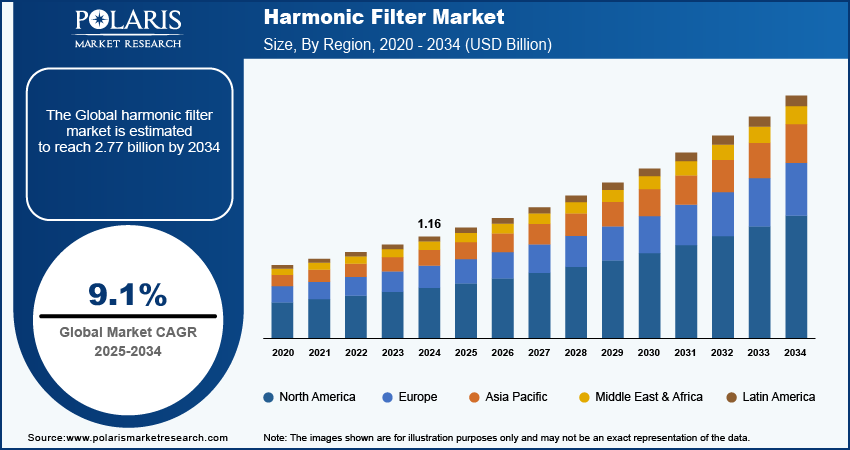
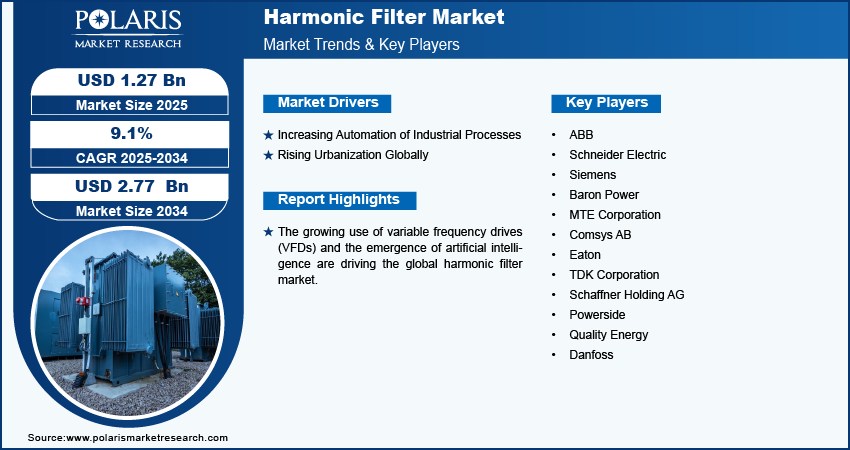
The harmonic filter market size was valued at USD 1.16 billion in 2024. The market is projected to grow from USD 1.27 billion in 2025 to USD 2.77 billion by 2034, exhibiting a CAGR of 9.1% during 2025–2034.
Harmonic filters are essential devices in electrical systems designed to reduce harmonic distortion, which adversely affects power quality and efficiency. Harmonic filters operate by providing a low-impedance path for harmonic currents, allowing them to bypass sensitive equipment and minimizing distortion in the power system.
The growing use of variable frequency drives (VFDs) is driving the global harmonic filter market. VFDs convert AC to DC and then back to AC at variable frequencies, which introduce harmonic distortions in the electrical system, leading to issues such as overheating of equipment, reduced efficiency, and increased losses. Harmonic filters help reduce these issues and expand the efficiency and lifespan of electrical systems, thereby boosting demand.
The emergence of artificial intelligence is propelling the global harmonic filter market growth. AI algorithms analyze data from electrical systems to predict when equipment might fail due to harmonic distortion. This proactive approach encourages the installation of harmonic filters to prevent issues, boosting demand.
To Understand More About this Research: Download Sample Report
Market Driver Analysis
Increasing Automation of Industrial Processes
Automation of industrial processes generally involves the use of variable frequency drives (VFDs) to control motors and other equipment. VFDs generate harmonic distortions, necessitating the installation of harmonic filters to maintain power quality. Furthermore, many automated processes rely on sensitive electronic devices and control systems that are more susceptible to power quality issues. Harmonic filters help protect these systems from the negative effects of harmonics. Therefore, the increasing automation of industrial processes propels the global harmonic filter market.
Rising Urbanization Globally
The rising urbanization globally fuels the harmonic filter market. As per a report published by the UN-Habitat, urban areas are already home to 55% of the world's population, and the percentage is expected to grow to 68% by 2050. Urban areas are increasingly adopting smart technologies for energy management, transportation, and communication. These technologies require stable power sources with minimal harmonic distortion to operate efficiently, boosting the demand for harmonic filtering systems. Moreover, renewable energy solutions such as solar panels are widely deployed in urban areas, prompting the need for effective filtering through harmonic filters to ensure stable grid operation and compliance with power quality regulations.
Market Segment Analysis
Harmonic Filter Market Breakdown by Product Insights
Based on product, the harmonic filter market is categorized into active, passive, and hybrid. The passive segment accounted for a major market share in 2024 due to its widespread application and cost-effectiveness. Passive filters, which consist of fixed components such as inductors, capacitors, and resistors, efficiently mitigate specific harmonic frequencies. Manufacturers favor passive solutions due to lower upfront costs and minimal maintenance requirements. Industries such as manufacturing, oil & gas, and commercial buildings significantly contribute to the demand, as these sectors prioritize stable power quality to avoid equipment damage and enhance operational efficiency.
The active segment is expected to grow at a robust pace in the coming years, owing to the increasing complexity of electrical systems and the need for adaptable solutions. Active filters provide real-time harmonic compensation, dynamically adjusting to varying load conditions and effectively managing a wider range of harmonic frequencies. The growing integration of advanced technologies, such as automation and renewable energy sources, drives the demand for these intelligent systems. Additionally, their ability to reduce overall energy costs by minimizing losses positions them favorably in markets focused on sustainability and efficiency.
Harmonic Filter Market Breakdown by Phase Insights
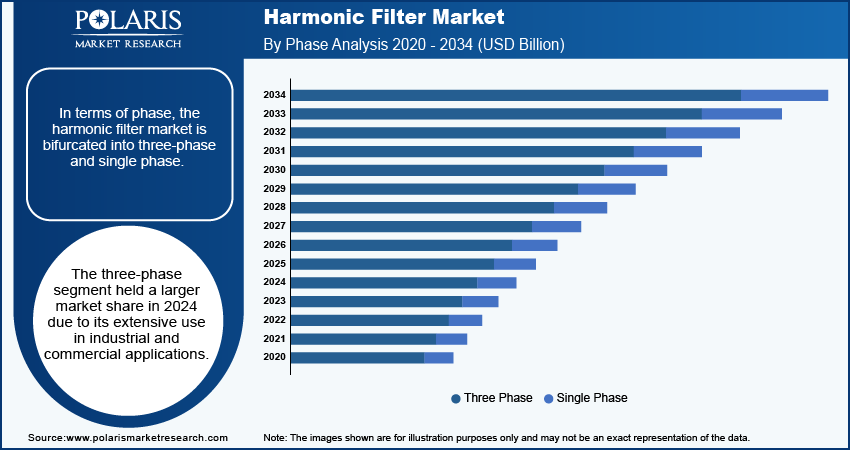
In terms of phase, the harmonic filter market is bifurcated into three-phase and single phase. The three-phase segment held a larger market share in 2024 due to its extensive use in industrial and commercial applications. Three-phase systems provide more efficient power distribution and are ideal for driving large motors and heavy machinery. Industries such as manufacturing, mining, and energy production rely on these systems to maintain operational efficiency and minimize downtime. The stability and reliability of three-phase configurations, combined with their ability to handle higher loads without significant voltage drop, make them the preferred choice for large-scale operations. Additionally, the increasing demand for automation and advanced manufacturing technologies supports the dominance of this segment.
The single-phase segment is projected to grow at a rapid pace during the forecast period owing to its rising adoption in residential and light commercial applications, where smaller loads require efficient power management. The increase in smart homes and IoT devices drives the demand for single-phase solutions, as these systems integrate seamlessly into smaller infrastructures. Moreover, the ongoing shift toward renewable energy sources, such as solar panels and wind turbines, generally favors single-phase configurations, which further enhances their appeal in the market.
Harmonic Filter Market Regional Insights
By region, the study provides the harmonic filter market insights into North America, Europe, Asia Pacific, Latin America, and the Middle East & Africa. North America held the largest market share in 2024 due to the rapid adoption of advanced manufacturing processes and increasing investments in industrial automation. The presence of established industries, such as automotive, aerospace, and energy, significantly contributed to the demand for effective power quality solutions such as harmonic filters in the region. Additionally, regulatory frameworks promoting energy efficiency and power quality standards boosted harmonic filter market growth in the region.
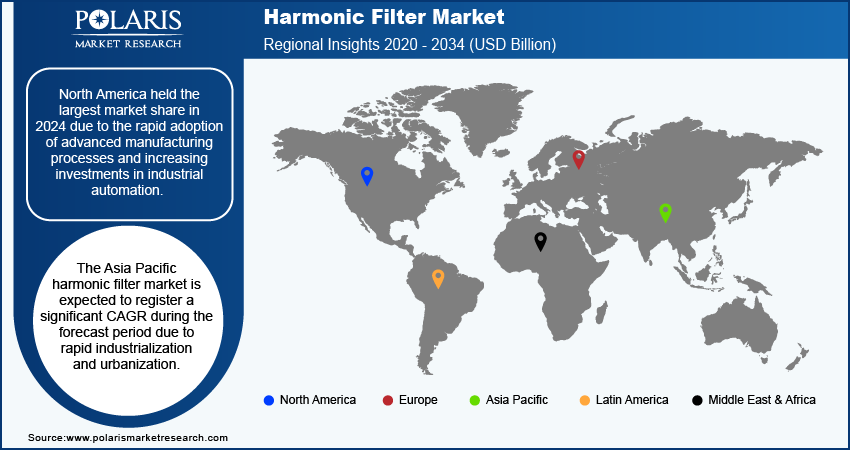
The Asia Pacific harmonic filter market is expected to register a significant CAGR during the forecast period due to rapid industrialization and urbanization. Countries such as China and India play crucial roles in this anticipated growth. China, in particular, continues to lead the regional market due to its expansive manufacturing base and ongoing investments in infrastructure projects. The increasing implementation of smart technologies and renewable energy initiatives in the region drives the demand for effective power quality management solutions such as harmonic filters.
Key Players and Competitive Insights
Prominent market players are investing heavily in research and development to expand their offerings, which will help the harmonic filter market grow even more. Market participants are also undertaking a variety of strategic activities to expand their global footprint, with important market developments such as innovative launches, international collaborations, higher investments, and mergers and acquisitions between organizations.
The harmonic filter market is fragmented, with the presence of numerous global and regional market players. Major players in the market are ABB, Schneider Electric, Siemens, Baron Power, MTE Corporation, Comsys AB, Eaton, TDK Corporation, Schaffner Holding AG, Quality Energy, Powerside, and Danfoss.
Schaffner Holding AG, headquartered in Luterbach, Switzerland, is a prominent player in the field of electromagnetic compatibility (EMC) and power quality solutions. Established to address the growing needs of electronic systems, Schaffner specializes in developing and manufacturing components that ensure reliable operation in various industrial and automotive applications. The company operates through three main divisions: Electromagnetic Compatibility (EMC), Power Magnetics (PM), and Automotive (AM). Each division focuses on specific market needs, providing tailored solutions that enhance the performance of electronic devices while mitigating interference from electrical noise.
Comsys AB is a Swedish company specializing in advanced power quality solutions, particularly in the realm of harmonic filtering. Established with a vision to enhance electrical systems' efficiency and reliability, Comsys has developed a range of products that address the challenges posed by harmonic distortion in power systems. Harmonics, which are voltage or current waveforms that are integer multiples of the fundamental frequency, lead to significant operational issues, including overheating of equipment, reduced efficiency, and increased operational costs. Comsys's primary offering, the Active Harmonic Filter (AHF), is designed to mitigate these issues effectively.
Key Companies in Harmonic Filter Market
- ABB
- Schneider Electric
- Siemens
- Baron Power
- MTE Corporation
- Comsys AB
- Eaton
- TDK Corporation
- Schaffner Holding AG
- Powerside
- Quality Energy
- Danfoss
Industry Developments
- September 2025: MTE, LLC, a leading global supplier of power quality solutions, announced the launch of its newest product line, SyntriX AHF, a next-generation active filter featuring innovative Silicon Carbide (SiC) technology and control software. The system sets a new benchmark for efficiency, adaptability, and compact design in harmonic mitigation. Silicon Carbide design delivers over 99% efficiency, ultra-fast response, and a footprint up to 30% smaller than legacy systems.
- July 2025: Hitachi Energy announced the extension of a long-term service partnership with Eletrobras, a leader in the generation and transmission of electricity in Brazil, for the Rio Madeira high-voltage direct current (HVDC) system. The 2,375-kilometer (km) HVDC link is one of the longest in the world, and for over a decade, the system has benefited from Hitachi Energys HVDC technology under an EnCompass long-term service agreement to deliver 3.15 GW of power to some 45 million people
- January 2023: Danfoss A/S, a Denmark-based company that designs and manufactures technologies and solutions for a variety of industries, launched efficient harmonic mitigation that reduces harmonic filter power loss by 60%.
- September 2023: Quality Energy, an Australia-based power quality and energy efficiency solutions manufacturer, introduced a new range of Active Harmonic Filters. The filters have high input impedance and very low output impedance.
- October 2023: Powerside, a global player in power grid technology, launched two solutions, the PQ Edge Power Analyzer and the PowerAct Hybrid Harmonic Filter, designed to advance the optimization of power quality across industries.
Market Segmentation
By Product Outlook (Revenue, USD Billion, 2020–2034)
- Active
- Passive
- Hybrid
By Phase Outlook (Revenue, USD Billion, 2020–2034)
- Single Phase
- Three Phase
By Voltage Outlook (Revenue, USD Billion, 2020–2034)
- Low Voltage
- Medium Voltage
- High Voltage
By End Use Outlook (Revenue, USD Billion, 2020–2034)
- Industrial
- Commercial
- Residential
By Regional Outlook (Revenue, USD Billion, 2020–2034)
- North America
- US
- Canada
- Europe
- Germany
- France
- UK
- Italy
- Spain
- Netherlands
- Russia
- Rest of Europe
- Asia Pacific
- China
- Japan
- India
- Malaysia
- South Korea
- Indonesia
- Australia
- Rest of Asia Pacific
- Middle East & Africa
- Saudi Arabia
- UAE
- Israel
- South Africa
- Rest of Middle East & Africa
- Latin America
- Mexico
- Brazil
- Argentina
- Rest of Latin America
Market Report Scope
| Report Attributes | Details |
| Market Size Value in 2024 | USD 1.16 Billion |
| Market Size Value in 2025 | USD 1.27 Billion |
| Revenue Forecast by 2034 | USD 2.77 Billion |
| CAGR | 9.1% from 2025 to 2034 |
| Base Year | 2024 |
| Historical Data | 2020–2023 |
| Forecast Period | 2025–2034 |
| Quantitative Units | Revenue in USD Billion and CAGR from 2025 to 2034 |
| Report Coverage | Revenue Forecast, Market Competitive Landscape, Growth Factors, and Trends |
| Segments Covered |
|
| Regional Scope |
|
| Competitive Landscape |
|
| Report Format |
|
| Customization | Report customization as per your requirements with respect to countries, regions, and segmentation. |
FAQ's
The global harmonic filter market size was valued at USD 1.16 billion in 2024 and is projected to grow to USD 2.77 billion by 2034.
The global market is projected to register a CAGR of 9.1% during the forecast period.
North America accounted for the largest share of the global market in 2024.
A few key players in the market are ABB, Schneider Electric, Siemens, Baron Power, MTE Corporation, Comsys AB, Eaton, TDK Corporation, Schaffner Holding AG, Quality Energy, Powerside, and Danfoss.
The active segment is projected for significant growth in the global market during the forecast period.
The three-phase segment dominated the market in 2024.
Download Sample Report of Harmonic Filter Market
Please fill out the form to request a customized copy of the research report.
