

Market Overview
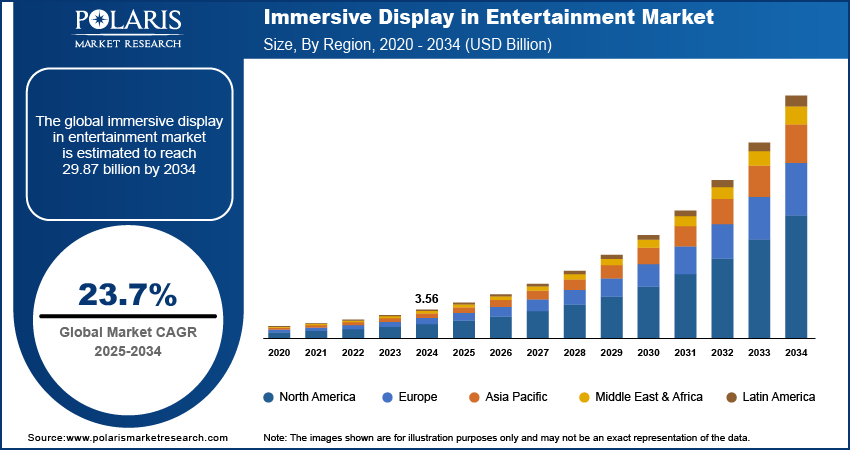
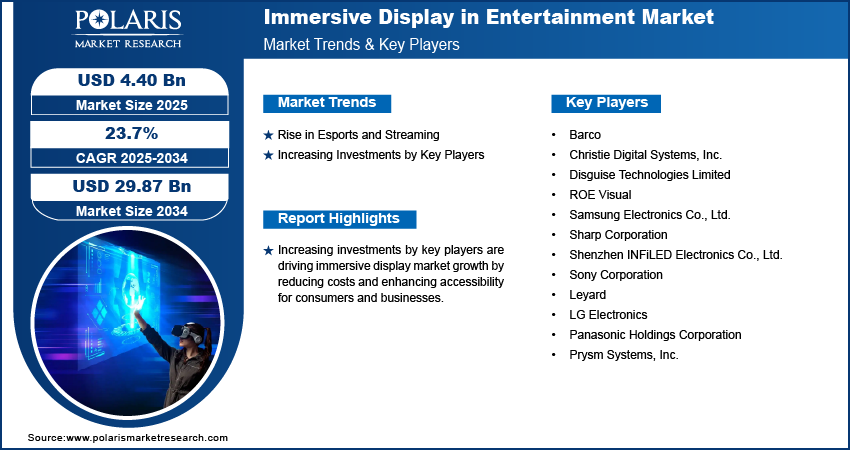
The immersive display in entertainment market size was valued at USD 3.56 billion in 2024, exhibiting a CAGR of 23.7% during 2025–2034. The increasing need for immersive experiences is driving market growth, along with the expansion of esports and streaming, strategic collaborations, and rising investments, all of which enhance affordability and accessibility.
Key Insights
- The LED segment will grow the fastest, fueled by the need for high-end immersive displays and the development of mini- and micro-LED technology.
- The 4K segment will lead the market because of its immersive nature and the ubiquitous presence of 4K content.
- In 2024, North America dominated the market in terms of revenue due to increased consumer expenditure on sophisticated and flexible electronics.
- Asia Pacific expands with the likes of Samsung and Sony, boosting consumer demand and fostering collaborations that enhance immersive experiences.
Industry Dynamics
- Declining prices are bringing immersive displays within reach, increasing demand and market growth across platforms.
- The boom in esports and live streaming is propelling demand for immersive displays in the entertainment space.
- Growing investments by major players are reducing expenses and accelerating the growth of the immersive display market.
- Technical problems and high expenses cap the growth of the market.
Market Statistics
2024 Market Size: USD 3.56 billion
2034 Projected Market Size: USD 29.87 billion
CAGR (2025-2034): 23.7%
North America: Largest Market Share
To Understand More About this Research: Request a Free Sample Report
Immersive displays in entertainment refer to advanced visual technologies that create a highly engaging and interactive viewing experience. These displays often utilize techniques such as 3D imagery, curved screens, virtual reality (VR), and augmented reality (AR) to envelop viewers in the content. The growing desire for enhanced user experiences is a major factor driving the adoption of immersive displays, positively impacting the immersive displays in entertainment market growth. As audiences desire more in-depth engagement and interactivity, advanced viewing methods are required. Immersive displays, comprising virtual and augmented reality technologies, transform the way consumers experience content by creating captivating and interactive environments.
The expansion of the immersive displays in the entertainment market is being driven by more mergers, acquisitions, and strategic partnerships between market players. For example, recent mergers between companies like Barco and Christie Digital, as well as partnerships between Samsung and Sony, are helping to expand market reach. These collaborations allow companies to share resources and expertise, leading to more affordable solutions that make immersive experiences accessible to a wider audience, including low-income consumers. As a result, immersive displays are becoming more affordable, allowing more people to enjoy better entertainment options. This is increasing demand and growing the market for immersive displays across different platforms.
Market Drivers
Rise in Esports and Streaming
The growth of esports and live streaming is driving the immersive display in entertainment market demand. According to Newzoo, the live-streaming audience for games reached ∼728.8 million by the end of 2021, reflecting a 10% growth from 2020. This growing audience is creating a higher demand for immersive experiences that can enhance viewer engagement and excitement. Additionally, esports and streaming platforms are investing in advanced display technologies to attract and retain audiences, due to which the demand for immersive displays for delivering captivating and interactive content is rising. Therefore, the rise in esports and live streaming is significantly contributing to the growth of immersive displays in the entertainment market.
Increasing Investments by Key Players
Companies allocate substantial resources to innovate and scale production. Thus, prices for advanced technologies, such as OLED and VR displays, decrease, making them more accessible to consumers and businesses alike. In 2024, Samsung Display invested USD 1.8 billion in a new OLED plant in Vietnam, raising the total investment to USD 8.3 billion. Such investments aimed at cost-cutting of various operations led to overall cost-effectiveness in the final product leading to better serving to a broader audience. Thus, increasing investments by key players drive the immersive display in entertainment market development.
Segment Insights
Market Outlook – Technology Insights
The immersive display in entertainment market segmentation, based on technology, includes LED, OLED, and others. The LED technology segment is expected to experience significant growth at the highest CAGR in the global market during the forecast period. The demand for high-resolution displays is increasing in gaming, virtual reality, and live events. LED technology offers vibrant colors and enhanced brightness, making it ideal for immersive experiences. Advancements in mini-LED and micro-LED technologies are further improving display quality while reducing costs. As a result, the LED segment is experiencing growth in the global market.
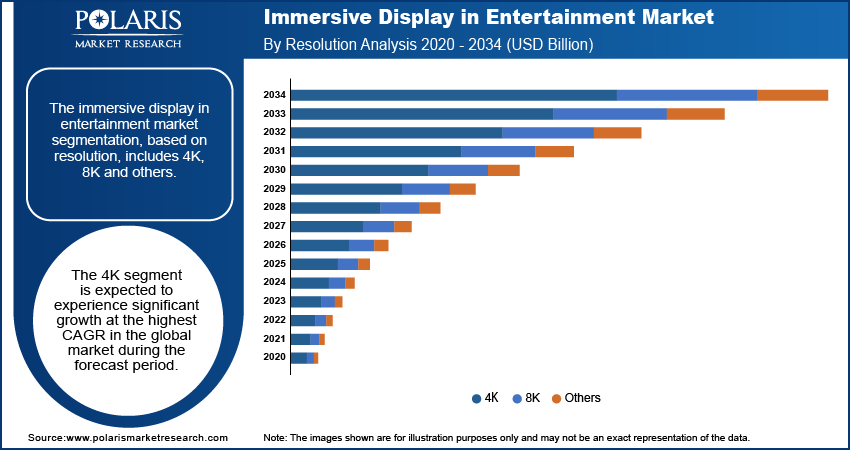
Market Outlook – Resolution Insights
The immersive display in entertainment market segmentation, based on application, includes 4K, 8K, and others. The 4K segment is expected to dominate the market during the forecasted years. 4K displays provide an immersive environment that enhances engagement. The proliferation of 4K content across various platforms further drives this trend, making it a preferred choice among consumers and content creators alike, leading to segmental dominance in the global market.
Regional Insights
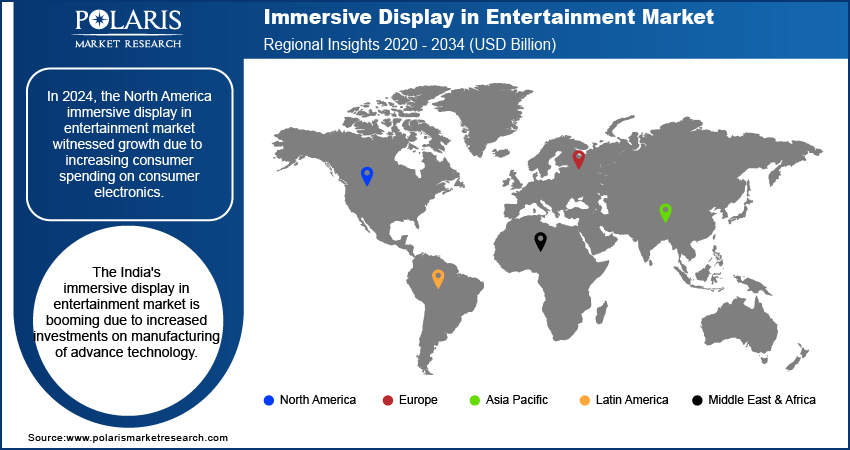
By region, the study provides the immersive display in entertainment market insights into North America, Europe, Asia Pacific, Latin America, and the Middle East & Africa. In 2024, North America held the largest revenue share of the market due to increasing consumer spending on advance consumer electronics. According to the US Bureau of Economic Analysis, in the second quarter of 2024, consumer spending on consumer electronics in the US rose to USD 15,967.30 billion, up from USD 15,856.90 billion in the first quarter. This upward trend is expected to increase the demand for premium entertainment experiences, encouraging investments in advanced immersive display technologies. Consumers are seeking enhanced visual engagement in gaming, streaming, and live events, which is propelling the demand for immersive displays in the entertainment market in North America.
The Asia Pacific immersive display in entertainment market expansion is attributed to the presence of major players such as Samsung, Sony, and LG. These companies are innovating with advanced technologies such as OLED and VR. Additionally, increasing consumer demand for high-quality visuals and interactive content fuels market growth. Collaborations between tech firms and entertainment providers further enhance immersive experiences.
The India immersive display in entertainment market is rapidly expanding due to increasing investments and advancements in technology. In 2024, Samsung Semiconductor India established a new R&D facility in Bengaluru, India, to enhance local innovation and support business expansion. This investment will foster the development of cutting-edge display technologies, improving immersive experiences in gaming, films, and virtual reality. Additionally, rising consumer demand for high-quality visual content and interactive experiences, coupled with government initiatives to promote digital infrastructure, is positively impacting the immersive display in entertainment market growth in India.
Key Players and Competitive Insights
The immersive display in entertainment market is constantly evolving, with numerous companies striving to innovate and distinguish themselves. Leading global corporations dominate the market by leveraging extensive research and development, advanced software technologies, and significant capital to maintain a competitive edge. These companies pursue strategic initiatives such as mergers and acquisitions, partnerships, and collaborations to enhance their product offerings and expand into new markets.
New companies are impacting the industry by introducing innovative products and meeting the needs of specific market sectors. This competitive environment is amplified by continuous progress in product offerings and new components, greater emphasis on sustainability, and the rising requirement for tailor-made products in diverse industries. A few major players in the immersive display in entertainment market include Barco; Christie Digital Systems, Inc.; Disguise Technologies Limited; ROE Visual; Samsung Electronics Co., Ltd.; Sharp Corporation; Shenzhen INFiLED Electronics Co., Ltd.; Sony Corporation; Leyard; LG Electronics; Panasonic Holdings Corporation; and Prysm Systems, Inc.
Sony Corporation is a Japanese multinational conglomerate headquartered in Minato, Tokyo. Founded in 1946 by Masaru Ibuka and Akio Morita, the company initially focused on electronics and has since diversified into various sectors, including entertainment, gaming, and financial services. Sony Corporation is widely recognized for its products such as Walkman, PlayStation gaming consoles, high-definition televisions, and others. As of 2020, Sony operates through several business segments: Game & Network Services, Music, Pictures, Electronics Products & Solutions, Imaging & Sensing Solutions, and Financial Services. The company has over 200 subsidiaries worldwide and a workforce exceeding 100,000 employees. In January 2024, Sony Corporation announced the development of an immersive spatial content creation system featuring a high-quality XR head-mounted display and intuitive controllers. Collaboration with Siemens was established for industrial design solutions, with availability expected later in 2024.
Samsung Electronics Co., Ltd. is a South Korean multinational electronics company and a flagship subsidiary of the Samsung Group, headquartered in Suwon. Established in 1969, the company operates in the manufacturing of consumer electronics, semiconductors, and telecommunications equipment. Samsung's diverse product portfolio includes smartphones, televisions, home appliances, and various electronic components such as memory chips and displays. In 2012, Samsung was ranked as the highest Asian company in Interbrand's list of best global brands. The company operates on a global scale, with a presence in numerous countries across all regions.
List Of Key Companies
- Barco
- Christie Digital Systems, Inc.
- Disguise Technologies Limited
- ROE Visual
- Samsung Electronics Co., Ltd.
- Sharp Corporation
- Shenzhen INFiLED Electronics Co., Ltd.
- Sony Corporation
- Leyard
- LG Electronics
- Panasonic Holdings Corporation
- Prysm Systems, Inc.
Industry Developments
August 2025: Six Flags Entertainment reports Q2 revenues of USD 930 million and initiates USD 90 million cost-reduction plan post-merger, signalling margin-expansion focus.July 2025: EPR Properties posts 8.4% AFFO growth on USD 175 million revenue, raising full-year guidance and monthly dividend.June 2025: Universal opens USD 7 billion Epic Universe in Orlando, forecasting USD 2 billion first-year economic impact.May 2025: Cosm raises USD 300 million to fund immersive sports domes in Europe, Asia, and Australia
September 2024: Brelyon announced the launch of its innovative displays, allowing immersive virtual experiences without headsets. The technology utilized a new processing layer to enhance visual depth, making it suitable for various applications, including gaming and flight simulation, driving significant market interest.
September 2024: Zebronics announced the launch of its new range of curved monitors, featuring the flagship ZEB-N49A with a 49-inch display. The lineup was designed to enhance visual experiences for professionals and gaming enthusiasts, offering advanced features and stunning color accuracy.
Market Segmentation
By Technology Outlook (USD Billion, 2020–2034)
- LED
- OLED
- Others
By Resolution Outlook (USD Billion, 2020–2034)
- 4K
- 8K
- Others
By Application Outlook (USD Billion, 2020–2034)
- Theater & Cinema
- Entertainment Venues
- Museum & Exhibitions
- Content Creation Studios
- Theme Parks & Amusement Parks
- Others
By Regional Outlook (USD Billion, 2020–2034)
- North America
- US
- Canada
- Europe
- Germany
- France
- UK
- Italy
- Spain
- Netherlands
- Russia
- Rest of Europe
- Asia Pacific
- China
- Japan
- India
- Malaysia
- South Korea
- Indonesia
- Australia
- Rest of Asia Pacific
- Middle East & Africa
- Saudi Arabia
- UAE
- Israel
- South Africa
- Rest of Middle East & Africa
- Latin America
- Mexico
- Brazil
- Argentina
- Rest of Latin America
Market Report Scope
|
Report Attributes |
Details |
|
Market size value in 2024 |
USD 3.56 billion |
|
Market size value in 2025 |
USD 4.40 billion |
|
Revenue Forecast by 2034 |
USD 29.87 billion |
|
CAGR |
23.7% from 2025 to 2034 |
|
Base Year |
2024 |
|
Historical Data |
2020–2023 |
|
Forecast Period |
2025–2034 |
|
Quantitative Units |
Revenue in USD billion and CAGR from 2025 to 2034 |
|
Report Coverage |
Revenue Forecast, Market Competitive Landscape, Growth Factors, and Trends |
|
Segments Covered |
|
|
Regional Scope |
|
|
Competitive Landscape |
|
|
Report Format |
|
|
Customization |
Report customization as per your requirements with respect to countries, regions, and segmentation. |
FAQ's
The immersive display in entertainment market value reached USD 3.56 billion in 2024 and is projected to grow to USD 29.87 billion by 2034.
The global market is projected to register a CAGR of 23.7% during 2025–2034.
North America held the largest share of the global market in 2024.
A few key players in the market are Barco; Christie Digital Systems, Inc.; Disguise Technologies Limited; ROE Visual; Samsung Electronics Co., Ltd.; Sharp Corporation; Shenzhen INFiLED Electronics Co., Ltd.; Sony Corporation; Leyard; LG Electronics; Panasonic Holdings Corporation; and Prysm Systems, Inc.
The LED segment is anticipated to experience substantial growth at a significant CAGR in the global market during the forecast period due to rising demand for high-resolution displays in gaming, virtual reality, and live events.
The 4K segment accounted for the largest revenue share of the market in 2024 due to the increasing demand to enhance engagement.
Page last updated on:
Dec-2024
Research Methodology
A robust system of research, verification, and forecasting designed to ensure reliable and actionable market insights.
Polaris Market Research uses a clear and structured approach to deliver insights that clients can rely on. The process combines detailed primary and secondary research, including direct communication with industry experts. The detailed information helps build a complete picture of market trends and developments. Secondary data is gathered from credible sources such as industry reports, company filings, government source links, and trusted organization databases. It is then cross-checked through discussions with key stakeholders across the value chain. Market size and forecasts are developed using both bottom-up and top-down methods to ensure accuracy and consistency in the final results.

Project Setup
Step 1 & 2:
- We start every project by clearly understanding the client’s objective or goal, then defining the market scope, and aligning regions, segments, and timelines.
- Once the foundation is set, we collect data from all-around of sources, including company reports, government databases, and paid industry platforms.
- Our research is based on secondary data, which helps us build a strong understanding of the market across regions and industries. Then we validate this information through primary research by speaking directly with industry experts, companies, and stakeholders.
- By combining secondary and primary research, we ensure that our market insights are accurate, practical, and closely aligned with real market conditions.
Data Collection
We gather information from both public and verified sources:

Data Structuring
Step 3:
- All collected data is organized into a consistent format to ensure accurate analysis. Since inputs come from multiple sources, they are standardized and aligned before use.
- The data is segmented by product, application, and region, and mapped across a defined historical period (2020–2024). All values are converted into common units (USD Mn/Bn), and volume and pricing are aligned where required to estimate revenue.
- Any overlaps or inconsistencies are reviewed and adjusted to maintain accuracy (<5% variance threshold).
- The result is a structured dataset that allows for clear comparison across regions and supports reliable analysis and forecasting.
Structured Market Dataset, USD Mn/Bn

4. Data Structuring
Step 4: TOP-DOWN APPROACH
- We start with the overall market size at a global or macro level.
- The market is then narrowed down based on scope and industry relevance.
- We apply penetration rates and split the data by region and segment.
- This helps us estimate the market size for specific segments.
- The numbers are validated through cross-checks to ensure accuracy.

Step 5: BOTTOM-UP APPROACH
- We begin by analyzing data from leading companies in the market.
- Revenue data is collected and mapped across different segments.
- The data is then aggregated to estimate the total market size.
- To fill in any gaps, adjustments are made based on industry standards.
- Validation checks make sure that the results are correct.

5. Data Structuring
Step 6:
At Polaris Market Research, we employ a methodical forecasting strategy. This approach blends the analysis of historical data with real-time market validation. To forecast future trends with precision, we examine past patterns, pricing fluctuations, and the interplay of supply and demand. To ensure our conclusions reflect the present market landscape, we actively seek input from industry experts and key stakeholders.
To refine our predictions, we carefully consider critical elements such as market drivers and restraints, fluctuations in raw material costs, emerging technologies, and the production capabilities of various regions. Furthermore, we assess regulatory frameworks and potential policy shifts to gauge their potential impact on market expansion.
All this information is synthesized to generate precise forecasts for each segment and region. These forecasts illuminate the current state of the market and highlight forthcoming opportunities.

6. Data Structuring
Step 7:
In the final stage, we validate all our estimates using a triangulation method, where data is cross-checked from multiple reliable sources, like company data, primary interviews, and secondary research. This helps us make sure that our numbers are correct and fit with the rest of the market.
This process involves verifying data consistency across various segments and geographic areas. It also requires comparing historical trends with the assumptions support the forecast. Any discrepancies involve adjustments to ensure everything remains aligned and dependable.
Once the data is finalized, we prepare the final outputs, including market size estimates, segment-wise breakdowns, and growth metrics. These are delivered in structured formats such as tables, charts, and data files for easy analysis and use.
We collaborate closely with clients, ensuring the final products align with their requirements. This includes offering tailored adjustments, supplementary data analyses, and continuous assistance. Furthermore, we monitor market trends post-delivery, providing updates and refinements to maintain the insights' relevance as time passes.
Post-delivery, we continue to monitor market shifts, offering updates and adjustments to ensure the insights remain relevant over time.
Validation
Triangulation Framework
- Company-level data
- Primary inputs from industry participants
- Secondary benchmarks and published data
- Variance maintained within ±5-10%
- Adjustments applied to align estimates
- Segment values validated against overall market structure
Quality Check
Data Consistency & Integrity
- Segment totals validated to 100%
- Regional estimates aligned with global market size
- Historical trends compared against forecast outputs
- Assumptions reviewed for cross-segment and regional alignment
Output & Delivery
Final Outputs
- Market size estimates (USD Mn/Bn)
- Segment-wise distribution (%)
- Growth metrics (CAGR %)
- Structured tables and charts
- Segment-level datasets
- Excel-based data files for further analysis
Client Alignment & Support
- Deliverables are aligned with defined client requirements and scope
- Custom data cuts and segment splits are incorporated as required
- Post-delivery queries are addressed through analyst interactions
- Additional clarifications and data support are provided upon request
Client Continuity & Updates
- Market developments are tracked post-delivery to capture changes in key trends
- Updated data and revisions are provided based on new market inputs
- Additional refinements and data cuts are shared as required
- Continued analyst engagement supports evolving client requirements
