
Reports

In App Advertising Market Size & Share Global Analysis Report, 2025-2034
REPORT DETAILS
REPORT DETAILS
ABOUT THIS REPORT
What is In-App Advertising Market Size?
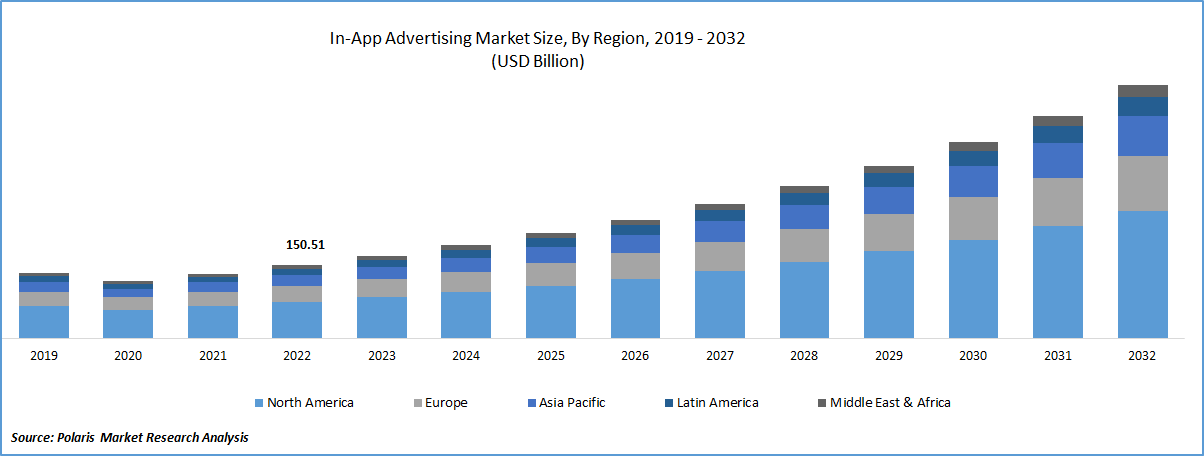
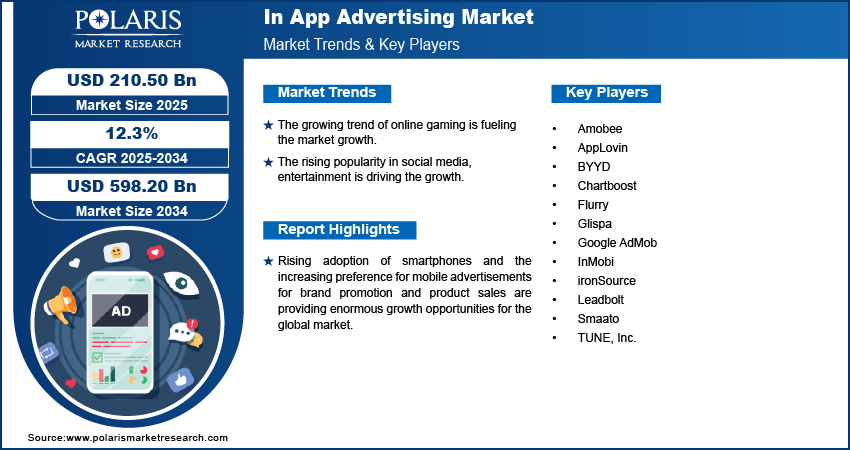
The global in-app advertising market was valued at USD 187.93 billion in 2024 and is expected to grow at a CAGR of 12.3% during the forecast period. Rising adoption of smartphones and the increasing preference for mobile advertisements for brand promotion and product sales are providing enormous growth opportunities for the global market.
Key Insights
- The iOS segment is expected to witness significant growth during the forecast period due to its stronger presence in developed regions.
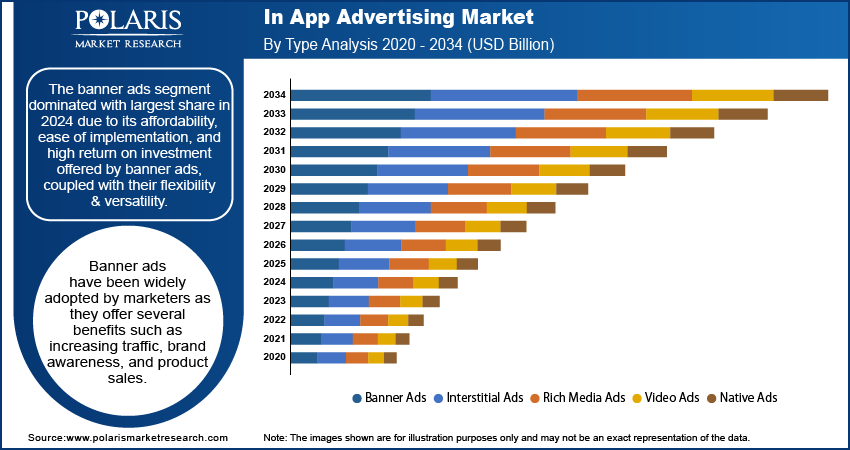
- The banner ads dominated with largest share in 2024 due to its due to its affordability, ease of implementation, and high return on investment.
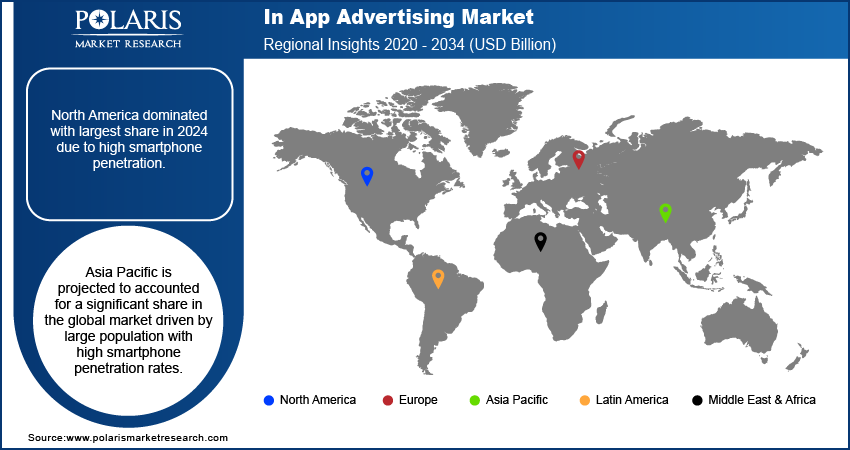
- North America dominated with largest share in 2024 due to high smartphone penetration.
- Asia Pacific is projected to accounted for a significant share in the global market driven by large population with high smartphone penetration rates.
Industry Dynamics
- The growing trend of online gaming is fueling the market growth.
- The rising popularity in social media, entertainment is driving the growth.
- The high smartphone penetration is boosting the industry growth.
- Growing user concerns over privacy and data tracking limitations are limiting the adoption.
Market Statistics
- 2024 Market Size: USD 187.93 Billion
- 2034 Projected Market Size: USD 598.20 Billion
- CAGR (2025-2034): 12.3%
- Largest Market: North America
Impact of AI on Industry
- Enables personalized targeting by analyzing user behavior, preferences, and context to deliver highly relevant ads
- Optimize bids in real time based on user value prediction.
- Generates or adapts ad creatives dynamically based on user data.
To Understand More About this Research: Download Sample Report
In-app advertising refers to the placement of ads within mobile applications. Advertisers use in-app ads to promote their brands, products, and services to the targeted audience.
Industry has seen rapid growth in recent years due to the widespread adoption of mobile devices and the increasing usage of mobile apps. In-app advertising offers several benefits to advertisers, such as the ability to reach a highly engaged audience and the ability to target users based on their interests, behaviours, and demographics. Moreover, in-app advertising is an effective way for advertisers to optimize return on investment (ROI) and profitability. In-app ads provide better visibility, higher click-through rates (CTRs), and increased engagement compared to traditional advertising methods. Advertisers track and analyse the performance of their in-app ads and optimize their campaigns in real-time to achieve better results. It also offers several ad formats that provide a more immersive and interactive experience for users, such as interactive video ads, playable ads, and rewarded ads. These formats not only capture users' attention but also provide them with a valuable and engaging experience, leading to better engagement and higher conversion rates.
While some customers may be reluctant to make purchases on mobile devices, they still use their smartphones to find product information before making a purchase decision. This behaviour is known as "showrooming," where customers use their smartphones to compare prices, read reviews, and research products before making a purchase. This trend highlights the importance of in-app advertising, as it allows advertisers to target users during the research phase and provide them with relevant and engaging product information. Moreover, smartphone users spend more than 90% of their time on various applications, making it an ideal choice for marketers to advertise their products and services. This behaviour presents a significant opportunity for advertisers to reach their target audience and increase brand awareness through in-app advertising.
Industry Dynamics
What Factors are Driving the In-App Advertising Market Growth?
Rapidly rising trend of online gaming and the increased popularity of e-commerce platforms and applications are expected to propel the further growth of the in-app advertising market. This trend has created new opportunities for advertisers to reach their target audience and increase engagement through in-app advertising. The higher click-through rate of in-app advertising compared to mobile web advertising is one of the primary reasons for the increasing spending on in-app advertisements. This is due to the more engaging user experience and the ability to target specific audiences based on their interests, behaviours, and demographics. In addition to gaming and e-commerce applications, in-app advertising is becoming increasingly popular in other verticals, such as social media, entertainment, news, and sports. This trend is further driving the growth of the in-app advertising industry, creating new opportunities for advertisers to reach their target audience and build brand awareness.
Report Segmentation
The market is primarily segmented based type, platform, application, and region.
| By Type | By Platform | By Application | By Region |
|
|
|
|
To Understand the Scope of this Report: Request Customization
Why Banner Ads Segment Dominated with Largest Share?
The banner ads segment dominated with largest share in 2024 due to its affordability, ease of implementation, and high return on investment offered by banner ads, coupled with their flexibility & versatility. Banner ads have been widely adopted by marketers as they offer several benefits such as increasing traffic, brand awareness, and product sales. This ads are easy to create and can be customized to match the look and feel of the app, making them an effective tool for building brand recognition and engaging with the target audience. Moreover, banner ads offer high returns on investment, resulting in numerous growth opportunities for the banner ads segment over the forecast period. Advertisers create highly targeted and personalized banner ads that are more likely to convert users into customers with the help of advanced targeting technologies and data-driven ad optimization, thereby driving the segment growth.
Which Segment by Platform is Expected to Witness Significant Growth?
The iOS segment is expected to witness significant growth during the strong presence in the high value markets such as North America, Europe, and Asia Pacific. This strong presence is driven by high disposable income in this region, which is supporting population to spend on the smartphone with advance features. Moreover, strong user monetization is further driving the growth. iOS users tend to have higher Average Revenue Per User compared to Android use due to which They are more likely to make in-app purchases and engage with premium content, which makes them more valuable to advertisers. Brands are willing to pay a premium to reach iOS audiences, particularly in developed markets, thereby driving the segment growth.
How North America Captured Largest Market Share in 2024?
The North America dominated with largest share in 2024 due to large number of smartphone users and the rising popularity of mobile streaming services. Video streaming services such as Hulu, Amazon Prime, and Netflix offer a wide range of programming, including TV shows, movies, and documentaries, and users spend a significant amount of time on these platforms. This has created a vast potential for in-app advertising, as advertisers can leverage the platform's popularity to reach a vast and engaged audience. Moreover, The gaming industry in the region is experiencing significant growth with a significant number of mobile gamers. This growth has created a vast potential for in-app advertising, as advertisers can leverage the popularity of mobile gaming to reach a vast and engaged audience. Furthermore, North America is also home to several leading technology companies and mobile application developers, who are driving innovation in the in-app advertising industry. These companies are continually developing new and innovative solutions to meet the needs of advertisers and consumers, which is expected to fuel further growth in the industry in the region.
What are the Reasons for Asia Pacific's Significant Growth?
Asia Pacific is expected to witness singnificant CAGR during the forecast period as countries in the region have a large population with high smartphone penetration rates, making them an attractive market for advertisers. Additionally, there is a significant trend towards mobile-first consumption in these countries, where consumers are using mobile devices for various activities, including shopping, entertainment, and social media. Advertisers can analyse user data and target their advertisements to the right audience by leveraging these technologies, resulting in higher engagement rates and better returns on investment, thereby driving the growth.
Competitive Insight
Some of the major players:
- ironSource,
- Google AdMob,
- BYYD,
- Flurry,
- TUNE, Inc.,
- Amobee,
- InMobi,
- Glispa,
- AppLovin,
- Chartboost,
- Smaato,
- Leadbolt
Recent Developments
- In July 2025, Truecaller Ads launched Truecaller Play, an interactive mobile ad suite featuring rich media formats. Designed for high engagement, it empowered brands to connect with users during peak attention moments through native, video-first, and immersive advertising experiences within the app.
- In May 2025: Google introduced AI Overviews, AI Marketing Assistants, and creative tools like Image-to-Video Transformation at Google Marketing Live 2025.
- In May 2025: T-Mobile Advertising Solutions combined its first-party data with the Vistar platform and launched in-store retail media offerings.
- In January 2025: Microsoft Advertising rolled out Curate for Commerce and Sponsored Promotions by Brands, helping retailers monetize first-party data on a cost-per-sale basis.
- In January 2025: Attentive crossed USD 500M ARR and expanded AI-driven RCS messaging through a partnership with Google.
- In July 2022: Tremor International completed the acquisition of the Amobee for the amount totalling around USD 239 Mn. This acquisition will help parent company to enhance their data-based offerings and to expand its services in other media platforms.
In App Advertising Market Report Scope
| Report Attributes | Details |
| Market size value in 2024 | USD 187.93 billion |
| Market size value in 2025 | USD 210.50 billion |
| Revenue forecast in 2034 | USD 598.20 billion |
| CAGR | 12.3% from 2025 – 2034 |
| Base year | 2024 |
| Historical data | 2020– 2023 |
| Forecast period | 2025– 2034 |
| Quantitative units | Revenue in USD million/billion and CAGR from 2025 to 2034 |
| Segments covered | By Type, By Application, By Platform, By Region |
| Regional scope | North America, Europe, Asia Pacific, Latin America; Middle East & Africa |
| Key companies | ironSource, Google AdMob, BYYD, Flurry, TUNE, Inc., Amobee, InMobi, Glispa, AppLovin, Chartboost, Smaato, and Leadbolt. |
FAQ's
The global in app advertising market size is expected to reach USD 598.20 billion by 2034.
Top market players in the In App Advertising Market are Google AdMob, BYYD, Flurry, TUNE, Inc., Amobee, InMobi, Glispa, AppLovin, Chartboost.
North America contribute notably towards the global In App Advertising Market.
The global in-app advertising market expected to grow at a CAGR of 12.3% during the forecast period.
The In App Advertising Market report covering key are type, platform, application, and region.
Download Sample Report of In-App Advertising Market
Please fill out the form to request a customized copy of the research report.
