
In-Building Wireless Market Share, Industry Growth, Analysis, 2024-2032
REPORT DETAILS
Market Statistics
Market Overview
Global in-building wireless market size was valued at USD 17.46 billion in 2023. The market is projected to grow from USD 19.49 billion in 2024 to USD 47.45 billion by 2032, exhibiting a CAGR of 11.8% during the forecast period.
In-building wireless is the deployment and management of wireless communication networks within indoor environments, such as offices, hospitals, shopping malls, residential complexes, and industrial facilities, to provide reliable and high-quality connectivity. These systems ensure that mobile devices, IoT devices, and other wireless-enabled technologies operate seamlessly.
The growth of the in-building wireless market is being fueled by increased investments from both the public and private sectors. Businesses are seeking to enhance operational efficiency, employee productivity, and customer satisfaction through investment in wireless network solutions.
For instance, in October 2023, Terramont Infrastructure Partners, a North American infrastructure investment firm, completed an equity investment in Newbridge Wireless, a provider of wireless infrastructure solutions. These types of investments are aimed at ensuring communication during emergencies, enhancing the learning experience with reliable connectivity, and supporting digital transformation, thereby accelerating the growth of the in-building wireless market.
Source: Polaris Market Research Analysis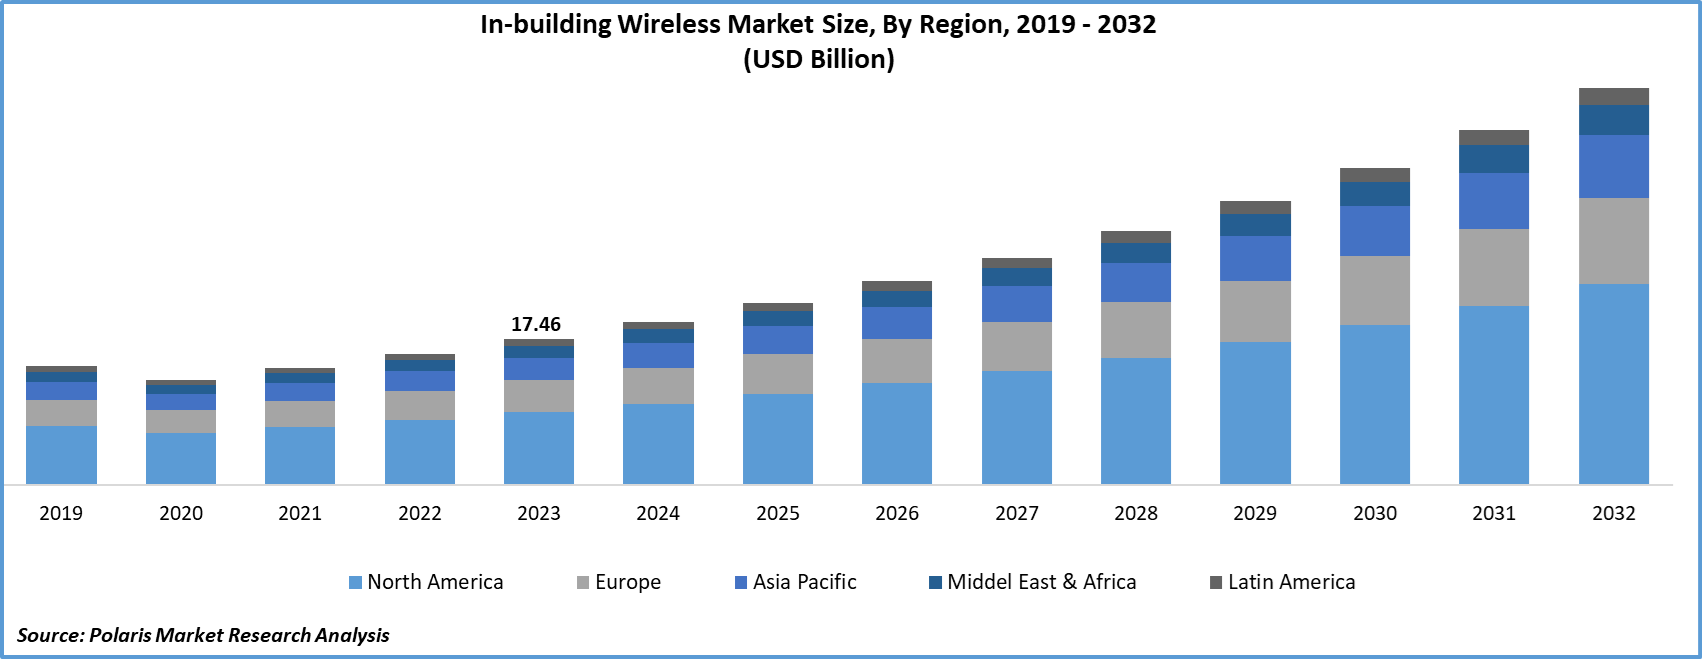
To Understand More About this Research:Download Sample Report
The expansion of the Internet of Things (IoT) is significantly driving the in-building wireless market by increasing the need for reliable indoor wireless connectivity. IoT devices are increasing across various sectors, such as smart homes, healthcare, manufacturing, and retail. These devices generate a substantial amount of data that needs to be transmitted and processed in real-time. Therefore, the surge in connected devices requires a network infrastructure. In-building wireless solutions, including distributed antenna systems (DAS) and small cells, meet these demands by providing consistent and extensive coverage within indoor spaces. Thus, the increased demand for wireless network solutions from the expansion of IoT devices is driving the growth of the in-building wireless market.
Market Drivers and Trends
Growth of IT Sector
The IT sector across the globe is expanding significantly because of the increased prevalence of advanced technologies such as cloud computing, big data analytics, and artificial intelligence. For instance, according to IBEF, India is expected to see significant growth in its IT and business services market, reaching an estimated USD 19.93 billion by 2025. Additionally, IT spending in India is expected to grow substantially by 11.1% in 2024, reaching a total of USD 138.6 billion. This growth in the IT sector is creating a need for robust and reliable in-building wireless networks. The advanced technologies of the sector require high-speed, low-latency wireless connections to function effectively. Thus, the IT sector's rapid growth and technological advancements are propelling the demand for in-building wireless infrastructure, driving its market growth.
Strategic Activities Performed by Market Players
Strategic activities such as acquisitions, partnerships, and expansions are driving the market by promoting innovation, enhancing capabilities, and expanding market reach. For instance, in April 2024, the National Investment and Infrastructure Fund Ltd (NIIF), an Indian government-backed infrastructure fund, acquired a majority stake in iBus Networks, a provider of in-building wireless solutions, for Rs 1600 crore ($200 million). These types of acquisitions allow companies to integrate advanced technologies and expertise from acquired firms, accelerating the development of comprehensive in-building wireless solutions. Thus, the companies are strengthening the market presence by leveraging strategic activities to enhance service offerings, thereby propelling the in-building wireless market growth.
Source: Polaris Market Research Analysis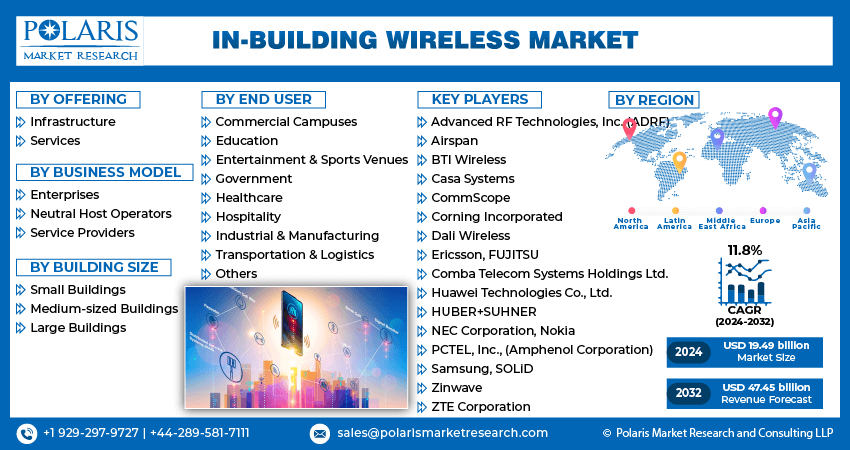
Get Full Segment-Level Forecasts & Insights: Download Sample Report
Market Segment Insights
In-Building Wireless Market Breakdown by Offering Insights
The global in-building wireless market segmentation, based on offering, includes infrastructure
and services. The infrastructure segment dominated the market due to the increasing demand for robust and reliable connectivity solutions within commercial and residential buildings. Businesses and consumers are seeking seamless mobile and wireless experiences. Thus, there has been a significant push toward upgrading and expanding in-building infrastructure, such as the deployment of advanced technologies, including Distributed Antenna Systems (DAS) and Small Cells. Consequently, the infrastructure segment dominated the global in-building wireless market in 2023.
In-Building Wireless Market Breakdown by Business Model Insights
The global in-building wireless market segmentation, based on the business model, includes enterprises, neutral host operators, and service providers. The neutral host operators’ segment is expected to register a significant CAGR in the in-building wireless market due to the evolving network model that enhances indoor cellular coverage efficiently. For instance, in the U.S., building owners are deploying their own private 3.5GHz CBRS wireless networks and connecting them to major public network operators through the Multi-Operator Core Network (MOCN) standard. This approach is allowing buildings, such as hotels and hospitals, to offer indoor coverage without the substantial costs and complexities associated with regular Distributed Antenna System (DAS) installations. Thus, the streamlined and cost-effective solution for extending wireless coverage is anticipated to drive the rapid growth of neutral host operators in the in-building wireless market over a forecast period.
In Building Wireless Market, Segmental Coverage, 2019 - 2032 (USD billion)
Source: Polaris Market Research Analysis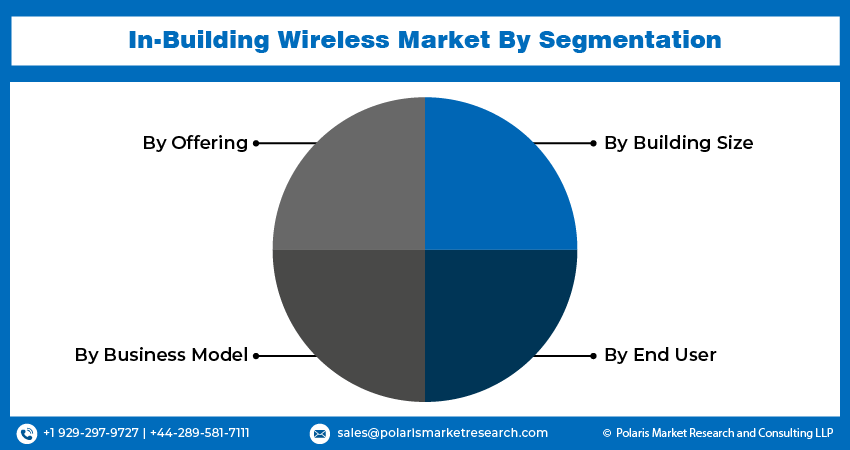
Need Granular Data Across All Market Segments? Request Customization
Source: Secondary Research, Primary Research, PMR Database, and Analyst Review
In-Building Wireless Breakdown by Regional Insights
By region, the study provides the in-building wireless market insights into North America, Europe, the Asia Pacific, Latin America, and the Middle East & Africa. The North America in-building wireless market held the highest revenue share due to the expansion of the 5G network that is accelerating the need for enhanced indoor connectivity solutions. For instance, according to the Ericsson Mobility Report, in the United States, 90% of the population, which is over 300 million people, have access to 5G low-band coverage from tier-1 service providers. Additionally, 5G mid-band covers a range of 210-300 million people, while 5G mmWave has been deployed in major metropolitan areas. This expansion in the 5G network necessitates advanced in-building solutions to ensure high-speed network connectivity and optimal performance, contributing to the dominant revenue share of North America in the global market.
The U.S. in-building wireless market is expected to grow substantially due to the increasing spending by the wireless and mobile industry of the country. For instance, according to the Wireless Infrastructure Association, in 2022, the U.S. wireless and mobile industry invested a total of USD 11.9 billion in expanding the capacity and coverage of the nation's wireless networks. Additionally, the network operating expenses for U.S. wireless and mobile networks surpassed USD 46 billion in the same year. This increased spending encompassed the deployment of cellular towers, macro cell sites, outdoor small cell nodes, and indoor small cell nodes, all aimed at improving coverage and performance within commercial and residential sectors. Thus, the focus on enhancing indoor connectivity is projected to fuel the market in the country.
In Building Wireless Market Regional Coverage, 2019 - 2032 (USD billion)
Source: Polaris Market Research Analysis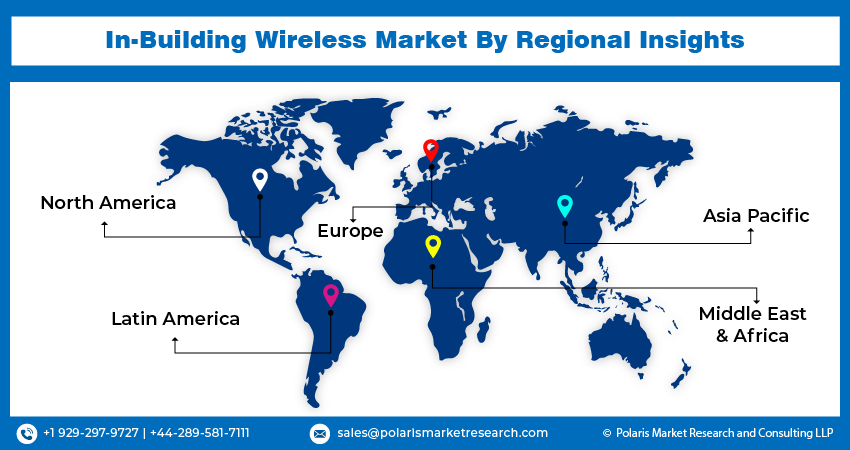
Curious About Regional Market Performance? Request Customization
Source: Secondary Research, Primary Research, PMR Database and Analyst Review
The Asia Pacific in-building wireless market is expected to grow significantly due to the increasing array of products and services offered by market players. Companies in the region are enhancing their portfolios with advanced technologies such as Distributed Antenna Systems (DAS), Small Cells, and private 5G networks to address the diverse connectivity needs of commercial and residential buildings. For instance, in October 2022, PROSE Technologies launched a 5G in-building Distributed Antenna System (DAS) in a commercial complex in Mumbai. The deployment of DAS enabled the operators to deliver enhanced indoor coverage, thereby optimizing the capabilities of 5G technology. This expansion of offerings provides higher data speeds and improved network reliability. Thus, the influx of innovative solutions to meet regional requirements is driving substantial growth in the in-building wireless market across the Asia Pacific.
Key Market – Players & Competitive Insights
Leading market players are investing heavily in research and development in order to expand their offerings, which will help the in-building wireless market, grow even more. Market participants are also undertaking a variety of strategic activities to expand their global footprint, with important market developments including innovative product launches, international collaborations, higher investments, and mergers and acquisitions between organizations. To expand and survive in a more competitive and rising market climate, the in-building wireless market must offer cost-effective solutions.
The in-building wireless market is represented presence of several key players competing for market share. Companies are engaged in continuous innovation, driven by the demand for enhanced connectivity and the integration of new technologies such as 5G and IoT. Major players in the in-building wireless market include Advanced RF Technologies, Inc. (ADRF); Airspan; BTI Wireless; Casa Systems, Comba Telecom Systems Holdings Ltd.; CommScope; Corning Incorporated; Dali Wireless; Ericsson; FUJITSU; Huawei Technologies Co., Ltd.; HUBER+SUHNER; NEC Corporation; Nokia; PCTEL, Inc., (Amphenol Corporation); Samsung; SOLiD, Zinwave; and ZTE Corporation.
Corning Incorporated develops specialty materials, optical communications, display technologies, environmental technologies, and life sciences businesses in domestic and international markets. The company operates through five business segments, including optical communications, display technologies, specialty materials, environmental technologies, and life sciences. The optical communications segment offers a range of optical cables, fibers, and equipment products designed for the telecommunications industry, as well as for governmental, commercial, and individual use. The company's display technologies segment provides glass substrates for flat-panel displays, notebook computers, tablets, desktop monitors, and handheld devices. The specialty materials segment of the company produces material formulations for glass ceramics, glass, precision metrology instruments, crystals, and software. The environmental technologies segment specializes in supplying filter products and ceramic substrates designed for emissions control in gasoline, mobile, and diesel applications. The company's life sciences division provides a range of laboratory products, such as consumables (liquid handling plastics, plastic vessels, cell culture media, specialty surfaces, and serum), glassware, general labware, and equipment.
In October 2019, Corning Incorporated announced a collaboration with Intel to accelerate the implementation of 5G within buildings. The collaboration created a virtual platform for Corning’s 5G network solutions, leveraging Intel Xeon Scalable processors and Intel FlexRAN Reference Software Architecture.
Samsung is a manufacturer of consumer electronics with an extensive product portfolio spanning multiple categories. The company's offerings encompass a wide array of advanced technologies, including smartphones, tablets, wearables, home appliances, televisions, audio devices, smart switches, sound devices, refrigerators, laundry, air solutions, cooking appliances, monitors, memory storage, and semiconductors. Samsung's Galaxy series remains at the forefront of the smartphone market, boasting innovative features and powerful performance. Samsung’s product range for home appliances includes refrigerators, washing machines, dishwashers, air conditioners, and kitchen appliances. Further, the company offers smartwatches, fitness trackers, and buds under wearables.
Samsung's Galaxy Fit lineup caters to fitness enthusiasts, providing lightweight and durable trackers with essential health monitoring features. In September 2020, Samsung Electronics introduced a new integrated 5G mmWave small cell for indoor use as part of its comprehensive suite of 5G in-building products, Samsung Link. The launched 5G indoor small cell, known as Link Cell, is designed to deliver improved 5G experiences for users in indoor environments.
List of Key Companies:
- Advanced RF Technologies, Inc. (ADRF)
- Airspan
- BTI Wireless
- Casa Systems
- Comba Telecom Systems Holdings Ltd.
- CommScope
- Corning Incorporated
- Dali Wireless
- Ericsson
- FUJITSU
- Huawei Technologies Co., Ltd.
- HUBER+SUHNER
- NEC Corporation
- Nokia
- PCTEL, Inc., (Amphenol Corporation)
- Samsung
- SOLiD
- Zinwave
- ZTE Corporation
Industry Developments
- In May 2025: Airspan launched its MobileAccess 6000 and 6200 DAS systems along with SpiderCloud small cell solutions, targeting high-density venues and business environments.
- In June 2024: Hewlett Packard Enterprise Development LP introduced HPE Aruba Networking Enterprise Private 5G, a solution designed to simplify and accelerate the deployment and management of private 5G networks. It provides reliable wireless coverage across large campus and industrial environments while enabling new use cases for private cellular connectivity.
- September 2023: Celona introduced a neutral-host private wireless platform with the ability to integrate with public network providers. The platform has already been certified to work with T-Mobile's 4G LTE network.
- May 2024: ZTE Corporation partnered with Thailand's top mobile operator AIS to introduce wireless products at the A-Z Center. ZTE's advanced technology assists AIS in constructing an environment-friendly, streamlined, and intelligent telecommunication network.
- January 2024: AFL completed the acquisition of Forza Telecom, a turnkey service and solutions provider located in Walnut Creek, CA, to add specialized indoor and outdoor Distributed Antenna Systems (DAS) capabilities to AFL's solutions portfolio.
Market Segmentation
In Building Wireless Market – Offering Outlook
- Infrastructure
- Distributed Antenna System
- Small Cells
- Services
- Integration & Deployment
- Network Design
- Training, Support, & Maintenance
In Building Wireless Market – Business Model Outlook
- Enterprises
- Neutral Host Operators
- Service Providers
In Building Wireless Market – Building Size Outlook
- Small Buildings
- Medium-sized Buildings
- Large Buildings
In Building Wireless Market – End User Outlook
-
Commercial Campuses
- Education
- Entertainment & Sports Venues
- Government
- Healthcare
- Hospitality
- Industrial & Manufacturing
- Transportation & Logistics
- Others
In Building Wireless Market – Regional Outlook
- North America
- US
- Canada
- Europe
- Germany
- France
- UK
- Italy
- Spain
- Netherlands
- Russia
- Rest of Europe
- Asia Pacific
- China
- Japan
- India
- Malaysia
- South Korea
- Indonesia
- Australia
- Rest of Asia Pacific
- Middle East & Africa
- Saudi Arabia
- UAE
- Israel
- South Africa
- Rest of Middle East & Africa
- Latin America
- Mexico
- Brazil
- Argentina
- Rest of Latin America
Report Scope
| Report Attributes | Details |
| Market Size Value in 2023 | USD 17.46 billion |
| Market Size Value in 2024 | USD 19.49 billion |
| Revenue Forecast in 2032 | USD 47.45 billion |
| CAGR | 11.8% from 2024 to 2032 |
| Base Year | 2023 |
| Historical Data | 2019 – 2022 |
| Forecast Period | 2024 – 2032 |
| Quantitative Units | Revenue in USD billion and CAGR from 2024 to 2032 |
| Report Coverage | Revenue Forecast, Market Competitive Landscape, Growth Factors, and Trends |
| Segments Covered |
|
| Regional Scope |
|
| Competitive Landscape |
|
| Report Format |
|
| Customization | Report customization as per your requirements with respect to countries, regions, and segmentation. |
Source: Polaris Market Research Analysis
in building wireless market FAQ's
The global in-building wireless market size was valued at USD 17.46 billion in 2023 and is projected to grow to USD 47.45 billion by 2032.
The global market is projected to register a CAGR of 11.8% during the forecast period, 2024-2032.
North America had the largest share in the global market.
The key players in the market Advanced RF Technologies, Inc. (ADRF); Airspan, BTI Wireless; Casa Systems; Comba Telecom Systems Holdings Ltd.; CommScope; Corning Incorporated; Dali Wireless; Ericsson; FUJITSU; Huawei Technologies Co., Ltd.; HUBER+SUHNER; NEC Corporation; Nokia; PCTEL; Inc., (Amphenol Corporation); Samsung; SOLiD; Zinwave; and ZTE Corporation.
The infrastructure segment held the highest share in the in-building wireless market in 2023.
The neutral host operator’s category had the highest CAGR in the global market.
Growth of the IT sector and expansion of IoT devices are the primary drivers. The rapid proliferation of connected devices across smart buildings, healthcare, and manufacturing is creating demand for reliable indoor wireless networks, while 5G rollout and rising public and private investments are accelerating in-building infrastructure deployment.
Download Sample Report of in building wireless market
Please fill out the form to request a customized copy of the research report.
