
Industrial Utility Communication Market Size, Report, 2026-2034
REPORT DETAILS
Market Statistics
What is the Current Market Size?
Industrial Utility Communication Market size was valued at USD 3.45 billion in 2025. The market is anticipated to grow from USD 3.64 billion in 2026 to USD 5.73 billion by 2034, exhibiting the CAGR of 5.80% during the forecast period.
Market Statistics
- 2025 Market Size: USD 3.45 billion
- 2034 Projected Market Size: USD 5.73 billion
- CAGR (2026-2034): 5.80%
- North America: Largest market in 2025
Industry Trends
Industrial utility communications refer to the various communication systems and technologies used by industrial organizations, such as power plants, water treatment facilities, transportation systems, and other critical infrastructure providers, to operate and manage their operations effectively and efficiently. Industrial utility communications play a crucial role in ensuring the reliable and safe operation of these organizations, as they enable operators to respond to changes in operating conditions quickly, detect potential problems before they become major issues, and coordinate maintenance and repair activities.
The industrial utility communication market size is a rapidly growing industry driven by the increasing demand for efficient and reliable communication systems in various industries such as oil and gas, energy, transportation, power generation, and mining. The need for real-time data transmission, remote monitoring, and control of equipment has led to the development of advanced communication technologies that can withstand harsh industrial environments.
One of the key drivers of this market is the increasing demand for efficient communication systems. With the rise of Industry 4.0 and IoT, there is a growing need for real-time data transmission. This has led to the adoption of industrial utility communication solutions across various industries.
The research report offers a quantitative and qualitative analysis of the Industrial Utility Communication Market to enable effective decision-making. It covers the key trends and growth opportunities anticipated to have a favorable impact on the market. Besides, the study covers segment and regional revenue forecasts for market assessment.
Source: Polaris Market Research Analysis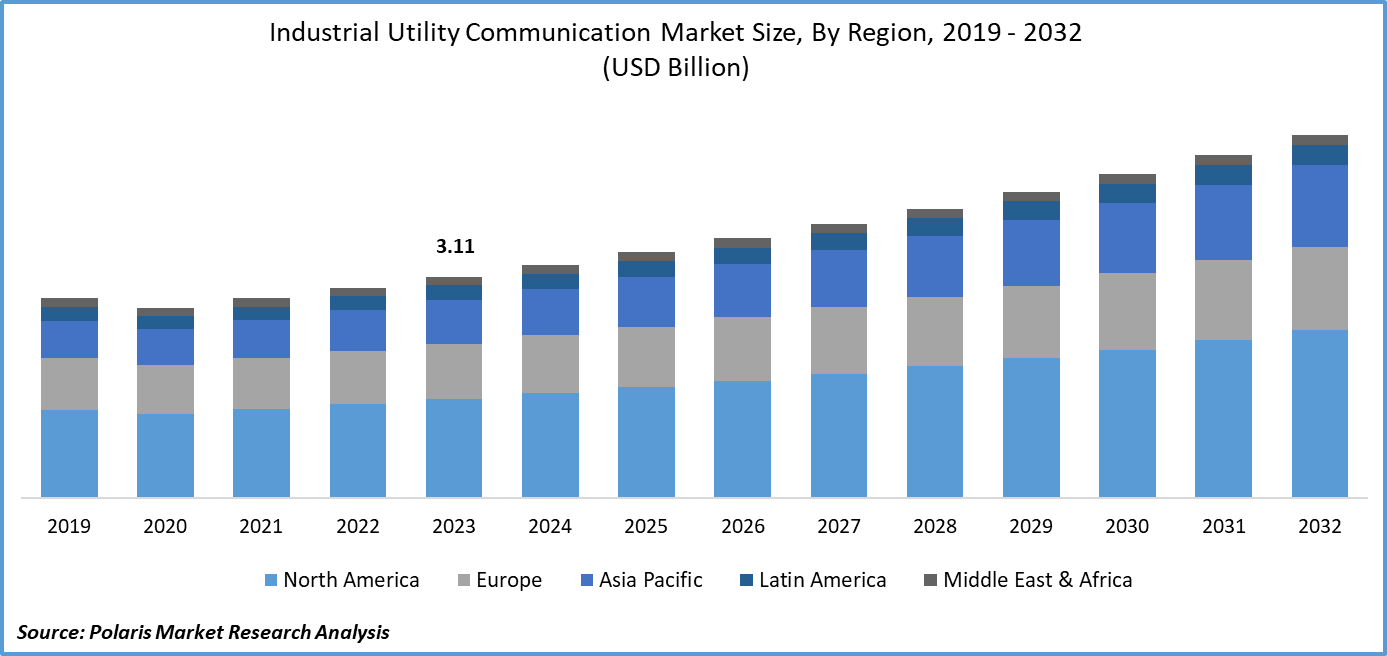
To Understand More About this Research: Download Sample Report
Moreover, stringent safety regulations in various industries are also driving the growth of this market. Many industries face stringent safety regulations, which require them to implement safe and secure communication systems. These solutions must meet these regulatory requirements, ensuring worker safety and minimizing risks associated with hazardous environments.
However, the high initial costs associated with implementing industrial utility communication solutions are significantly affecting the growth of the market. Another challenge is the concern about security. Industrial communication systems often transmit sensitive data, making them vulnerable to cyber threats. Ensuring security and protecting against potential breaches can be a major challenge, causing some companies to hesitate when adopting these solutions.
Source: Polaris Market Research Analysis
Get Full Segment-Level Forecasts & Insights: Download Sample Report
Key Takeaways
- North America dominated the market and contributed over 43% of share in 2025
- By technology category, the wireless segment accounted for the largest market share in 2025
- By component category, the hardware segment held the dominating revenue share in 2025
- By end-use industry category, power generation segment held the significant market revenue share in 2025
What are the market drivers driving the demand for industrial utility communication market?
- The increasing demand for smart grid communications drives industrial utility communication market growth
Smart grids rely on advanced communication technologies to enable real-time monitoring and control of power distribution, transmission, and consumption. Utilities are adopting smart grid systems to improve operational efficiency, reduce energy losses, and provide better customer services. These systems require secure, reliable, and high-speed communication networks that can support data exchange between various devices, such as smart meters, sensors, and substation automation systems.
Smart grid communications also enable utilities to manage distributed energy resources (DER) more effectively. DER includes renewable energy sources like solar and wind power, energy storage systems, and electric vehicles. By leveraging smart grid communications, utilities can monitor and control these decentralized assets remotely, ensuring they operate within the parameters set by the grid operator. This integration of DER into the grid helps optimize energy production and distribution, reduces greenhouse gas emissions, and enhances grid resilience. Thus, the rising demand for smart grid communications is significantly driving the global market.
Which factor is restraining the demand for industrial utility communication?
- The high initial costs associated with implementing industrial utility communication solutions hinder market growth
The high initial investment in equipment and software required to establish a dry lab photo printing business is a significant barrier to entry for potential entrepreneurs and small businesses. This includes the cost of purchasing specialized printers, software, and other necessary equipment, which can be prohibitively expensive for many individuals or small businesses with limited financial resources. Also, the cost of maintenance and upgrades for this equipment is usually high, further increasing the financial burden on business owners. As a result, the high initial investment required to start a dry lab photo printing business limits market growth by discouraging new entrants and hindering the expansion of existing businesses.
Communication Technology Stack & Adoption Metrics
| Layer / Technology | Role | 2021–2025 Adoption Trend |
| IEC 61850 over Ethernet | Substation LAN for protection and control, GOOSE/Sampled Values between IEDs. | Widely adopted baseline for digital substations; vendors updating to Edition 2/2.1 with stronger security and interoperability. |
| Fiber IP/MPLS backbone | Utility WAN interconnecting substations and control centers. | Ongoing migration from TDM to converged IP/MPLS carrying SCADA, synchrophasors and IT traffic. |
| SCADA over IP (DNP3, IEC 60870‑5‑104, OPC UA) | Supervisory control between field devices and EMS/DMS. | Serial links replaced by TCP/IP‑based SCADA integrated with IEC 61850 substation networks. |
| Private LTE / 5G | Wide‑area wireless for field crews, meters, DERs. | Private LTE widely deployed as mission‑critical utility network; staged pilots and planning for 5G upgrades. |
| Industrial Ethernet / fieldbus | PLC and device‑level networking in plants/substations. | PROFINET and similar Ethernet replace legacy fieldbus, tightly integrated into higher‑level utility communication stacks. |
Source: Polaris Market Research Analysis
Report Segmentation
The market is primarily segmented based on technology, component, end-use industry, and region.
| By Technology | By Component | By End-Use Industry | By Region |
|
|
|
|
Source: Polaris Market Research Analysis
To Understand the Scope of this Report: Request Customization
Category Wise Insights
By Technology Insights
Based on technology analysis, the market is segmented on the basis of wired and wireless. The wireless technology segment is expected to hold a dominant revenue share in the market in 2025 because of several factors, such as wireless technologies, including Wi-Fi, Bluetooth, and cellular networks, have become increasingly popular in industrial settings due to their ability to enable communication between devices without the need for physical connections. This has made them an attractive option for industries that require data transmission over long distances, such as manufacturing, oil and gas production, and transportation.
Another factor contributing to the growth of the wireless technology segment is the increasing adoption of Industrial Internet of Things (IIoT) applications. IIoT involves the use of sensors, machines, and other devices to collect and analyze data from industrial processes, and wireless technologies are essential for connecting these devices and transmitting data to central systems. As more industries adopt IoT solutions, the demand for wireless utility communication technologies is likely to increase.
By Component Insights
Based on component analysis, the market has been segmented on the basis of hardware, software, and services. In 2025, the wired connectivity segment dominated the global because of the high-speed and reliable connection that wired connectivity provides, which is essential for processing large files and data required for photo printing. The majority of professional photographers and photography studios rely on wired connections to ensure fast and efficient processing of images from their cameras or computers to their printers.
Moreover, wired connectivity offers greater stability and security compared to wireless connectivity, which is critical in professional uses where data loss or corruption can result in significant financial losses and damage to reputation. Additionally, many high-end photo printers available in the market require a wired connection to function optimally, further driving the demand for wired connectivity in the dry lab photo printing market.
By End-Use Industry Insights
Based on end-use analysis, the market has been segmented on the basis of AC transmission, EV charging, HVDC transmission, mining, oil and gas, power distribution, power generation, renewable power generation, transportation, water/wastewater, and others. The power generation segment within the end-use industry held the largest share in 2025, owing to the increasing demand for advanced communication systems in the power generation sector, particularly in the areas of smart grid technology and renewable energy integration. Power generation companies are adopting industrial IoT solutions to optimize their operations and ensure efficient energy production, transmission, and distribution. They need data acquisition and monitoring capabilities to manage their assets, reduce downtime, and improve maintenance scheduling. Industrial utility communications play a critical role in enabling these functions by providing secure, reliable, and high-speed connectivity between devices, machines, and control centers.
Further, the integration of renewable energy sources such as wind and solar power into the grid requires sophisticated communication infrastructure to manage variability and maintain grid stability. Advanced communication systems enable utilities to collect data from distributed energy resources (DERs) and adjust supply and demand in real-time. This results in robust and scalable industrial utility communications that can accommodate growing data volumes and support edge computing applications.
Source: Polaris Market Research Analysis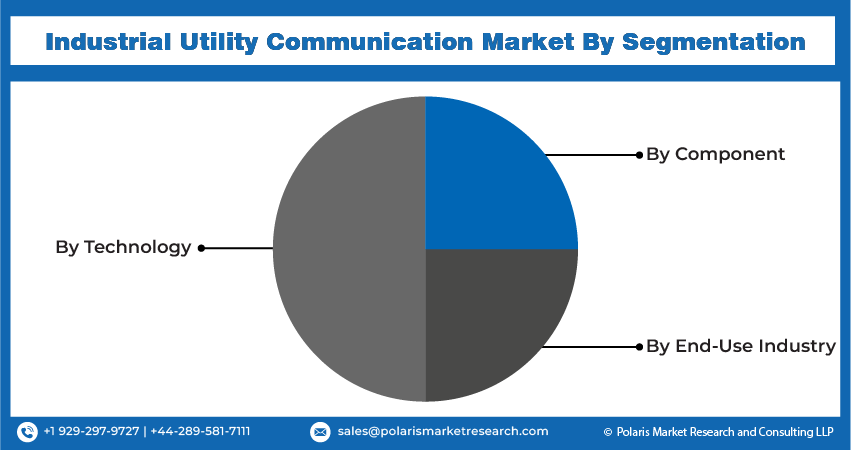
Need Granular Data Across All Market Segments? Request Customization
Regional Insights
North America
North America emerged as the dominant region in the global industrial utility communications market size in 2025 since the region's well-established infrastructure and advanced technology adoption enabled utilities to invest in modern communication systems that enhance operational efficiency and customer satisfaction. Also, the presence of prominent industry players in the region, such as General Electric, Siemens, and ABB Group, drives innovation and advancements in industrial communication technologies. These companies continuously develop and deploy cutting-edge solutions for smart grid management, intelligent transportation systems, and industrial automation, which further contributed to the dominance of North America in the global market.
Asia Pacific
The Asia Pacific region is expected to experience significant growth in the global market during the forecast period due to the increasing demand for smart grid technologies and advanced metering infrastructure in countries such as China, Japan, India, and South Korea is driving the utilization of industrial utility communication solutions. Also, the need for efficient energy management systems in industries such as power generation, mining, oil and gas, and transportation is contributing to the growth of the market in this region. Further, governments in APAC are actively promoting the use of IoT and M2M technologies, which has led to an increase in investments in smart city initiatives and intelligent transportation systems. This has created opportunities for industrial utility communication providers to offer their solutions and services to these sectors.
Source: Polaris Market Research Analysis
Curious About Regional Market Performance? Request Customization
Competitive Landscape
The key players within the market are engaged in various activities to strengthen their position and increase their market share. Major players are focusing on developing innovative products and solutions that cater to the needs of utilities, such as smart grid management, energy management systems, and industrial automation. In addition, they are investing heavily in research and development to stay ahead of the competition and meet the evolving demands of the industry. Strategic partnerships and collaborations are also being formed to expand their reach and offer comprehensive solutions to end-use industries. Also, these companies are adopting various business models, such as subscription-based services, to make their offerings more accessible to a wider range of clients.
Some of the major players operating in the global market include:
- Cisco Systems, Inc
- Emerson Electric Co.
- FUJITSU
- General Electric
- Hitachi Energy Ltd.
- Itron Inc
- Motorola Solutions, Inc
- Nokia
- Schneider Electric
- Siemens
- Telefonaktiebolaget LM Ericsson
Recent Developments
- In November 2023, the OpenADR Alliance, an organization established to promote the advancement, adoption, and adherence of OpenADR, introduced an updated OpenADR 3.0 communication standard. The new standard is intended to facilitate utilities, operators, aggregators, and end-users in managing their energy consumption and enhancing grid stability.
- In February 2023, SAC Wireless unveiled its specialized division, SAC EDG, which caters to communication network consulting and deployment services for public and industrial utilities. This new offering is expected to bolster the company's existing portfolio of end-to-end solutions for telecom infrastructure and provide tailored support to clients in the utilities sector.
- In July 2022, Forward Solutions acquired Utility Sales Associates. This sales organization specializes in offering data testing equipment, connectivity products, infrastructure products, and safety and productivity solutions to power utility and telecommunication companies in the Midwest region.
Report Coverage
The Industrial Utility Communication market report emphasizes on key regions across the globe to provide better understanding of the product to the users. Also, the report provides market insights into recent developments, trends and analyzes the technologies that are gaining traction around the globe. Furthermore, the report covers in-depth qualitative analysis pertaining to various paradigm shifts associated with the transformation of these solutions.
The report provides detailed analysis of the market while focusing on various key aspects such as competitive analysis, technology, component, end-use industry, and their futuristic growth opportunities.
Industrial Utility Communication Market Report Scope
| Report Attributes | Details |
| Market size value in 2025 | USD 3.45 billion |
| Market size value in 2026 | USD 3.64 billion |
| Revenue forecast in 2034 | USD 5.73 billion |
| CAGR | 5.80% from 2026 – 2034 |
| Base year | 2025 |
| Historical data | 2021 – 2024 |
| Forecast period | 2026 – 2034 |
| Quantitative units | Revenue in USD billion and CAGR from 2026 to 2034 |
| Segments covered | By Technology, By Component, By End-Use Industry, By Region |
| Regional scope | North America, Europe, Asia Pacific, Latin America; Middle East & Africa |
| Customization | Report customization as per your requirements with respect to countries, region and segmentation. |
Source: Polaris Market Research Analysis
Seeking a more personalized report that meets your specific business needs? At Polaris Market Research, we’ll customize the research report for you. Our custom research will comprehensively cover business data and information you need to make strategic decisions and stay ahead of the curve.
Industrial Utility Communication Market FAQ's
• The global market size was valued at USD 3.45 billion in 2025 and is projected to grow to USD 5.73 billion by 2034.
• The global market is projected to register a CAGR of 5.80% during the forecast period.
• North America led the global market in 2025.
• A few of the key players in the market are Cisco Systems, Inc.; Emerson Electric Co.; FUJITSU; General Electric; Hitachi Energy Ltd.; Itron Inc; Motorola Solutions, Inc; Nokia; Schneider Electric; Siemens; Telefonaktiebolaget LM Ericsson.
• The wireless technology segment held a dominant revenue share in the market in 2025.
• In 2025, the wired connectivity segment dominated the global market.
Download Sample Report of Industrial Utility Communication Market
Please fill out the form to request a customized copy of the research report.
