
Lavatory Service Vehicles Market Trends Analysis Report 2026-2034
REPORT DETAILS
Market Statistics
What is lavatory Service Vehicles Market Size?
The global lavatory service vehicles market was valued at USD 85.68 billion in 2025 and is expected to grow at a CAGR of 5.6% during the forecast period. The growth is driven by rising demand for air travel, and rise in the investment.
Market Statistics
- 2025 Market Size: USD 85.68 Billion
- 2034 Projected Market Size: USD 139.79 Billion
- CAGR (2025-2034):5.6%
- Largest Market: North America
The Lavatory Service Vehicles, a heavily used part of the aviation industry, are witnessing dynamic growth fueled by several driving factors, such as the surge in air travel demand globally. Airlines face a significant need for quick and efficient response times for their vehicles as the number of passengers continues to rise. Consequently, the demand for lavatory service vehicles, which play an important role in maintaining aircraft hygiene, has experienced a rise in demand.
Emerging markets and increased connectivity are driving airlines to expand their operations, demanding a reliable fleet of lavatory service vehicles to ensure the flawless functioning of their aircraft. The stringent hygiene and safety regulations imposed by aviation authorities further elevate the importance of these vehicles. Compliance with these regulations orders airlines to invest in effective lavatory service solutions to meet the prescribed standards for cleanliness and waste disposal. In addition to regulatory pressures, technological advancements play a crucial role in propelling the market forward. Ongoing innovations in waste disposal systems, vehicle automation, and the integration of smart technologies are enhancing the efficiency and effectiveness of lavatory service vehicles.
Source: Polaris Market Research Analysis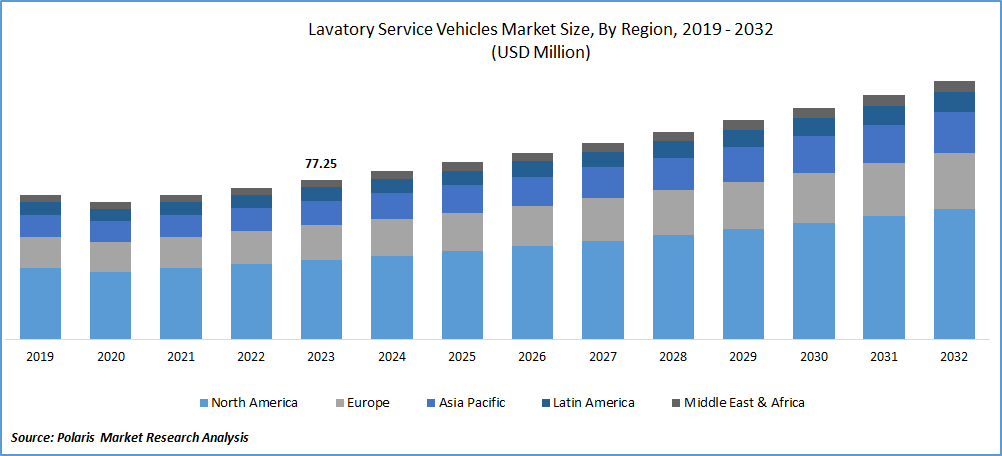
To Understand More About this Research: Download Sample Report
High initial costs associated with the acquisition and maintenance of these vehicles pose a considerable challenge. For airlines and service providers, the investment in these types of vehicles may act as an obstacle, slowing down the adoption of these essential vehicles. The shift to more advanced lavatory service vehicles may require additional personnel training and could disrupt existing workflows within airports and airlines. Economic downturns or crises within the aviation industry can also impact market dynamics, with airlines potentially delaying or scaling back investments in new equipment, including lavatory service vehicles.
Growth Drivers
- Rising demand for air travel around the globe boosts the market growth.
The escalating demand for air travel on a global scale stands as a driving factor for market growth. This surge in demand is associated with the rise in the number of air passengers, driven by factors such as increasing disposable income, greater affordability of air travel, and increased connectivity between regions. As more individuals choose air transportation for both business and tour purposes, airlines are directed to maintain efficient and timely operations. In this context, lavatory service vehicles play an important role in ensuring the cleanliness and functionality of aircraft lavatories during the crucial turnaround periods between flights. The growing demand for air travel not only creates a need for expanded fleets and more frequent flights but also emphasizes the essential role of lavatory service vehicles in supporting the rapid and effective servicing of aircraft, thereby contributing significantly to the overall efficiency and seamless functioning of the aviation industry.
Electrification & Decarbonization Trends in Lavatory Service Vehicles
Trend | Description for lavatory service vehicles | Evidence |
| Inclusion of lavatory trucks in airport GSE electrification programs | Electric lavatory trucks are explicitly listed among the six most common GSE types already electrified at airports, alongside pushbacks, belt loaders, container loaders, luggage tugs and water trucks. | The European Alternative Fuels Observatory notes that “electric lavatory trucks” are part of electric ground support equipment fleets and identifies lavatory trucks and water trucks as among the GSE categories already electrified at airports. |
| Early deployment of zero‑emission lavatory vehicles at major hubs | Large airport systems have begun deploying a limited number of zero‑emission lavatory vehicles while acknowledging that most of the current fleet is still conventional, indicating an early transition stage. | The Port Authority of New York and New Jersey’s 2024 Zero‑Emission Airside Vehicles report states that among approximately 97 lavatory vehicles at JFK, LaGuardia and Newark, five are zero‑emission, and notes emerging small‑ to medium‑capacity zero‑emission potable and lavatory service equipment. |
| Airport‑wide decarbonization strategies covering GSE (including lavatory service) | Airport decarbonization roadmaps treat GSE as a key lever, promoting electrification of airside vehicles and integration with renewable electricity to reduce ground‑handling emissions, which implicitly covers lavatory, water and other service trucks. | ACI Europe guidance on airports’ contribution to net‑zero aviation highlights electrification of ground vehicles and fixed electrical ground power as central measures to cut ground‑handling emissions. EASA notes that many airports invest in onsite renewable energy “to electrify ground support equipment, thereby mitigating noise and emissions.” Studies of airport‑related emissions identify GSE as a significant contributor to local air pollutants and CO₂. |
| Shift from diesel to battery‑electric GSE platforms suitable for lavatory duty cycles | Technical guidance on electric GSE indicates that duty cycles involving frequent idling, stop‑and‑go operation and heavy fluid loads (potable water and lavatory waste) are well‑suited to battery‑electric drivetrains, supporting electrification of lavatory service vehicles. | Descriptions of electric ground vehicles explain that the same characteristics that make EVs suitable for potable water trucks also make them suitable for lavatory service vehicles. Overviews of electric GSE describe lavatory trucks as part of the family of vehicles being transitioned from combustion engines to electric power. |
| Integration with airport charging and energy infrastructure | Deployment of electric lavatory trucks depends on dedicated charging infrastructure on the apron and integration with airport energy systems (e.g., fixed electrical ground power and onsite renewables) to maximize decarbonization benefits. | The Alternative Fuels Observatory highlights challenges in rolling out recharging infrastructure for electric ground‑handling vehicles at airports, including routing and power capacity. ACI Europe and EASA discuss airport investments in infrastructure such as fixed electrical ground power and onsite renewable energy specifically to support electrified ground support equipment. |
| Use of electric carts and tow‑behind zero‑emission lavatory equipment | In addition to fully self‑propelled trucks, airports are adopting smaller tow‑behind lavatory and potable‑water carts that meet zero‑emission requirements when paired with electric tugs | The Port Authority report notes that potable and lavatory service equipment is being adapted to zero‑emission operation, with a number of smaller tow‑behind carts meeting zero‑emission requirements. The Alternative Fuels Observatory describes electric cargo tugs and other tow vehicles as part of electric GSE fleets that can pull service carts, including lavatory units. |
| Policy and guidance support for zero‑emission airside vehicles | Airport and aviation guidance documents increasingly reference “zero‑emission airside vehicles” and “green GSE”, creating a policy environment that encourages procurement of electric lavatory and other service vehicles as part of net‑zero strategies. | The Port Authority’s Technology Workgroup report is framed around “Zero‑Emission Airside Vehicles” and inventories airside fleets, including lavatory vehicles, against zero‑emission targets. ACI Europe’s net‑zero guidance and EASA’s airport environment pages both emphasize electrification of GSE as a replicable environmental measure across European airports. |
| Demonstrated emissions and fuel‑savings benefits from electric utility vehicles in airport operations | Case studies of electric utility trucks in airport maintenance and support roles show substantial reductions in petroleum use and CO₂ emissions, illustrating the decarbonization potential when similar electric platforms are used for lavatory service. | An e‑ride Industries case study on airport maintenance operations reports more than 2,000 gallons of petroleum saved and over 8,500 lbs of CO₂ emissions reduced over multi‑year operation of electric utility trucks at an airport, demonstrating the emissions‑reduction potential of replacing conventional airport service vehicles with EVs. |
Source: Polaris Market Research Analysis
Source: Polaris Market Research Analysis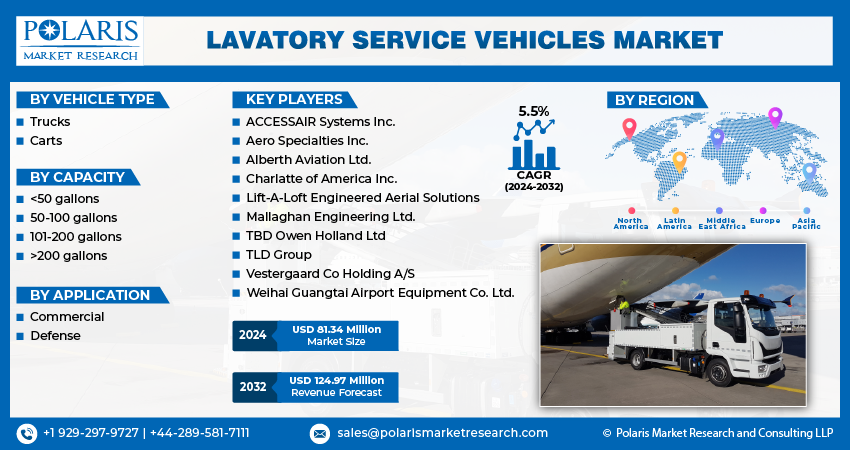
Get Full Segment-Level Forecasts & Insights: Download Sample Report
Report Segmentation
The market is primarily segmented based on vehicle type, capacity, application, and region.
| By Vehicle Type | By Capacity | By Application | By Region |
|
|
|
|
Source: Polaris Market Research Analysis
To Understand the Scope of this Report: Request Customization
By Vehicle Type Analysis
- The truck segment held the largest market share in 2025
The dominance of the truck segment in the market is because of several factors. Trucks offer a versatile and mobile solution capable of servicing aircraft across various locations within an airport. This flexibility is particularly crucial in scenarios where aircraft parking arrangements vary or when servicing is required at remote stands. The truck-based lavatory service vehicles can cater to these concerns with relative ease, providing a comprehensive and adaptable solution for aviation operators.
Along with this, the scalability of truck-based systems allows for different capacities, accommodating the varied needs of airlines and airports. The ability to carry and manage larger volumes of lavatory waste, water, and cleaning supplies positions trucks as ideal choices for high-traffic airports. The ease of maintenance, relatively lower upfront costs, and widespread familiarity with truck-based systems in airport operations make them a preferred choice for many aviation stakeholders. Owing to these factors, the truck segment held the highest market share in 2023.
By Application Analysis
- The commercial segment is estimated to dominate the market over the forecasted period.
The dominance of the commercial segment in the market is due to several key factors. The commercial aviation sector, which includes airlines and airports, is witnessing sustained growth globally. As air travel continues to rise, there is an increasing demand for efficient ground support services, including lavatory services for aircraft. Commercial airlines and airports heavily depend on lavatory service vehicles to maintain hygiene and operational preparedness of aircraft between flights. These specialized vehicles play an important role in emptying and servicing the lavatories of parked or landed aircraft, ensuring a quick turnaround time for departing flights. Also, stringent regulations and standards imposed by aviation authorities regarding sanitation and hygiene further drive the adoption of lavatory service vehicles in the commercial aviation sector. The emphasis on passenger safety and comfort confirms the need for reliable and efficient lavatory servicing, making these vehicles essential for airlines and airports.
Source: Polaris Market Research Analysis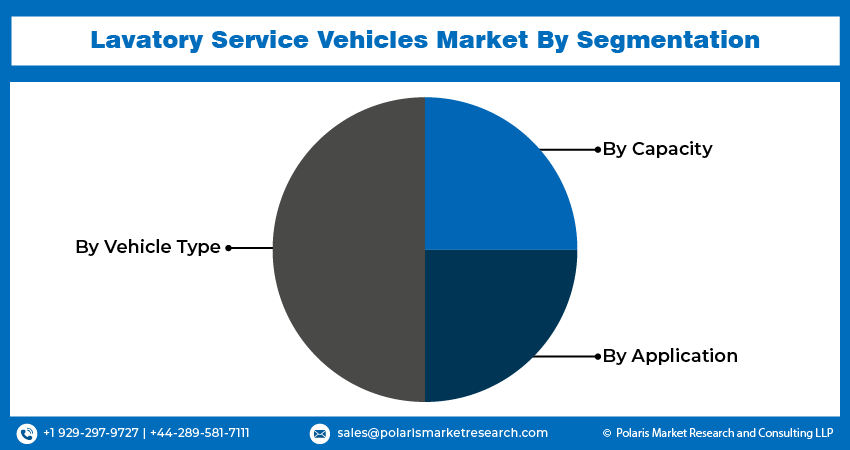
Need Granular Data Across All Market Segments? Request Customization
Regional Insights
- North America region is projected to hold a substantial market share in 2025.
North America region held a substantial market share in the global lavatory service vehicles market in 2025 because the region boasts a mature and robust aviation industry, presented by a high volume of air traffic, a crowded network of airports, and a significant number of commercial airlines. The region's well-established aviation infrastructure, including major airports and hubs, demands advanced ground support equipment, including lavatory service vehicles, to cater to the growing demands of air travel. Also, the strict regulatory framework in North America regarding aviation safety and hygiene standards further propels the adoption of specialized vehicles like LSVs.
The Asia Pacific region is expected to witness substantial growth in the market due to several factors, such as the increasing demand for aircraft maintenance and repair services in countries such as China, India, Japan, South Korea, and Singapore. As air travel becomes more accessible and affordable, there has been a surge in passenger traffic, which has led to an increased need for efficient and effective aircraft maintenance services.
Another factor contributing to the growth of the market in the Asia Pacific region is the expansion of major airlines and airports. With the rise of low-cost carriers and the increase in flight frequencies, airports are under pressure to provide faster turnaround times and improved facilities. This creates a need for specialized vehicles that can quickly and efficiently service aircraft lavatories, ensuring that they meet strict safety and hygiene standards.
Source: Polaris Market Research Analysis
Curious About Regional Market Performance? Request Customization
Key Market Players & Competitive Insights
Manufacturers in the global market are actively engaged in several activities to cater to the evolving needs of the aviation industry. Companies design, develop, and produce advanced Lavatory Service Vehicles that comply with international standards and regulations governing aviation hygiene and safety. Manufacturers focus on incorporating innovative technologies to enhance the efficiency and performance of their vehicles, such as advanced vacuum systems, waste disposal mechanisms, and environmentally friendly features. Customization is another important aspect of their activities, as they work closely with airlines and airports to tailor LSVs to specific requirements and fleet types.
Some of the major players operating in the global market include:
- ACCESSAIR Systems Inc.
- Aero Specialties Inc.
- Alberth Aviation Ltd.
- Charlatte of America Inc.
- Lift-A-Loft Engineered Aerial Solutions
- Mallaghan Engineering Ltd.
- TBD Owen Holland Ltd
- TLD Group
- Vestergaard Co Holding A/S
- Weihai Guangtai Airport Equipment Co. Ltd.
Recent Developments
- In July 2023, the United States Department of Transportation (DOT) announced a new rule on the occasion of the 33rd anniversary of the Americans with Disabilities Act (ADA) that requires airline lavatories to be more accessible to people with disabilities.
Lavatory Service Vehicles Market Report Scope
| Report Attributes | Details |
| Market size in 2025 | USD 85.68 billion |
| Market size in 2026 | USD 90.30 billion |
| Revenue Forecast in 2034 | USD 139.79 billion |
| CAGR | 5.6% from 2026 – 2034 |
| Base year | 2025 |
| Historical data | 2021 – 2024 |
| Forecast period | 2026 – 2034 |
| Quantitative units | Revenue in USD billion and CAGR from 2026 to 2034 |
| Segments Covered | By Vehicle Type, By Capacity, By Application, By Region |
| Regional scope | North America, Europe, Asia Pacific, Latin America, Middle East & Africa |
| Customization | Report customization as per your requirements concerning countries, regions, and segmentation. |
Source: Polaris Market Research Analysis
Lavatory Service Vehicles Market FAQ's
Lavatory Service Vehicles Market report covering key segments are vehicle type, capacity, application, and region
Lavatory Service Vehicles Market Size Worth USD 139.79 billion By 2034
The global lavatory service vehicles market and is expected to grow at a CAGR of 5.6% during the forecast period.
North America is leading the global market.
The key driving factors in Lavatory Service Vehicles Market is stringent hygiene and safety regulations imposed by aviation authorities further elevate the demand for these vehicles
Download Sample Report of Lavatory Service Vehicles Market Trends Analysis Report 2026-2034
Please fill out the form to request a customized copy of the research report.
