
Light Sensor Market Share, Size & Industry Analysis, 2024-2032
REPORT DETAILS
Market Statistics
The global light sensor market was valued at USD 3.50 billion in 2023 and is expected to grow at a CAGR of 10.5% during the forecast period.
Key factors responsible for the growth include, rising prevalence of consumer electronics, the trend towards sensor miniaturization, and the increasing emphasis on incorporating renewable energy solutions. Furthermore, advancements in areas such as outdoor lighting, smart homes, and the automotive industry are anticipated to contribute to the market's expansion. Recent progress in sensor technologies has been driven by the availability of low-cost and high-speed electronic circuits, as well as innovative signal-processing methods. These advancements have not only enhanced the reliability and quality of technical products but also improved their economic efficiency, offering promising solutions in the field.
Source: Polaris Market Research Analysis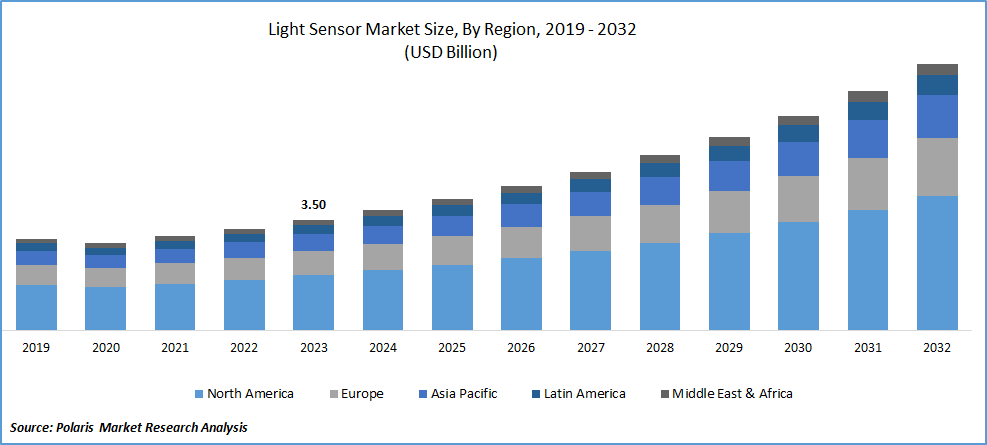
To Understand More About this Research:Download Sample Report
The rising demand for smart electronics, including LED televisions, smartphones, and smart lighting systems, on a global scale can be attributed to developments in sensor technologies and their miniaturization. These devices rely on a range of sensor technologies and communication interfaces for their functionality. The advent of connected devices and the widespread adoption of 5G communication technologies are expected to drive the utilization of diverse sensors across various industries. Furthermore, optical sensors play a significant role in wearable electronic devices in both commercial and domestic applications.
Sensor systems are widely applied across various sectors, providing benefits such as enhanced comfort, security, and automation. The market has experienced intensified competition due to ongoing improvements in the quality and reliability of lighting detection products. However, the increasing expenses associated with sensor design and manufacturing innovation present a hurdle for the market. Moreover, the global economy's disruption and supply chain challenges resulting from the COVID-19 pandemic have created short-term uncertainties in the market. Addressing these challenges requires innovative approaches and solutions to meet the future demand for light-sensing applications across diverse industries.
Growth Drivers
-
Integration of light sensors in emerging technological innovations and smart city applications
The integration of light sensors in emerging technological revolutions and smart city applications has become widespread, often complemented by the capabilities of machine learning and artificial intelligence. The market is poised for growth across several industry verticals, driven by the expansion of industrial automation, a surge in the Internet of Things (IoT) and connected devices, and developments in the telecommunications sector. Photonics applications are already making significant contributions to smart city infrastructure, encompassing smart lighting, sensing, and communication technologies. Additionally, there is a growing demand for emerging technologies like nanoscale photonics in smart city infrastructure, further boosting the growth of the light sensors market.
Source: Polaris Market Research Analysis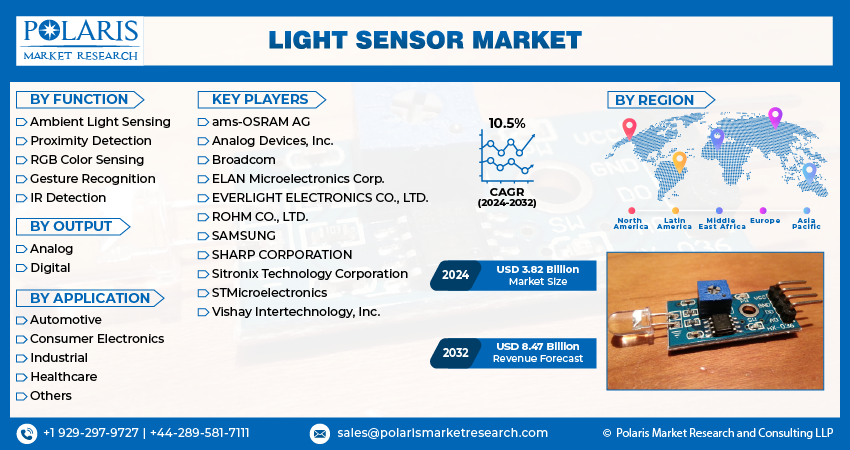
Get Full Segment-Level Forecasts & Insights: Download Sample Report
Report Segmentation
The market is primarily segmented based on function, output, application, and region.
| By Function | By Output | By Application | By Region |
|
|
|
|
Source: Polaris Market Research Analysis
To Understand the Scope of this Report:Request Customization
By Function Analysis
-
Ambient light sensing segment held the largest share in 2023
Ambient light sensing segment held the largest share. Light sensors play a crucial role in addressing diverse design requirements in consumer electronics. Furthermore, the adoption of ambient light sensing technology is on the rise, particularly in smart electronics. This technology is essential, as light detectors assist in regulating the brightness of LCD and LED screens based on the surrounding ambient light. This not only conserves energy but also provides users with an optimal level of screen brightness.
Proximity detection segment projected to grow at the fastest rate. This growth is primarily driven by its extensive application in automotive and industrial manufacturing. Proximity detectors detect changes in infrared light to perceive motion or proximity to surrounding objects. Their common use includes alerting drivers about the proximity of other objects, and they are also extensively employed in outdoor lights to detect movements for security applications.
By Output Analysis
-
Digital segment registered the largest market share in 2023
Digital segment accounted for the largest share in 2023. In applications like air conditioning, heating, ventilation, lighting controls, or temperature control systems, adjustments in control parameters are required based on ambient light intensity. Digital light detectors play a crucial role in such scenarios. With the growing prevalence of screen-based devices including cell phones, laptops, and televisions, the digital light sensor segment is expected to experience substantial growth in the upcoming years.
Analog segment expected to grow at the fastest rate. Analog light sensors are widely employed across various sectors, including industrial automation, consumer electronics, automotive, healthcare, and smart home systems. These sensors play a crucial role in functions like proximity detection, backlight control, ambient light sensing, and gesture recognition. The adaptability of analog light sensors is essential for achieving precise light measurement and control in various surroundings.
By Application Analysis
-
Consumer electronics segment held the significant market revenue share in 2023
Consumer electronics segment held the largest share. Light-sensing devices are experiencing increased demand in applications such as smartphones, LCD/LED televisions, and laptops. These sensors autonomously adjust screen brightness based on environmental light conditions, leading to energy savings. Contemporary IoT lighting platforms are emphasizing the control of lighting through diverse digital sensing elements, including illuminance detectors.
Healthcare segment projected to grow at the fastest pace. Light sensors play a crucial role in medical applications, detecting pathogens, monitoring patient oxygen levels through pulse oximeters, and aiding in blood diagnosis. The medical equipment industry is witnessing a growing demand for integrated optoelectronic sensors, contributing to the anticipated growth of the light sensor market in the healthcare sector over the forecast period.
Source: Polaris Market Research Analysis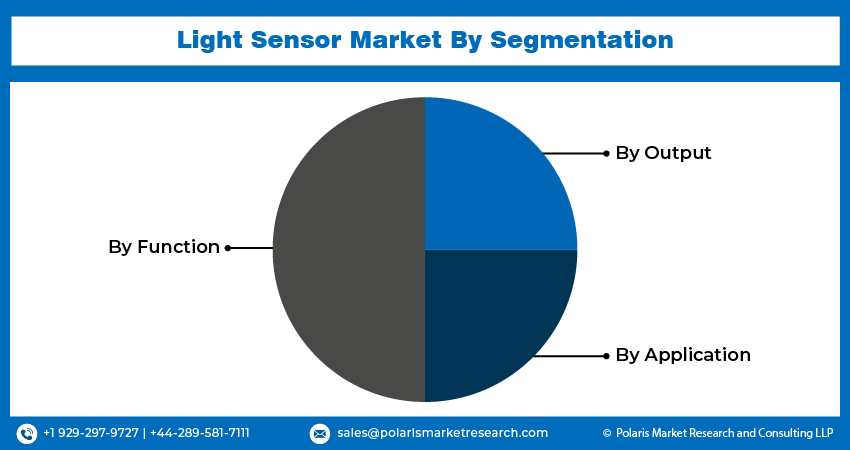
Need Granular Data Across All Market Segments? Request Customization
Regional Insights
-
APAC region held the largest share of the global market in 2023
APAC region dominated the market. This regional dominance is attributed to the expanding population and a surging demand for smartphones and consumer electronics. Furthermore, the proliferation of handheld devices equipped with built-in light sensors is anticipated to be a key driver of market growth. In developing countries, strict government regulations focusing on consumer safety have prompted automobile manufacturers to integrate more detectors in mid-segment vehicles. These factors collectively contribute to the anticipated surge in light sensors demand in the region throughout the forecasted years.
North America projected to grow at the rapid pace. The region boasts numerous key players, including Analog Devices, Broadcom, & Maxim Integrated Products, actively engaged in innovating and advancing sensor technologies. Although the United States remains a global leader in sensor design and research and development (R&D), substantial manufacturing activities are concentrated in the Asian nations. This dynamic is expected to persist in the coming decade. Nevertheless, the U.S. industry is adjusting its strategies to navigate global geopolitical uncertainties, particularly those related to trade policies, ensuring continued competitiveness.
Source: Polaris Market Research Analysis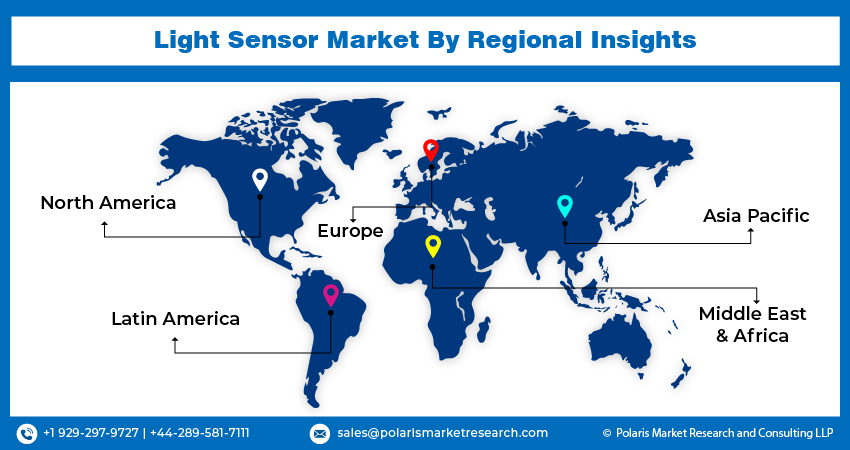
Curious About Regional Market Performance? Request Customization
Key Market Players & Competitive Insights
To enhance their global presence, market participants are implementing strategies like product launches, acquisitions, and collaborations. For instance, Sharp Fukuyama a subsidiary of Sharp, which unveiled the GP2AP130S00F proximity sensor, in July 2021. This sensor, renowned as the smallest in its class, is tailor-made for wearable devices and supports the I2C communication protocol. Its ultra-compact size and low power consumption make it seamlessly integrable into a variety of wearable gadgets.
Some of the major players operating in the global market include:
- ams-OSRAM AG
- Analog Devices, Inc.
- Broadcom
- ELAN Microelectronics Corp.
- EVERLIGHT ELECTRONICS CO., LTD.
- ROHM CO., LTD.
- SAMSUNG
- SHARP CORPORATION
- Sitronix Technology Corporation
- STMicroelectronics
- Vishay Intertechnology, Inc.
Recent Developments
- July 2025: STMicroelectronics announced an agreement to acquire part of NXP Semiconductors’ sensor business for up to US$ 950 million, considerably expanding its MEMS and light-sensor capabilities for automotive and industrial uses.
- June 2025: Sony Semiconductor Solutions unveiled the IMX479 stacked SPAD depth sensor for automotive LiDAR, offering 520 dToF pixels and 300-meter range for ADAS and autonomous driving, with sampling from Autumn 2025.
- February 2025: ams OSRAM reported strong Q4 2024 results, driven by automotive semiconductor growth, and forecast over EUR 100 million free cash flow in 2025 while pursuing efficiency programs.
- January 2025: ams-OSRAM revealed its EVIYOS™ HD 25 adaptive headlamp technology and new capacitive sensing solutions at CES 2025, strengthening progress in automotive lighting, touchless access, and smart vehicle safety systems.
- May 2023: In a collaborative effort, DANLERS, CALUMINO, and INGY have joined hands to develop an innovative intelligent lighting control sensor. The groundbreaking product, known as DANLER's CAL-CEFL12V, integrates CALUMINO's advanced thermal sensor technology along with embedded artificial intelligence (AI) and computer vision capabilities.
- November 2022: ams-OSRAM AG has unveiled the AS7331, a 3 channel UV-A/B/C Sensor designed to measure radiations across UV-C, UV-B, & UV-A wave-lengths. This sensor finds applications in various devices such as coffee brewing machines, robotic floor cleaners, and air purifiers.
Light Sensor Market Report Scope
| Report Attributes | Details |
| Market size value in 2024 | USD 3.82 billion |
| Revenue forecast in 2032 | USD 8.47 billion |
| CAGR | 10.5% from 2024 – 2032 |
| Base year | 2023 |
| Historical data | 2019 – 2022 |
| Forecast period | 2024 – 2032 |
| Quantitative units | Revenue in USD billion and CAGR from 2024 to 2032 |
| Segments covered | By Function, By Output, By Application, By Region |
| Regional scope | North America, Europe, Asia Pacific, Latin America, Middle East & Africa |
| Customization | Report customization as per your requirements with respect to countries, region, and segmentation. |
Source: Polaris Market Research Analysis
Light Sensor Market FAQ's
Light Sensors Market report covering key segments are function, output, application, and region
Light Sensors Market Size Worth $ 8.47 Billion By 2032
The global light sensor market is expected to grow at a CAGR of 10.5% during the forecast period.
Asia Pacific is leading the global market.
The key driving factors in Light Sensors Market are Integration of light sensors in emerging technological innovations and smart city applications
Download Sample Report of Light Sensor Market
Please fill out the form to request a customized copy of the research report.
