
Liquefied Natural Gas Market Research Report, Share and Forecast, 2025 – 2034
REPORT DETAILS
Market Statistics
Market Overview
The global liquefied natural gas market size was valued at USD 122.55 billion in 2024, exhibiting a CAGR of 11.5% during 2025–2034. The market is fueled by improving global demand for clean energy, rising industrialization and urbanization, the transition to coal-to-pollution-reducing fuels, and continuous innovations in LNG production and delivery that make it more efficient, cost-reducing, and accessible.
Key Insights
- In 2024, the power generation segment dominated the liquefied natural gas industry through increased demand for cleaner and more efficient energy options globally.
- Asia Pacific led the market in 2024, driven by rising energy demand and increasing investments in clean energy resources.
- The market in the Middle East & Africa is anticipated to grow at the fastest rate during the forecast period, driven by large natural gas reserves and rising investments in export infrastructure to meet global demand.
Industry Dynamics
- The increased use of electric power from renewable sources is driving the market expansion.
- Accelerating urbanization is driving global market growth, as the rise in energy consumption and demand for cleaner fuels makes LNG a key component in sustainable city development.
- Technological advancements in LNG production and distribution technologies will drive growth in the global liquefied natural gas (LNG) market.
- The high cost of infrastructure, complex transportation logistics, and exposure to international price fluctuations constrain the market.
Market Statistics
2024 Market Size: USD 122.55 billion
Source: Polaris Market Research Analysis
2034 Projected Market Size: USD 363.15 billionSource: Polaris Market Research Analysis
CAGR (2025-2034): 11.5%Source: Polaris Market Research Analysis
North America: Largest Market ShareSource: Polaris Market Research Analysis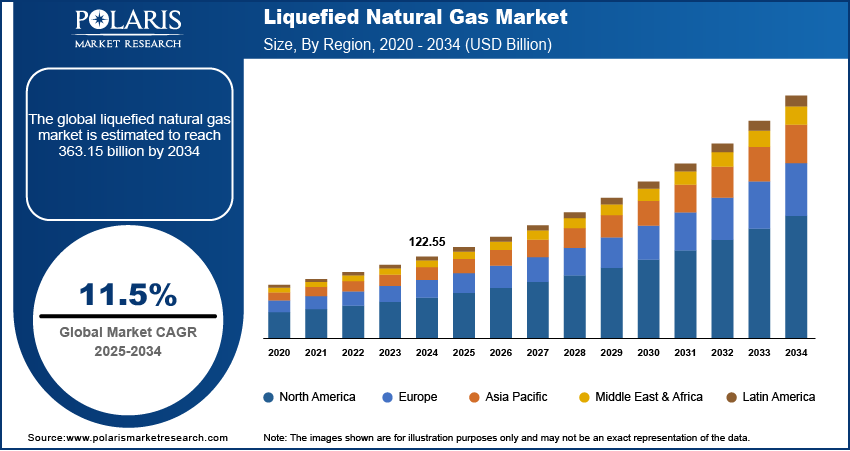
To Understand More About this Research: Download Sample Report
Liquefied Natural Gas (LNG) is natural gas that is cooled to a liquid state, approximately −260°F (−162°C), to facilitate its storage and transportation. This cooling process reduces the gas's volume to about 1/600th of its original gaseous form, making it much more efficient to ship over long distances, especially when pipelines are not available.
The increasing demand for electric power through clean energy sources is propelling the global Liquefied Natural Gas market growth. Countries worldwide are adopting LNG to meet the clean energy demand due to its lower carbon footprint compared to coal and oil and its ability to offer power plants to ramp up energy production quickly when renewable energy generation is low. Furthermore, as countries shift from coal-based power to cleaner alternatives, LNG becomes an attractive option to reduce emissions while maintaining energy security.
The growing industrialization across the world drives the liquified natural gas (LNG) market demand. According to data published by the United Nations Industrial Development Organization in December 2023, 2.3% growth was recorded globally in industrial sectors, encompassing manufacturing, electricity, mining, waste management, water supply, and other utilities. Industries such as manufacturing, chemical production, and power generation require huge amounts of energy to operate. LNG, with its lower carbon footprint compared to coal and oil, aligns with environmental regulations and sustainability goals, making it a preferred choice for industries aiming to reduce emissions. Moreover, LNG's ability to provide consistent energy supply, even in regions lacking natural gas infrastructure, supports industrial expansion in remote and developing areas, further driving its demand as industrialization continues to grow globally.
LNG Market Driver Analysis
Growing Urbanization Worldwide
The growing urbanization worldwide is projected to propel the global liquified natural gas market expansion. As per the data published by the World Bank, 4.4 billion people around the globe live in urban areas, and this is expected to double by 2050. Urban areas face high demand for electricity and ductless heating and cooling systems, which propels the use of LNG. Additionally, as cities grow, there is a greater push for cleaner energy sources to combat air pollution and meet environmental standards, positioning LNG as a crucial alternative to coal and oil. Its adaptability in various applications, such as fueling power plants, public transportation, and industrial facilities within urban areas, makes LNG critical for supporting urban growth while maintaining environmental sustainability.
Innovations in LNG Production and Distribution Technologies
The rising innovations in LNG production and distribution technologies are estimated to fuel the global liquified natural gas (LNG) market revenue. Advances in liquefaction processes have reduced production costs and increased efficiency, making LNG a more competitive energy source. Innovations in LNG storage tanks and transportation, such as larger, more efficient LNG carriers and small-scale LNG solutions, enable the supply of LNG to remote and off-grid areas. These technological improvements enhance the reliability and scalability of LNG infrastructure, encouraging its adoption across diverse sectors such as power generation, industrial use, and transportation. Therefore, as these advancements continue to lower costs and expand accessibility, they drive greater global demand for LNG as a cleaner and versatile energy alternative.
Source: Polaris Market Research Analysis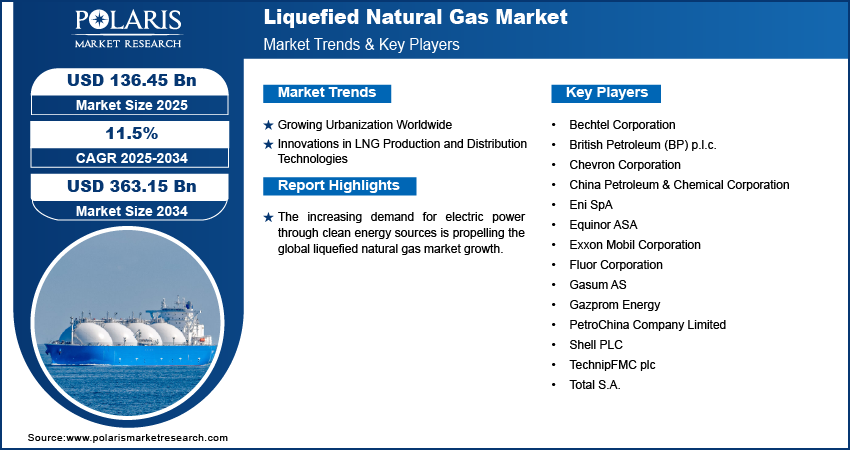
Get Full Segment-Level Forecasts & Insights: Download Sample Report
Segment Analysis
Market Evaluation by Application
In terms of application, the LNG market is divided into transportation fuel, power generation, and others. The power generation segment held the largest Liquefied Natural Gas market share in 2024 due to the rising global demand for cleaner and more efficient energy sources. The growing shift from coal and oil-fired power plants to natural gas-powered facilities has significantly contributed to this dominance. LNG offers lower carbon emissions and higher efficiency compared to traditional fossil fuels, aligning with global initiatives to reduce greenhouse gas emissions. Many countries have prioritized Liquefied Natural Gas as a transitional energy source in their path toward renewable energy adoption, further strengthening the segment's growth. Additionally, advancements in gas turbines and combined-cycle technologies have made power plants more efficient and cost-effective, supporting the preference for Liquefied Natural Gas in electricity or power generation.
The transportation fuel segment is expected to grow at a rapid pace during the forecast period owing to the economic and environmental advantages of LNG over diesel and heavy fuel oil. The maritime and heavy-duty trucking industries, in particular, are transitioning to gas-based fuels, including LNG, to comply with stringent emission regulations such as the International Maritime Organization's (IMO) sulfur cap. Improved infrastructure for refueling and the development of LNG-powered vehicles and vessels have also supported the growth of the segment.
Source: Polaris Market Research Analysis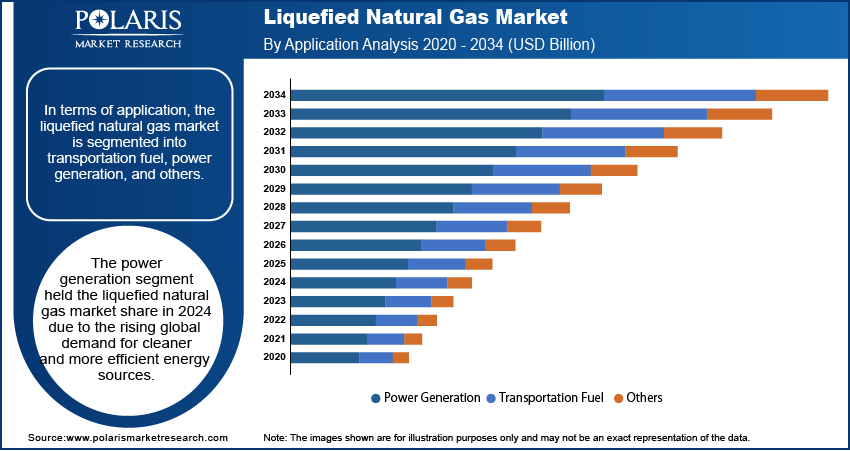
Need Granular Data Across All Market Segments? Request Customization
Regional Analysis
By region, the study provides the LNG market insights into North America, Europe, Asia Pacific, Latin America, and the Middle East & Africa. Asia Pacific dominated the Liquefied Natural Gas market share in 2024 due to surging energy demand and increasing investments in cleaner energy sources. Rapid urbanization in countries such as China, India, and Japan has significantly boosted the consumption of Liquefied Natural Gas for power generation, industrial processes, and residential applications. China led the regional market growth, driven by its aggressive policies to reduce coal dependency and expand natural gas infrastructure, including pipelines and LNG terminals. Additionally, rising industrialization and government incentives to adopt low-emission energy sources have contributed to Asia Pacific's dominance in the global Liquefied Natural Gas market expansion. According to the Economic Survey 2023–24, presented by the Union Minister of Finance and Corporate Affairs of India, India’s industrial sector witnessed 9.5% growth during the examined period.
The Middle East & Africa Liquefied Natural Gas market is expected to register the fastest growth during the forecast period due to the presence of abundant natural gas reserves and increasing investments in export infrastructure to meet global demand. Countries such as Qatar and the UAE play a crucial role, leveraging their strategic geographic locations to expand LNG export capacity. Additionally, African nations such as Mozambique and Nigeria are rapidly developing new LNG facilities to capitalize on their vast, untapped reserves. This growth aligns with global efforts to diversify energy sources, reduce emissions, and meet the rising demand from industrializing economies. Owing to all these factors, the Middle East & Africa Liquefied Natural Gas market is expected to witness lucrative growth opportunities in the coming years.
Source: Polaris Market Research Analysis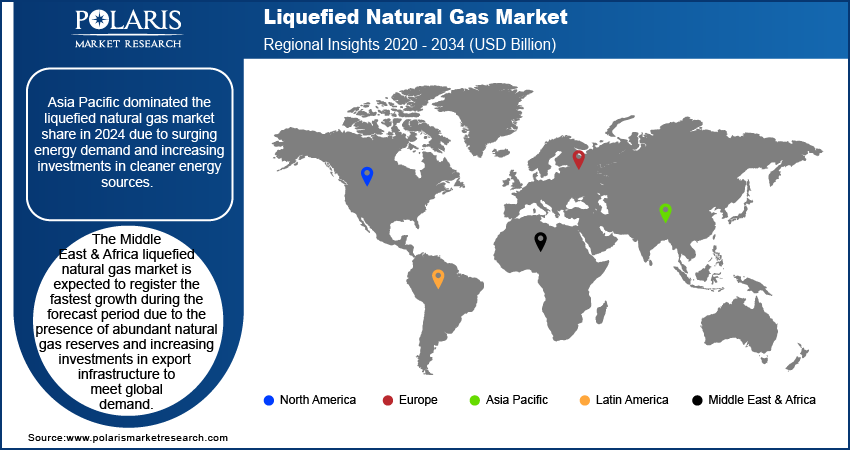
Curious About Regional Market Performance? Request Customization
Key Players & Competitive Analysis Report
Prominent market players are investing heavily in research and development to expand their offerings, which will boost the Liquefied Natural Gas market growth in the coming years. Market participants are also undertaking a variety of strategic activities to expand their global footprint, with important market developments such as innovative launches, international collaborations, higher investments, and mergers and acquisitions between organizations.
The Liquefied Natural Gas market is fragmented, with the presence of numerous global and regional market players. A few major players in the market are Eni SpA, Equinor ASA, Exxon Mobil Corporation, Gazprom Energy, PetroChina Company Limited, Shell PLC, Total S.A., British Petroleum (BP) p.l.c., Chevron Corporation, China Petroleum & Chemical Corporation, Fluor Corporation, Bechtel Corporation, Gasum AS, and TechnipFMC plc.
Exxon Mobil Corporation, commonly known as ExxonMobil, is an American multinational oil and gas company headquartered in Spring, Texas. Formed in 1999 through the merger of Exxon and Mobil, it has become one of the largest publicly traded energy providers globally, with operations spanning the entire oil and gas industry, including exploration, production, refining, and marketing. ExxonMobil is a significant player in the petrochemical sector, producing a wide range of chemicals and plastics essential for various industries. In recent years, the company has increasingly focused on liquefied natural gas (LNG) as part of its strategy to meet the world's growing energy demands while transitioning to cleaner energy sources. The company operates several LNG facilities and has established partnerships to develop new LNG projects. In October 2024, Exxon Mobil and Qatar Energy's LNG joint venture received a three-year extension to complete the construction of their Golden Pass LNG plant in Texas.
Fluor Corporation is a major US-based multinational engineering and construction firm headquartered in Irving, Texas. Established in 1912 by John Simon Fluor, the company has evolved significantly over the decades, initially focusing on building oil refineries and pipelines before diversifying into various sectors, including industrial and infrastructure projects, government services, and power generation. Fluor has made substantial investments in LNG projects in recent years, recognizing the growing demand for cleaner energy sources worldwide.
List of Key Companies
- Bechtel Corporation
- British Petroleum (BP) p.l.c.
- Chevron Corporation
- China Petroleum & Chemical Corporation
- Eni S.p.A
- Equinor ASA
- Exxon Mobil Corporation
- Fluor Corporation
- Gasum AS
- Gazprom Energy
- PetroChina Company Limited
- Shell PLC
- TechnipFMC plc
- Total S.A.
Liquefied Natural Gas Industry Developments
- August 2025: Technip Energies In August, Technip Energies, in partnership with JGC, secured two FEED contracts for the INPEX Abadi LNG project located in Indonesia.
- August 2025: Technip Energies secured a major EPC contract from Commonwealth LNG for a proposed 9.5 Mtpa export facility in Cameron Parish, Louisiana, USA. The project features six identical liquefaction trains using its SnapLNG modular technology, with FID expected in the second half of 2025 and production planned around 2029.
- June 2025: Penn America Energy Holdings (PAE) revealed intentions to construct a high-capacity LNG export hub along Pennsylvania’s Delaware River, designed to ship 7.2 million tons of LNG each year.
- June 2025: BP Singapore disclosed a long-term deal with Torrent Power to provide up to 0.41 million metric tons of LNG each year from 2027 to 2036, intended to fuel Torrent’s combined-cycle, gas-powered facilities totaling 2,730 MW in capacity.
- October 2024: Copelouzos Group formed a strategic partnership with the Egyptian Natural Gas Holding Company (EGAS) to transport liquified natural gas (LNG) through the recently opened floating power plant storage regasification unit (FSRU) terminal in Greece.
- March 2024: The Government of India inaugurated the country’s first Small Scale LNG Unit of GAIL near the Hatta gas field in Madhya Pradesh.
- March 2023: Sempra announced that its 70%-owned subsidiary, Sempra Infrastructure Partners, LP, made the final investment decision (FID) for the development, construction, and operation of the Port Arthur LNG Phase 1 project in Jefferson County, Texas.
Market Segmentation
By Application Outlook (Volume, Billion Tons; Revenue, USD Billion, 2020–2034)
- Transportation Fuel
- Power Generation
- Others
By Regional Outlook (Volume, Billion Tons; Revenue, USD Billion, 2020–2034)
- North America
- US
- Canada
- Europe
- Germany
- France
- UK
- Italy
- Spain
- Netherlands
- Russia
- Rest of Europe
- Asia-Pacific
- China
- Japan
- India
- Malaysia
- South Korea
- Indonesia
- Australia
- Vietnam
- Rest of Asia Pacific
- Middle East & Africa
- Saudi Arabia
- UAE
- Israel
- South Africa
- Rest of Middle East & Africa
- Latin America
- Mexico
- Brazil
- Argentina
- Rest of Latin America
Liquefied Natural Gas Market Report Scope
| Report Attributes | Details |
| Market Size Value in 2024 | USD 122.55 billion |
| Market Size Value in 2025 | USD 136.45 billion |
| Revenue Forecast by 2034 | USD 363.15 billion |
| CAGR | 11.5 % from 2025 to 2034 |
| Base Year | 2024 |
| Historical Data | 2020–2023 |
| Forecast Period | 2025–2034 |
| Quantitative Units | Volume in Billion Tons, Revenue in USD Billion, and CAGR from 2025 to 2034 |
| Report Coverage | Revenue Forecast, Market Competitive Landscape, Growth Factors, and Trends |
| Segments Covered |
|
| Regional Scope |
|
| Competitive Landscape |
|
| Report Format |
|
| Customization | Report customization as per your requirements with respect to countries, regions, and segmentation. |
Source: Polaris Market Research Analysis
Liquefied Natural Gas Market FAQ's
• The global market size was valued at USD 122.55 billion in 2024 and is projected to grow to USD 363.15 billion by 2034.
• The global market is projected to register a CAGR of 11.5% during the forecast period.
• Asia Pacific held the largest share of the global market in 2024.
• A few of the key players in the market are Eni SpA, Equinor ASA, Exxon Mobil Corporation, Gazprom Energy, PetroChina Company Limited, Shell PLC, Total S.A., British Petroleum (BP) p.l.c., Chevron Corporation, China Petroleum & Chemical Corporation, Fluor Corporation, Bechtel Corporation, Gasum AS, and TechnipFMC plc.
• The power generation segment dominated the market in 2024.
LNG is natural gas cooled to approximately ?162°C into liquid form, reducing its volume to about 1/600th of its gaseous state, enabling efficient storage and long-distance transportation where pipelines are unavailable.
Key trends include accelerating global urbanization driving demand for cleaner energy sources, and continuous innovations in LNG production, storage, and distribution technologies that reduce costs and expand accessibility across diverse sectors.
Download Sample Report of Liquefied Natural Gas Market
Please fill out the form to request a customized copy of the research report.
