
Metaverse Market Size, Share & Growth Analysis Report, 2026-2034
REPORT DETAILS
Market Statistics
Market Overview
The metaverse market size stood at USD 156.07 billion in 2025. It is expected to register a CAGR of 46.3% from 2026 to 2034. Advancements in AR/VR, blockchain, and 5G boost the industry growth. Also, the growing demand for immersive experiences, digital asset adoption, and remote collaboration is driving market expansion.
Key Takeaways
- North America held the largest share of 70.70% in 2025. This dominant position is due to substantial capital investment and a strong presence of industry innovators in the region.
- The Asia Pacific metaverse industry is expected to experience the highest growth rate of 46.8% during the forecast period. Investments in developed metaverse localized frameworks and rural infrastructure development are contributing to the regional market growth.
- The software segment led the market with a 62.31% revenue share in 2025. This is due to the expansive and growing ecosystem of virtual experiences and functionalities.
- The blockchain technology segment is forecast to grow at a CAGR of 38.5%. Increasing demands for ownership and decentralized identity management propel the growth of the market segment.
- The gaming segment held the largest market share of 49.10% in 2025. This is due to higher user engagement and proven gaming business models.
Note: Figures and projections outlined in this report are the result of Polaris Market Research’s proprietary analytical processes, grounded in the latest available datasets and market observations.
Industry Dynamics
- Improvements in immersive technologies such as virtual reality, augmented reality, mixed reality, and extended reality are one of the major metaverse growth drivers.
- The rising trend of individuals spending considerable time within the virtual space, especially on online gaming sites and virtual social spaces, drives the market expansion.
- The growth of the metaverse industry is primarily fueled by the evolution of the digital economy and the concept of asset ownership.
- Increasing metaverse investments from major tech companies in developing the metaverse are expected to provide metaverse opportunities during the forecast period.
- High metaverse hardware cost and infrastructure cost hinder the industry's expansion.
- As the metaverse grows, trust and safety become important for keeping users engaged. And for enabling business use. Issues like identity protection and safeguarding biometric and personal data strongly affect how platforms are perceived and how regulators respond.
- For enterprise use cases, metaverse ROI is typically driven by measurable outcomes such as reduced training time and faster design cycles. Total cost of ownership (TCO) should account for devices, content management, and ongoing maintenance.
- Entry barriers are expected to decrease as device ecosystems mature and cloud rendering becomes more accessible.
Market Statistics
- 2025 Market Size: 156.07 billion
- 2034 Projected Market Size: 4,792.09 billion
- CAGR (2026–2034): 46.3%
- North America: Largest market in 2025
AI Impact on Metaverse Market
- Adaptive environments utilize machine learning (ML) to respond in real-time to user actions. Machine learning metaverse applications create dynamic and personalized user experiences.
- AI avatars are becoming lifelike. They adapt to user behavior and preferences. The avatars improve virtual interaction and emotional engagement within social metaverse spaces.
- Predictive analytics enables platforms to predict user needs as it customizes content and interactions to enhance user retention and satisfaction.
- Generative AI in metaverse streamlines content creation, enabling rapid development of virtual narratives, 3D assets, and environments.
- AI monitors harmful behavior in complex digital ecosystems and improves metaverse security.
- Gen AI reduces the cost and time needed to create Gen AI 3D assets, scripts, and environments. This helps platforms scale content supply faster than the traditional metaverse content pipeline.
- In industrial metaverse use cases, AI supports simulation and synthetic data generation for robotics and operational planning.
Source: Polaris Market Research Analysis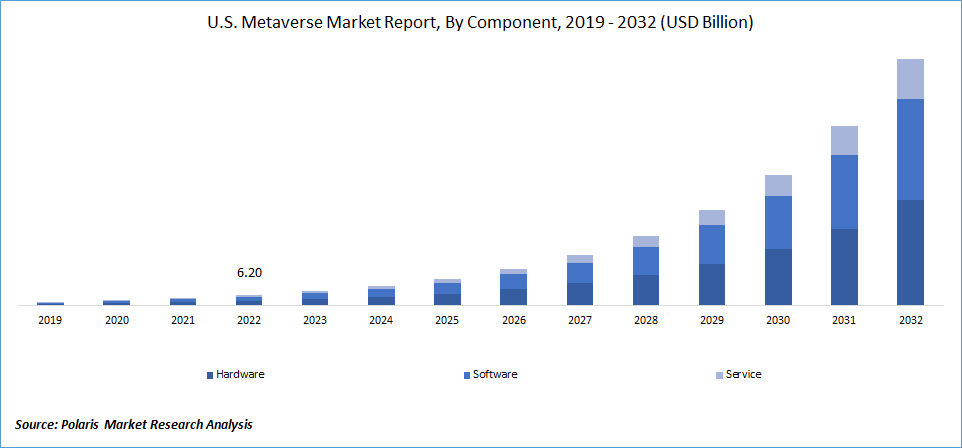
Want a Deeper Look at Key Market Players? Download Sample Report
The metaverse is a dynamic online environment that is considered to be a constantly operating and interacting virtual universe that allows people to interact and communicate through avatars. It is a combination of the physical and online world that provides people with online experiences that exceed the normal online activities they undertake through the use of the internet. The development of these immersive digital worlds relies on advanced technologies such as VR, AR, AI, and blockchain. The metaverse can be considered an advanced form of the internet that has the potential to improve connectivity.
Key Metaverse Components
Virtual Reality (VR): VR enables a fully digital world in which users interact through headsets and control units. VR is widely used for gaming and simulation.
Augmented Reality (AR): AR superimposes digital elements onto the physical environment by means of smartphones, tablets, or smart glasses.
Blockchain: Blockchain helps in ensuring secure digital asset ownership, identity verification, and transactions.
NFTs and Digital Ownership: NFTs can be utilized to establish unique digital assets, including digital art, wearables, and collectibles.
AI Avatars: AI enhances avatars by incorporating speech recognition, behavioral learning, translation, and natural interaction capabilities.
Digital Assets: Both users and businesses can trade their digital lands, apparel, jewelry, and even experiences within virtual worlds
The metaverse means always-on, interactive, and immersive 3D digital environments that people access using technologies like augmented reality (AR), virtual reality (VR), mixed reality (MR), and XR interfaces. These 3D environments are supported by key technologies such as real-time graphics engines, cloud and edge computing, networking, AI, and secure digital payment systems. The metaverse market sizing includes metaverse platforms, tools, experiences, and infrastructure needed to create and run these 3D worlds.
The metaverse environment can also be conceptualized as a layered construct. The foundation level of the metaverse ecosystem includes things such as cloud computing, edge computing, and networks. Next are devices like headsets, smart glasses, and sensors that allow a person to enter the virtual world. Then there are engines and tools that help to create virtual worlds through the use of 3D engines and content creation tools. These, in turn, are supported by platforms and virtual worlds that include environments for social interactions, gaming, and business. The next level includes identity and the digital assets economy, which encompasses payments and digital wallets. Finally, at the highest level are experiences such as work and education.
Advancements in hardware and the emerging capabilities of VR and AR equipment are major factors driving the adoption of metaverse in healthcare and other enterprise use cases. Simultaneously, the demand for immersive entertainment experiences, remote collaboration, and the latest trends in social engagement are additional factors fueling the use of this technology. The investments major technology companies are making in the VR field, integrating blockchain to enable secure transactions and govern virtual assets, are driving revenue growth.
Industry Dynamics
Advancements in Immersive Technology
Development of immersive technology is crucial to the expansion of the metaverse market. Technologies such as virtual reality, augmented reality, mixed reality, and extended reality are developing immersive environments. These technologies allow users to interact, work, study, and play in an immersive environment that enhances the user experience.
Better visuals and motion tracking make the metaverse more attractive. Hardware innovations such as smart glasses have made it easier to enter the market. Simultaneously, increased sophistication in software, such as the use of AI in avatars, advances in real-time rendering engines, and cloud computing, is making the creation of the virtual world even simpler.
Moreover, in light of such applications, industries such as gaming, entertainment, education, healthcare, and retail have begun incorporating immersive technology into their solutions to build metaverse applications for engagement and innovation. Consequently, not only have their applications started showing improvement in user satisfaction, but there are also emerging revenue models for virtual goods, services, and experiences. Thus, innovation in immersive technology applications has emerged as a key factor in realizing the metaverse.
Increased Digital Engagement and Virtual Social Spaces
The increasing trend of people spending more time in a digital environment, whether online gaming or social platforms, creates a strong foundation for the growth of both the metaverse and the industrial metaverse. Users are increasingly accustomed to building communities and interacting in virtual environments, which naturally lends itself to more complex and immersive metaverse experiences. A 2023 research article published in JMIR Serious Games explored the use of serious games for health education. It showed high levels of user engagement and satisfaction. This reflects society's comfort with interactive digital platforms. This comfort and demand, already achieved and attained for rich online interaction, contribute significantly to the growth of the metaverse.
Digital Economy Development and Asset Ownership
The growth of the metaverse market is significantly driven by the development of digital economies and asset ownership. In virtual worlds, users can create, trade, and own digital assets like virtual land, avatars, clothes, and art. This often happens via blockchain technology and NFTs. These digital assets give users a sense of ownership and control, reflecting real-world economic systems within digital environments.
Blockchain technology guarantees transparency, security, and verifiability of transactions, enabling the building of decentralized marketplaces where users can freely sell and buy goods and services.In this light, virtual businesses began to arise, besides play-to-earn gaming models and innovation in investment opportunities, representing real monetary value while doing virtual activities. Moreover, digital currencies are increasingly integrated into metaverse platforms, allowing seamless and boundary-free transactions.
The option to monetize time and social influence in these virtual spaces is bringing more users. It is also drawing more developers to expand the ecosystem. With the maturation of digital economies, brands are taking an interest in the metaverse as a new frontier for commerce. In this way, the evolution achieves two important things: increasing user engagement and positioning the metaverse as a viable economic platform here to stay.
Source: Polaris Market Research Analysis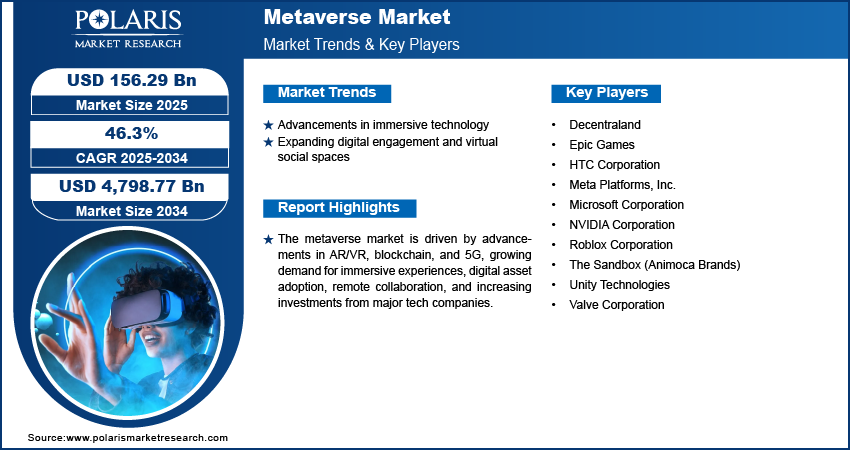
Get Full Segment-Level Forecasts & Insights: Download Sample Report
AR vs VR vs MR vs XR
| Technology | Description | End User Experience | Application Usage |
| AR | Augmented Reality | Involves digital augmentation of reality | Determination of purchase decision, navigation |
| VR | Virtual Reality | Provides full immersion in digital world | Video games, simulation training |
| MR | Mixed Reality | Conjunctive reality and digital worlds | Product development, medicine application |
| XR | Extended Reality | Merges AR, VR, and MR | Entire ecosystem |
Source: Polaris Market Research Analysis
Segmental Insights
Market Assessment By Component
In 2025, the software component had the largest market share in the metaverse. This vast and expanding ecosystem of virtual experiences and functionalities establishes the software component as a leader in terms of size and activity, thereby substantially shaping the evolution of the virtual world. Developer ecosystems, content pipelines, and platform toolkits further support software leadership. These tools allow for faster experience creation and monetization. Platforms that simplify content creation and distribution improve retention.
The service component segment of the metaverse market is expected to experience significant growth during the forecast period. This includes metaverse services such as world or asset creation, maintenance, experience design, and other services related to supporting the operation of the platform. As more and more aspects of everyday life integrate with the metaverse, the need for specialized knowledge to build, populate, and manage complex worlds in this space has increased. The level of complexity present in the creation of interesting and scalable experiences in the metaverse presents a strong case in favor of investing in service infrastructure that will fuel the huge rate of growth in metaverse service aspects during the predicted period. Identity access management and device management are also acting as enterprise demand accelerators.
Market Evaluation by Technology
The virtual reality (VR) and augmented reality (AR) subsegment has the largest share of the metaverse market. They provide the main interfaces by which the users of the metaverse interact with the immersive virtual world. The rapid advances and increased popularity of VR headsets and AR applications across sectors such as gaming, education, and business have had a substantial impact. The shift toward spatial computing marks a key interface evolution. It is enabling more natural interactions and unlocking broader enterprise productivity workflows. Future advancements in these areas, as well as ongoing innovations in the development of related software and hardware, have played a significant role in shaping the size of the VR and AR markets in the metaverse.
The blockchain technology segment is forecast to have a fast-paced growth. This technology has immense potential in terms of its decentralization abilities. With the rapid evolution of the metaverse, there is a growing need for trusted ownership verification and a decentralized identity solution. This has made blockchain technology a platform for cross-platform business in the virtual world. This becomes achievable through regulatory developments and interoperability standards.
Market Assessment by Application
Gaming currently accounts for the largest use of the metaverse. Notably, the growth of virtual worlds in the gaming industry has largely driven the use of the metaverse in gaming. The high engagement in the gaming industry, coupled with the well-known monetization models, makes the segment a dominant sector in the use of the metaverse. At the same time, adjacent applications such as virtual events metaverse, and enterprise training simulation are emerging as fast-growing use cases. This is extending metaverse adoption beyond entertainment into education and skill development.
Social media and content creation have the greatest potential for growth within the metaverse market. Over time, the digital environment has evolved to the point that individuals increasingly seek to express themselves. This has contributed significantly to the metaverse’s potential for innovation. There is considerable progress in the area, especially with the intervention of user-centric connection paradigms.
Market Evaluation By Industry
The media and entertainment segment is expected to have the largest metaverse market share during the forecast period. The industry has become a significant driver and adopter of immersive technology, and its user base. The gaming ecosystem, including virtual concerts, social experiences, and content consumption, remains active and is always asking for new, exciting systems. This, in turn, fuels further advancements in metaverse platforms. The demand and inherent innovation in media and entertainment contribute significantly to the size and dynamics of the metaverse platform.
The retail segment is growing the fastest in the market. While companies seek the latest way to reach customers and sell merchandise on the metaverse, the area of virtual stores, digital showrooms, and other shopping interfaces holds still-undiscovered potential. The more virtual dressing rooms, branded NFTs of digital products, and buying experiences find their place in virtual worlds, the more these factors will begin to emerge. This changing landscape gives retailers the most powerful new ways to reach and engage consumers worldwide while influencing how they perceive brands, shaping the future of the metaverse.
Apart from the core industries, many other sectors are also starting to use metaverse technologies for specific needs. Metaverse in education is helping students learn through virtual classrooms and skill-based training. In healthcare, these platforms are being used for doctor training, therapy sessions, rehabilitation, and better interaction with patients. Meanwhile, manufacturers are using digital twins and other metaverse in manufacturing tools to improve production processes and employee training.
Source: Polaris Market Research Analysis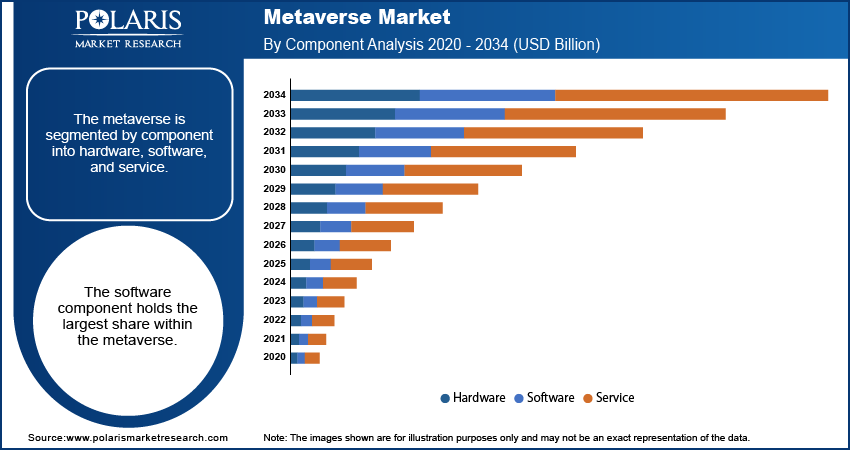
Need Granular Data Across All Market Segments? Request Customization
Regional Analysis
The North America metaverse market holds the largest share. This is due to substantial capital investment, a strong presence of industry innovators, and a high rate of early technology adoption among the population. Key players in augmented and virtual reality technology, along with other metaverse companies in the region, focus on extensive research and development initiatives. The ecosystem of avid consumer tech enthusiasts, combined with the efforts of large tech corporations, gives North America significant attention in the global metaverse market.
Within the region, the US metaverse market is a major driver of growth. The country leads in investing in metaverse platforms and running enterprise pilot projects with businesses. This helps push consumer-facing metaverse experiences and industrial uses of the metaverse.
The Asia Pacific metaverse market is expected to experience the highest growth rate during the forecast period. Traditional online gaming and digital entertainment, along with online shopping and various lifestyle elements in the region, are primarily driven by increased consumer spending. Additionally, investments in developed metaverse localized frameworks, along with rural infrastructure development, are facilitating technological advancements in digitalized regions across multiple domains. This makes Asia Pacific the most lucrative region for IT infrastructure development, offering promising opportunities for future expansion.
In the Asia Pacific, Countries like South Korea, India, and the Japan XR market are important drivers of growth. This is because people in the region are highly active online, and gaming is already well developed. Also, new digital technologies are adopted quickly in APAC. Furthermore, better internet connectivity and improved devices have led to businesses increasingly using these platforms. All of these factors are driving the APAC metaverse growth.
Key Players and Competitive Insights
Major metaverse market players include Meta Platforms, Inc., Roblox Corporation, Epic Games, Microsoft Corporation, NVIDIA Corporation, Decentraland, The Sandbox (Animoca Brands), Unity Technologies, Valve Corporation, and HTC Corporation. These organisations are diverse, spanning from social media giants pivoting to immersive experiences to gaming powerhouses, hardware manufacturers, and developers of foundational digital infrastructure. Each company contributes unique elements, from virtual reality headsets and graphical processing units to decentralised virtual land and content creation tools, highlighting a broad investment across the technological stack required for metaverse development and penetration.
The metaverse competitive landscape is fragmented across various global sectors, including platform development, content creation, and technological innovation. Enterprises are vying to create engaging virtual worlds and interoperable systems that promote rich digital economies and facilitate high levels of user interaction. The dynamics of competition also involve consortium formations, strategic alliances, and mergers and acquisitions, excluding the companies that have been acquired. Companies are investing significantly in research and development to overcome barriers to user immersion. Their goal is to provide users and creators with the essential tools to integrate their lifestyles into the metaverse while addressing challenges related to scalability, interoperability, and safety.
Source: Polaris Market Research Analysis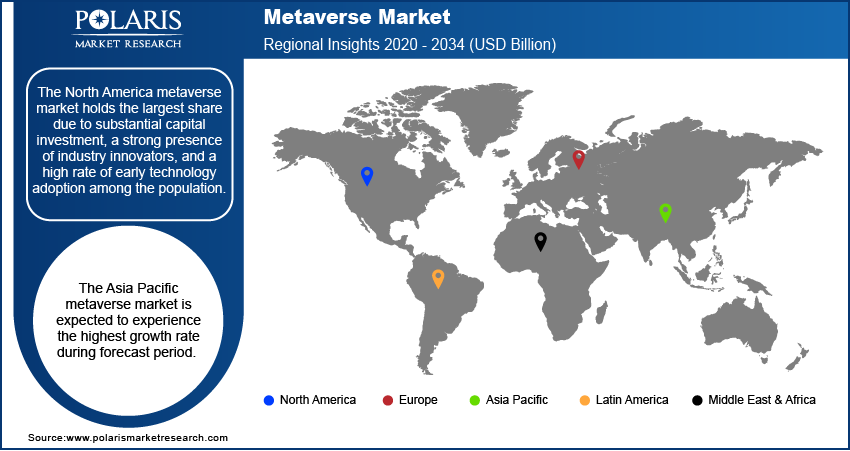
Curious About Regional Market Performance? Request Customization
Competitive Map by Metaverse Technology Stack
The metaverse is not a platform owned and operated by a single firm. Instead, the metaverse comprises a set of technology tiers, and different companies compete in different tiers. These layers are interdependent on each other. This creates a complex and layered ecosystem. Breaking down the metaverse by tiers enables a clear view to be obtained on value addition and the evolution of the overall market.
Devices and Compute
This is the foundation that enables the creation of immersive experiences in the metaverse market. This consists of hardware such as virtual reality headsets and the computing power required for the creation of virtual reality environments. Meta Platforms, Inc., NVIDIA Corporation, and Microsoft are some of the companies that offer virtual reality headsets and the computing power required for the creation of virtual reality environments. This enhances the usage experience and thus increases adoption.
Engines and Creation Tools
This layer involves the software applications used to create virtual worlds and other content for the Metaverse. Applications such as Unity, Unreal Engine, and Valve enable developers to create 3D environments, assets, and experiences in the metaverse.
Consumer Worlds and Social Platforms
This level involves virtual worlds that users interact with. Here, they play, visit for events, and purchase virtual goods. Decentraland, The Sandbox, and Roblox are examples of such platforms. In consumer worlds, success is based on social interactions between users, rather than technical merits.
Enterprise and Industrial Metaverse
This involves a set of technologies that revolve around business and industrial use cases. They include simulation, digital twins, training, and remote collaboration. This is supported by vendors like Microsoft and Epic Games. It is relevant in industries like manufacturing, healthcare, and infrastructure, among others, because of visible business value in areas like cost savings and improved productivity.
Strategic Implication
In summary, the metaverse market is split by function and not led by any particular company. Most organizations only focus on either one layer or two layers and partner with other organizations on the other layers. This ensures that there is also a collaborative environment.
List of Key Companies
- Decentraland
- Epic Games
- HTC Corporation
- Meta Platforms, Inc.
- Microsoft Corporation
- NVIDIA Corporation
- Roblox Corporation
- The Sandbox (Animoca Brands)
- Unity Technologies
- Valve Corporation
Future of Metaverse Market
The use of artificial intelligence, the evolution of wearables, and the first experience through mobile devices have been identified as major drivers for the future growth of the metaverse market. Major enterprise adoption for training and collaboration is expected. Creator economy and virtual shopping will further drive the market development.
Metaverse Industry Developments
April 2026: NVIDIA and partners announced new initiatives at Hannover Messe 2026. According to NVIDIA, the new initiatives leverage the NVIDIA Omniverse platform for AI-driven manufacturing and digital twins. (source: nvidia.com)
May 2025: Roblox introduced new commerce APIs. According to Roblox, the new APIs allow brands and creators to integrate physical goods for purchase directly within virtual stores on its platform. (Source: roblox.com)
Metaverse Market Segmentation
By Component Outlook (Revenue – USD Billion, 2021–2034)
- Hardware
- Software
- Service
By Technology Outlook (Revenue – USD Billion, 2021–2034)
- Blockchain
- Virtual Reality & Augmented Reality
- Mixed Reality
- Others
By Platform Outlook (Revenue – USD Billion, 2021–2034)
- Desktop
- Mobile
- Headsets
By Application Outlook (Revenue – USD Billion, 2021–2034)
- Digital Marketing
- Content Creation & Social Media
- Gaming
- Events & Conference
- Online Shopping
- Testing & Inspection
- Others
By Industry Outlook (Revenue – USD Billion, 2021–2034)
- Retail
- Media & Entertainment
- BFSI
- Others
By Regional Outlook (Revenue – USD Billion, 2021–2034)
- North America
- US
- Canada
- Europe
- Germany
- France
- UK
- Italy
- Spain
- Netherlands
- Russia
- Rest of Europe
- Asia Pacific
- China
- Japan
- India
- Malaysia
- South Korea
- Indnesia
- Australia
- Vietnam
- Rest of Asia Pacific
- Middle East & Africa
- Saudi Arabia
- UAE
- Israel
- South Africa
- Rest of Middle East & Africa
- Latin America
- Mexico
- Brazil
- Argentina
- Rest of Latin America
Metaverse Market Report Scope
| Report Attributes | Details |
| Market Size in 2025 | USD 156.07 billion |
| Market Size in 2026 | USD 227.77 billion |
| Revenue Forecast by 2034 | USD 4,792.09 billion |
| CAGR | 46.3% |
| Base Year | 2025 |
| Historical Data | 2022–2024 |
| Forecast Period | 2026–2034 |
| Quantitative Units | Revenue in USD billion, 2021–2034 and CAGR from 2026 to 2034 |
| Report Coverage | Revenue Forecast, Market Competitive Landscape, Growth Factors, and Trends |
| Segments Covered |
|
| Regional Scope |
|
| Competitive Landscape | Metaverse Industry Trend Analysis (2025) Company profiles/industry participants profiling include company overview, financial information, product/service benchmarking, and recent developments |
| Report Format | PDF + Excel |
| Customization | Report customization as per your requirements with respect to countries, regions, and segmentation. |
Source: Polaris Market Research Analysis
metaverse market FAQ's
The metaverse market stood at USD 156.07 billion in 2025. It is projected to reach 4,792.09 billion by 2034.
The CAGR for the metaverse market is projected to be 46.3% between 2026 and 2034.
Advancements in immersive technologies and increased digital engagement have led to increased adoption of the metaverse.
North America holds the largest share. This is due to substantial capital investment and a strong presence of industry innovators in the region.
Increased consumer spending and rising investments in developed metaverse localized frameworks have led to market growth in the Asia Pacific.
The software component leads the market. This is due to the vast and expanding ecosystem of virtual experiences and functionalities.
Meta Platforms, Inc., Roblox Corporation, Epic Games, Microsoft Corporation, NVIDIA Corporation, and Decentraland are a few of the key players in the market. Device & compute, engines & creation tools, and enterprise & social metaverse are the layers in which these players compete.
Enterprise training, events, and retail are some of the important applications of the metaverse beyond gaming.
Security and privacy are some of the key risks for the metaverse industry.
Interoperability in the metaverse means that digital identities and assets can move smoothly across different platforms. It’s important because it reduces vendor lock-in and protects long-term investments in digital assets.
Download Sample Report of metaverse market
Please fill out the form to request a customized copy of the research report.
