
Middle East Chemical Distribution Market Growth Analysis, 2025-2034
REPORT DETAILS
Market Statistics
Overview
The Middle East chemical distribution market size was valued at USD 3.01 billion in 2024, growing at a CAGR of 3.56% from 2025–2034. Key factors driving demand includes growing domestic manufacturing, water scarcity and treatment needs, downstream petrochemical expansion, and rising construction and infrastructure sector.
Key Insights
- Commodity chemicals held an 88.6% revenue share in 2024, driven by their heavy use in the region's core oil, gas, and construction industries.
- The downstream chemicals segment is projected for the fastest growth at a 2.4% CAGR during the forecast period, fueled by the region's strategic focus on petrochemical integration and derivative production.
- The Saudi Arabia held a 36.2% market share in 2024, leveraging its robust petrochemical base and advanced industrial infrastructure as major advantages.
- The UAE's position as a regional trade hub and its diversified economy drive chemical demand across construction, water treatment, and manufacturing.
Industry Dynamics
- Middle East chemical distribution is growing due to downstream expansion. The region is converting hydrocarbons into higher-value polymers and specialty chemicals, increasing local supply.
- Demand is further fueled by major construction projects, rapidly increasing the need for chemicals such as coatings, adhesives, and concrete additives.
- Heavy reliance on hydrocarbon-driven economic cycles creates market volatility, making long-term planning and investment in diverse specialty segments difficult for distributors.
- National diversification agendas like Saudi Vision 2030 are accelerating domestic manufacturing, opening new high-value distribution channels in pharmaceuticals, technology, and sustainable chemicals.
Market Statistics
- 2024 Market Size: USD 3.01 billion
- 2034 Projected Market Size: USD 4.27 billion
- CAGR (2025-2034): 3.56%
- Saudi Arabia: Largest market in 2024
AI Impact on Middle East Chemical Distribution Market
- AI optimizes complex logistics, managing port delays and desert transport to slash delivery times and costs across the vast regional geography.
- It enables predictive demand forecasting, anticipating regional construction and industrial project needs to optimize inventory and prevent costly stock outs or overstocking.
- AI enhances customer-specific services, analyzing client data to recommend tailored chemical blends and just-in-time delivery for their unique production processes.
- It strengthens supply chain resilience by identifying potential disruptions and autonomously rerouting shipments to ensure reliable delivery in a volatile region.
Chemical distribution refers to the process of sourcing, storing, blending, packaging, and delivering chemicals to various end-use industries, acting as a vital link between producers and consumers. In the Middle East, the market is experiencing strong growth as domestic manufacturing expands across various sectors, such as petrochemicals, construction, and pharmaceuticals. The growing push for industrial self-sufficiency, supported by government diversification initiatives, is driving the expansion of local production capacities. As a result, demand for reliable chemical distribution networks is increasing to ensure consistent supply, specialized logistics, and value-added services that align with regional manufacturing growth. According to World Bank data, manufacturing accounted for 16% of Saudi Arabia's GDP in 2024. The integration of local production with efficient distribution highlights how domestic manufacturing is strengthening the role of distributors in sustaining the supply chain.
Source: Polaris Market Research Analysis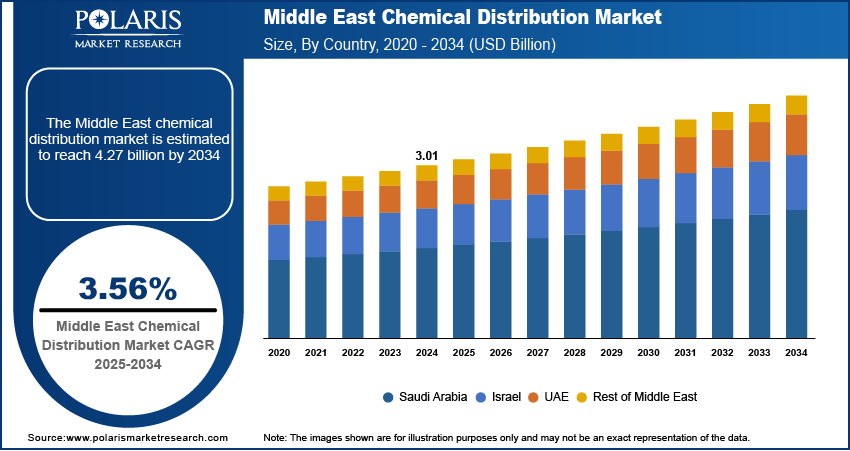
Want a Deeper Look at Key Market Players? Download Sample Report
The market is further expanding due to the growing challenge of water scarcity, which has led to a focus on water treatment solutions. Industries and municipalities are increasingly investing in desalination, water and wastewater treatment equipment, and advanced water recycling technologies, with the region’s dry climate and limited freshwater resources. For instance, in January 2025, the National Water Company of Saudi Arabia stated that it had completed 118 water and sanitation projects in 2024, valued at approximately USD 1.49 billion, serving 1.8 million beneficiaries across the kingdom. These types of projects create new avenues for expanding the chemical distribution market. These processes rely heavily on specialty chemicals such as coagulants, flocculants, biocides, and membrane treatment chemicals, which distributors play a major role in supplying. This rising demand creates opportunities for distributors to expand their portfolios and also positions chemical distribution as a critical enabler in addressing the region’s long-term sustainability challenges. Therefore, by supporting water security through the timely and efficient delivery of treatment chemicals, distributors are becoming central to the Middle East’s industrial and environmental resilience.
Drivers & Opportunities
Downstream Petrochemical Expansion: Downstream petrochemical expansion is driving the Middle East chemical distribution market, as the region is leveraging its large hydrocarbon resources to diversify into higher-value chemical products. The production of polymers, specialty chemicals, and intermediates is steadily increasing, with governments and private players focusing on refining and petrochemical integration. According to a 2024 GPCA report, Saudi Arabia accounted for over 64% of the GCC's total polymer production capacity. This growth creates greater demand for robust distribution networks that can manage bulk handling, storage, and tailored supply to multiple end-use industries. Chemical distributors are positioned at the center of this expansion, ensuring timely delivery, quality compliance, and logistics efficiency. Distributors are playing an increasingly strategic role in connecting regional producers with both local and international markets as downstream capacities expand.
Rising Construction and Infrastructure Sector: The rising construction and infrastructure sector is another strong driver of chemical distribution in the Middle East, fueled by ongoing urban development, smart city initiatives, and large-scale infrastructure projects. For instance, in July 2025, the Construction Cost Index (CCI) increased by 0.7% year-over-year, primarily driven by a 0.7% rise in residential and a 0.6% increase in non-residential construction costs, highlighting the rising opportunities for chemicals. The demand for construction-related chemicals, such as adhesives, sealants, coatings, concrete additives, and insulation materials, is growing rapidly. Distributors play a crucial role in meeting this demand by providing reliable supply, technical support, and product customization tailored to regional climate conditions. Moreover, the sector’s focus on durability and sustainability is creating opportunities for distributors to introduce advanced and eco-friendly chemical solutions. Therefore, by aligning with the construction boom, chemical distributors are supporting the region’s infrastructural growth and also reinforcing their role in delivering innovation and efficiency to the market.
Source: Polaris Market Research Analysis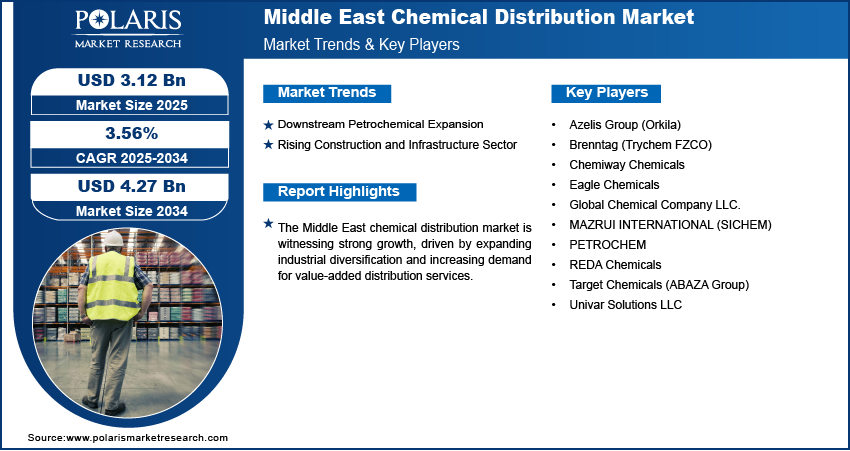
Get Full Segment-Level Forecasts & Insights: Download Sample Report
Segmental Insights
Type Analysis
Based on type, the segmentation includes specialty chemicals, commodity chemicals. The commodity chemicals segment accounted for 88.6% revenue share in 2024, primarily due to their extensive use across core industries such as oil and gas, construction, and manufacturing in the Middle East. These chemicals, which include basic industrial acids, alkalis, and bulk solvents, form the backbone of large-scale production processes. Their high-volume demand is driven by the region’s dominance in petrochemicals and industrial activities, where commodity chemicals serve as essential feedstock and intermediates. Furthermore, distributors play a crucial role in ensuring cost-effective bulk delivery, standardized quality, and reliable logistics, which support the wide consumption of these products across regional markets.
End Use Analysis
In terms of end use, the segmentation includes specialty chemicals, commodity chemicals. Under the commodity chemicals, downstream chemicals segment is expected to witness fastest growth at a CAGR of 2.4% during the forecast period due to the region’s strategic focus on refining and petrochemical integration, which boosts demand for intermediates and derivatives used in plastics, fertilizers, and industrial applications. Distributors serving this segment manage complex supply chains while meeting compliance and safety standards critical to downstream operations. Moreover, the steady expansion of chemical-intensive industries is positioning downstream chemicals as a growth engine, thereby strengthening the role of distributors in ensuring efficient market access and tailored services.
Source: Polaris Market Research Analysis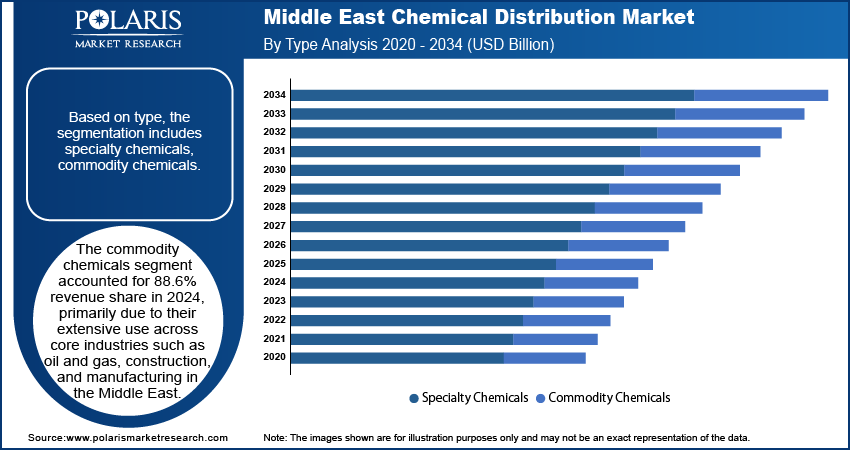
Need Granular Data Across All Market Segments? Request Customization
Country Analysis
Saudi Arabia Chemical Distribution Market
The chemical distribution landscape in Saudi Arabia accounted for largest revenue share of 36.2% in 2024 due to the country’s robust petrochemical base and expanding industrial infrastructure. Saudi Arabia is home to some of the world’s largest chemical producers, creating strong demand for efficient distribution networks that can handle large volumes and diverse product categories. The government’s industrial diversification initiatives under Vision 2030 are also boosting growth in specialty applications, further broadening the scope of chemical distribution. Additionally, distributors in Saudi Arabia play a crucial role in bridging the gap between large-scale production facilities and end-use industries, offering value-added services such as blending, repackaging, and technical support to enhance competitiveness in the market.
UAE Chemical Distribution Market
The UAE market is driven by its strong position as a regional trade hub and its diversified economy, which supports the chemicals industry across various sectors, such as construction, water treatment, and manufacturing. The country’s advanced logistics infrastructure, including major ports and free zones, facilitates the efficient import, export, and re-export of chemicals across the Middle East and beyond. Moreover, the UAE’s focus on sustainability and innovation is driving demand for specialty chemicals in sectors such as renewable energy, coatings, and advanced materials. Distributors benefit from this dynamic landscape by leveraging the country’s strategic location and regulatory frameworks to expand their service offerings. This makes the UAE an important growth center in the region’s chemical distribution ecosystem.
Source: Polaris Market Research Analysis
Curious About Regional Market Performance? Request Customization
Key Players & Competitive Analysis Report
The chemical distribution industry is navigating substantial economic and geopolitical shifts, as well as supply chain disruptions, which create both challenges and opportunities for revenue growth. Competitive intelligence and strategy are crucial; as emerging markets present the strongest expansion opportunities for growth. Success relies on strategic investments in technology and logistics to build sustainable value chains. For small and medium-sized businesses, differentiating themselves through the insight and technical support of specialized experts is a future development strategy. The future of industry ecosystems will be defined by agility and the ability to leverage technological advancement to meet evolving latent demand and opportunities.
Major companies operating in the chemical distribution industry include Azelis Group (Orkila), Brenntag (Trychem FZCO), Chemiway Chemicals, Eagle Chemicals, Global Chemical Company LLC, MAZRUI INTERNATIONAL (SICHEM), PETROCHEM, REDA Chemicals, Target Chemicals (ABAZA Group), and Univar Solutions LLC.
Key Players
- Azelis Group (Orkila)
- Brenntag (Trychem FZCO)
- Chemiway Chemicals
- Eagle Chemicals
- Global Chemical Company LLC.
- MAZRUI INTERNATIONAL (SICHEM)
- PETROCHEM
- REDA Chemicals
- Target Chemicals (ABAZA Group)
- Univar Solutions LLC
Industry Developments
- December 2024: Songwon Industrial’s PVC unit partnered with Altek International FZE to distribute PVC stabilizers in the Middle East, leveraging Altek’s network and expertise to meet increasing regional demand for innovative and sustainable PVC solutions.
- February 2024: Manuchar and Kanoo formed a joint venture in Saudi Arabia named Kanoo Manuchar to distribute chemicals for industries including petrochemicals, mining, nutrition, and personal care.
Middle East Chemical Distribution Market Segmentation
By Type Outlook (Revenue, USD Billion, 2020–2034)
- Specialty Chemicals
- CASE
- Agrochemicals
- Electronic
- Construction
- Specialty Polymers & Resins
- Personal Care & Pharmaceuticals
- Other
- Commodity Chemicals
- Plastic & Polymers
- Synthetic Rubber
- Explosives
- Petrochemicals
- Other
By End Use Outlook (Revenue, USD Billion, 2020–2034)
- Specialty Chemicals
- Automotive & Transportation
- Construction
- Agriculture
- Industrial Manufacturing
- Consumer Goods
- Textiles
- Pharmaceuticals
- Other
- Commodity Chemicals
- Downstream Chemicals
- Textiles
- Electrical & Electronics
- Automotive & Transportation
- Industrial Manufacturing
- Others
By Country Outlook (Revenue, USD Billion, 2020–2034)
- Middle East
- Saudi Arabia
- UAE
- Israel
- Rest of Middle East
Middle East Chemical Distribution Market Report Scope
| Report Attributes | Details |
| Market Size in 2024 | USD 3.01 Billion |
| Market Size in 2025 | USD 3.12 Billion |
| Revenue Forecast by 2034 | USD 4.27 Billion |
| CAGR | 3.56% from 2025 to 2034 |
| Base Year | 2024 |
| Historical Data | 2020–2023 |
| Forecast Period | 2025–2034 |
| Quantitative Units | Revenue in USD Billion and CAGR from 2025 to 2034 |
| Report Coverage | Revenue Forecast, Competitive Landscape, Growth Factors, and Industry Trends |
| Segments Covered |
|
| Country Scope |
|
| Competitive Landscape |
|
| Report Format |
|
| Customization | Report customization as per your requirements with respect to countries, regions, and segmentation. |
Source: Polaris Market Research Analysis
Middle East Chemical Distribution Market FAQ's
The market size was valued at USD 3.01 billion in 2024 and is projected to grow to USD 4.27 billion by 2034.
The market is projected to register a CAGR of 3.56% during the forecast period.
The chemical distribution landscape in Saudi Arabia accounted for largest revenue share of 36.2% in 2024.
A few of the key players in the market are Azelis Group (Orkila), Brenntag (Trychem FZCO), Chemiway Chemicals, Eagle Chemicals, Global Chemical Company LLC, MAZRUI INTERNATIONAL (SICHEM), PETROCHEM, REDA Chemicals, Target Chemicals (ABAZA Group), and Univar Solutions LLC.
The commodity chemicals segment accounted for 88.6% revenue share in 2024.
Under the commodity chemicals, downstream chemicals segment is expected to witness fastest growth at a CAGR of 2.4% during the forecast period.
Download Sample Report of Middle East Chemical Distribution Market
Please fill out the form to request a customized copy of the research report.
