

Market Overview
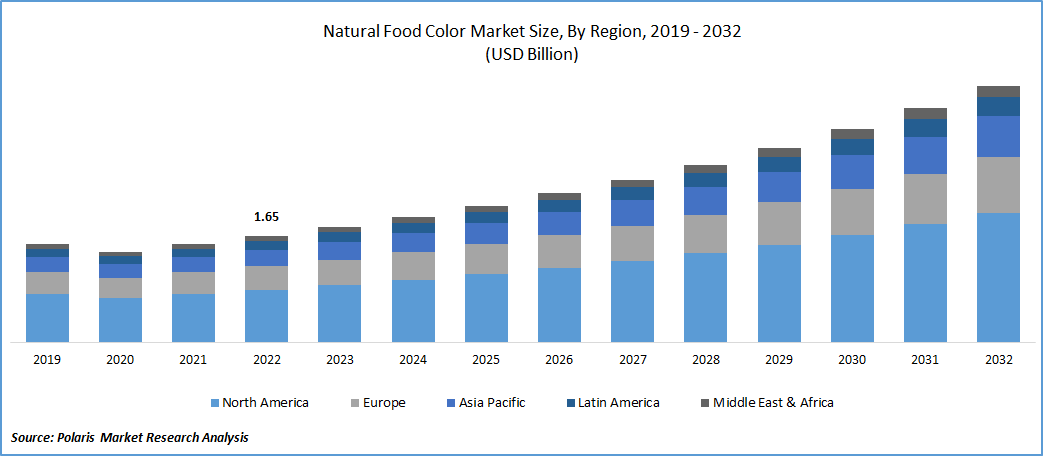
The natural food colors market was valued at USD 2.1 billion in 2024 and is estimated to grow at a CAGR of 8.40% from 2025 to 2034. Food colors are essential for elevating the overall attractiveness and visual appeal of different food preparations. The growth of natural food color businesses is driven by rising consumer preference for clean-label and plant-based ingredients.
Market Insights
- Based on ingredient, the beta-carotene segment held the largest revenue share in 2024. The growth of this segment is attributed to its dual role as a natural food colorant and nutritional supplement.
- Among the major applications, the beverages segment is expected to account for the largest revenue share during the forecast period. The heightened awareness of potential health risks linked to artificial food colors, including allergies and hyperactivity in children, drives consumers' inclination toward beverages containing natural food colors.
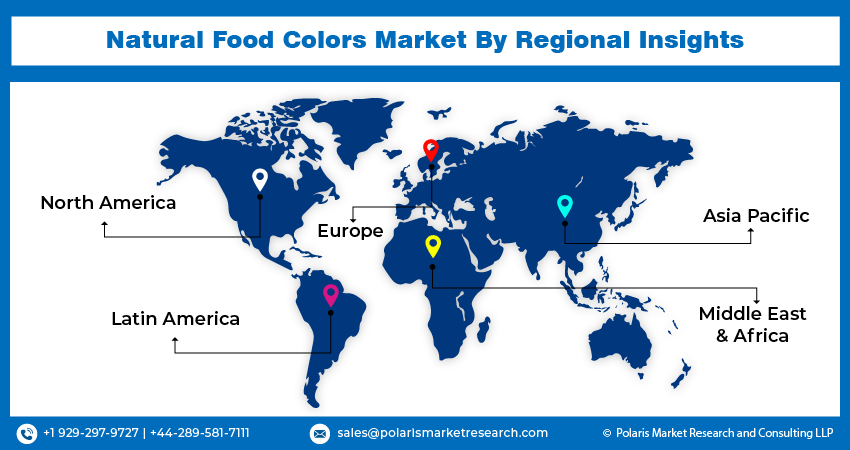
- Europe held the largest share of the natural food colors market in 2024. An upsurge in consumer preference for natural and widely known ingredients bolsters the natural food colors industry in the region.
- Asia Pacific is expected to register the fastest CAGR during the forecast period, driven by the efforts of food and beverage companies to differentiate themselves in a competitive market. They perceive natural ingredients as an attractive way to gain a competitive edge.
Industry Dynamics
- Increasing consumer awareness about distinguishing clean-label products with natural and risk-free ingredients fuels the demand for natural food colors.
- The visual appeal of food and beverages has been a backbone of this industry, which positions natural food colors as a crucial ingredient.
- A surge in the focus on R&D by manufacturers to provide a range of natural food color options contributes to the market's growth.
- Rise in advertising and social media campaigns to promote awareness of products containing natural ingredients presents opportunities for natural food color businesses.
- Natural coloring ingredients are obtained from various fruits, trees, algae, and other sources, which involves extensive processing; thus, the expensive processing limits the profitability of manufacturers.
Market Statistics
Market Size, 2024: USD 2.1 billion
Projected Market Size, 2034: USD 4.7 billion
CAGR (2025–2034): 8.4%
Largest Market in 2024: Europe
AI Impact on Natural Food Colors Market
- Extracting food colors from natural sources is a resource-intensive process. AI aids in accelerated screening of plants, algae, and microbial cultures for pigments, shortening development cycles.
- AI tools can be used in image recognition and process monitoring to ensure uniformity and stability in the coloring process, avoiding variations among batches.
- AI and machine learning can be used to create models to analyze retail data and consumer purchase behavior to identify patterns indicating shifts in demand toward clean-label, plant-based, and sustainable color solutions.
- AI platforms can track updates in global food safety and labeling regulations, helping manufacturers streamline compliance and reduce time-to-market.
To Understand More About this Research: Request a Free Sample Report
The increasing demand for natural food colors is primarily fueled by factors that elevate the overall attractiveness and consumption of these products. A key catalyst is the rising emphasis on visual appeal in the food industry, where natural food colors play a crucial role in enhancing the visual allure of food and beverages. Given that consumers often rely on their eyes to assess food quality, products with vibrant and visually captivating colors are perceived as more valuable and are consequently more likely to be selected for purchase.
The increasing awareness and desire for clean-label products continue to drive the expansion of the natural food colors market. Modern consumers are increasingly mindful of the ingredients in their food and beverages, showing a preference for natural alternatives over artificial additives. As a result, there is a notable increase in the demand for natural food colors sourced from fruits, vegetables, and other botanicals. Manufacturers are actively responding to this trend by providing a diverse array of natural food color options, significantly contributing to the growth of the market for these products.
Moreover, the growth of the global food and beverage industry, especially in developing nations, has contributed to the rising demand for natural food colors. With expanding economies and increasing disposable incomes, consumers in these regions are seeking a wider range of food options. This has prompted food manufacturers to adopt natural food colors to meet the evolving preferences and requirements of these emerging Natural Food Color markets.
The pervasive influence of social media and food photography has made a significant impact on the natural food colors market. Platforms such as Instagram and Facebook have cultivated a culture of showcasing food experiences, placing heightened importance on the visual appeal of food, including its colors. Consequently, food manufacturers and chefs are turning to natural food colors sourced from fruits, vegetables, and other botanicals to craft visually striking and Instagram-worthy dishes.
Industry Dynamics
Growth Drivers
Increasing Consumer Awareness About Distinguishing Products
Consumers, particularly in industrialized nations, have enhanced their ability to discern the manufacturing process and the quality of ingredients used in a product. As they gain knowledge about their food and the processing substances, customers develop preferences for products they want to see on the shelves. This heightened consumer demand for goods crafted with solely natural materials and additives creates ample opportunities for the natural food coloring market in the food processing sector. Moreover, the projected period is expected to witness a rise in demand for natural food colorants and coloring, driven by the increasing consumer inclination to restrict the excessive use of artificial colorants in food products.
What are the Emerging Trends in the Natural Food Colors Market?
The natural food colors industry is expected to undergo a major transformation during 2025–2034. Rising focus on biotechnology, clean-label demand, and sustainability priorities will boost the industry expansion. Fermentation- and algae-derived pigments are expected to become mainstream as companies seek reliable and low-impact production methods. Natural blue is historically difficult to source. The color is expected to gain strong momentum due to new regulatory approvals and improved stabilization technologies. Sustainability, transparency, and advanced microencapsulation are projected to define competitive advantage. It enables natural pigments to finally match or surpass synthetic alternatives in performance.
|
Trend |
Description |
Why it Matters |
Key Tech/Enablers |
Who Benefits / Should Act |
|
Fermentation- and algae-based pigments |
Pigments produced by microbes (such as yeast and bacteria) and microalgae (such as spirulina and chlorella) instead of crop extraction |
Scalable, less land-dependent supply. Reduces seasonality and climate risk. |
downstream purification, fermentation bioreactors, and strain engineering. |
Ingredient producers (invest in bioprocessing), large CPGs (stable supply), regulators (safety frameworks). |
|
Natural blues become mainstream |
Blues from phycocyanin or other algal/microbial sources are more widely used. |
Blue was historically hard for naturals. Stable blues unlock many beverage and confectionery SKUs. |
Food-grade purification, microencapsulation and stabilizing complexes (protein/polysaccharide). |
Beverage and confectionery brands, specialty ingredient houses, and formulators. |
|
Functional/bioactive colour systems |
Colorants are marketed for appearance and health (antioxidant, vitamin precursors). |
Adds product differentiation and “better-for-you” claims; premium pricing possible. |
Standardized extract profiling, clinical/efficacy studies, and validated bioactivity assays. |
Nutraceutical brands, premium CPG, and marketing teams |
|
Sustainability, traceability & circular sourcing |
Green extraction, waste-to-pigment (valorisation) models, and Traceable supply chains. |
Consumers demand ethics and low footprint; procurement risk reduces through traceable sourcing. |
Blockchain/provenance systems, upcycling tech, and solvent-free extraction. |
Procurement teams, sustainability leads, and retailers (label claims). |
|
Advanced stabilization & delivery (formulation engineering) |
Improved pigment stability for heat, pH, and light via encapsulation and novel carriers. |
Enables the use of naturals in applications previously dominated by synthetics (baked goods, acidic drinks). |
Protein-inorganic hybrids, micro-/nano-encapsulation, polysaccharide matrices, and AI-led formulation design. |
Research and development teams, ingredient suppliers (value-added SKUs), and contract manufacturers. |
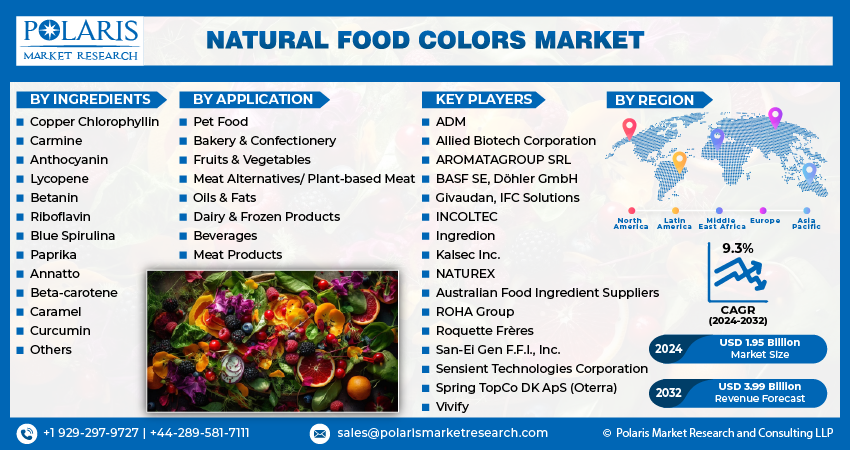
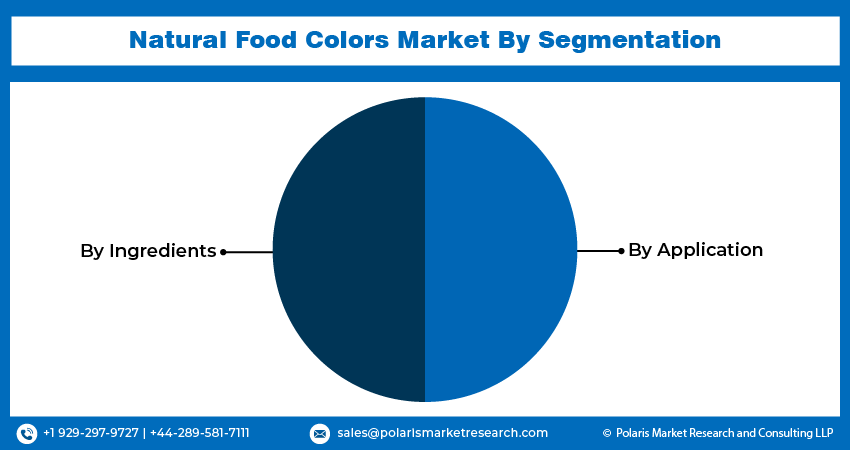
Report Segmentation
The market is primarily segmented based on ingredients, application, and region.
|
By Ingredients |
By Application |
By Region |
|
|
|
To Understand the Scope of this Report: Speak to Analyst
Natural Food Colors Market
The Beta-Carotene Segment Held the Largest Revenue Share in 2024
The surge in beta-carotene's popularity can be attributed to its natural origin, positioning it as a safer option compared to synthetic alternatives. As a natural pigment and antioxidant present in various vegetables, algae, fruits, and yeast, beta-carotene, belonging to the carotenoid family, alongside pigments like lycopene and lutein, has gained prominence in the food industry.
Recognized for its dual role as a natural food colorant and nutritional supplement, beta-carotene occurs organically in fruits and vegetables such as cantaloupe, sweet potatoes, carrots, and apricots, imparting their distinctive yellow or orange tint. Its appealing color properties make beta-carotene well-suited for incorporation into dairy products, margarine, cheese, soft drinks,salad dressings, and energy drinks.
Moreover, heightened consumer awareness of the potential health impacts of artificial colorants has led to a growing demand for additive-free foods and beverages. In response, many market players are investing in extraction and stabilization technologies to provide naturally sourced food colors, aligning with the increasing consumer preference for more natural options in their food selections.
The blue spirulina segment is poised to demonstrate the highest Compound Annual Growth Rate (CAGR) throughout the forecast period. Extracted from the blue-green algae Arthrospira platensis, blue spirulina is a vivid blue pigment that has gained substantial popularity in the food and beverage industry as a secure and natural substitute for synthetic food dyes. The market for blue spirulina is being propelled by a favorable regulatory landscape and an increasing demand for plant-based diets.
For instance, In November 2022, GNT, a leading color supplier, received official approval from the U.S. Food and Drug Administration (FDA) to employ spirulina extract as a natural food colorant in beverages. This regulatory endorsement presents promising opportunities for manufacturers, enabling them to infuse vibrant blue hues into their products while upholding their clean-label status.
This approval opens avenues for the utilization of spirulina extract in diverse beverage applications, encompassing sports drinks, juice beverages, and alcoholic drinks. GNT has also pioneered an innovative and patented formulation technology ensuring the stability of the extract, further augmenting its appeal among food and beverage manufacturers.
By Application Analysis
The Beverages Segment Accounted for the Highest Market Share During the Forecast Period
The escalating consumer inclination toward healthier and natural choices is propelling the adoption of natural food colors in the beverage sector. With heightened awareness of potential health risks linked to artificial food colors, including allergies and hyperactivity in children, consumers are increasingly seeking beverages that incorporate natural and safe food colors.
In response to this demand, key players in the natural food colors market are proactively launching new products and implementing diverse strategies. For instance, in September 2022, Sun Chemical introduced SUNFOODS Natural Colorants, a collection of natural colorants for food and beverages, showcased at the Supply Side West event in Las Vegas. These colorants, sourced from vegetables, algae, and fruits, are suitable for a range of applications such as bakery, dairy, pet food, and confectionery. This initiative underscores the industry's commitment to delivering natural and clean-label products in alignment with evolving consumer preferences.
The meat alternative/plant-based meat sector demonstrated a CAGR throughout the forecast period. In response to consumer preferences for healthier and sustainable food options, plant-based meats have emerged as a compelling alternative to conventional meat products. Natural food colors, sourced from plants like fruits, vegetables, and algae, play a crucial role in replicating the appearance of real meat, enhancing the visual appeal and appeal of plant-based meats.
For instance, In May 2023, GNT introduced Exberry Compound Red, a novel plant-based natural food concentrate designed to impart a brownish hue to red meat alternatives when grilled or fried. Crafted from carrots and vegetable oil, this ingredient is recognized for its clean-label attributes. The Exberry Compound Red series features two distinct shades, Autumn Red and Fall Forest Red, providing versatility in creating various browned meat colors. Notably, this compound is user-friendly and brings about a color transformation in meat analogs when subjected to heat.
Regional Insights
Europe Dominated the Largest Market in 2024
The surge in European consumers' inclination towards natural, straightforward, and recognizable ingredients stands as a key catalyst propelling the expansion of the natural food colors industry in the region. With an increasing awareness of dietary choices, consumers actively seek healthier snack alternatives featuring all-natural components, particularly within the snack industry. The demand for products bearing labels such as "no additives or preservatives," "GMO-free," "whole grain," or "all-natural" is witnessing a notable rise, reflecting consumers' desire for assurance regarding the quality and healthiness of their food selections. Responding to this shift, food manufacturers are incorporating natural food colors sourced from fruits, vegetables, and plant extracts to align with consumer preferences, leading to substantial market growth.
The Asia Pacific natural food colors market is anticipated to experience the fastest CAGR. Within the Asia Pacific region, the food and beverage industry is actively engaging in innovation as companies strive to distinguish themselves in a competitive market. Natural food colors have emerged as a valuable tool for manufacturers in their pursuit of differentiation and have established a solid presence in the food and beverage sector.
Additionally, regulations like the T/CNFIA 101-2017 on Coloring Foods, issued by the China National Food Industry Association, have exerted a significant impact on the natural food colors market in the country. The stringent criteria set forth in the standard mandate that colorants used in food products must be sourced exclusively from natural and edible raw materials, such as plants, fruits, vegetables, and algae. Moreover, the use of organic solvent extraction for pigment extraction is prohibited, with colorants required to be obtained solely through physical processes.
Key Market Players & Competitive Insights
The market is characterized by intense competition, with established players relying on advanced technology, high-quality products, and a strong brand image to drive revenue growth. These companies employ various strategies such as research and development, mergers and acquisitions, and technological innovations to expand their product portfolios and maintain a competitive edge in the market.
Some of the major players operating in the global market include:
- ADM
- Allied Biotech Corporation
- AROMATAGROUP SRL
- Australian Food Ingredient Suppliers
- BASF SE
- Döhler GmbH
- Givaudan
- IFC Solutions
- INCOLTEC
- Ingredion
- Kalsec Inc.
- NATUREX
- ROHA Group
- Roquette Frères
- San-Ei Gen F.F.I., Inc.
- Sensient Technologies Corporation
- Spring TopCo DK ApS (Oterra)
- Vivify
Recent Developments
- June 2025: The Kraft Heinz Company pledged to remove FD&C artificial colors from its U.S. portfolio, stop new products with synthetic dyes, and complete the shift to natural colors by end of 2027, marking a major industry move.
- In May 2025, the FDA approved three natural color additives—Galdieria extract blue, butterfly pea flower extract, and calcium phosphate—marking a shift away from petroleum-based dyes and expanding safe, plant-based options for food manufacturers.
- In July 2022, Symrise AG, has introduced an emollient endowed with antimicrobial properties, providing skin protection from head to toe. In addition to various functions, this ingredient plays a role in supporting concepts for dandruff control. It is also effective in skincare products designed for individuals with acne-prone and oily skin.
- In June 2022, Symrise AG, has established a facility in Grasse to strengthen its presence in natural raw materials, particularly for Maison Lautier 1795. This facility will complement the company's existing factories in Holzminden, Germany, and Madagascar.
Natural Food Color Market Report Scope
|
Report Attributes |
Details |
|
Market size value in 2025 |
USD 2.28 billion |
|
Revenue forecast in 2034 |
USD 4.7 billion |
|
CAGR |
8.40% from 2025 – 2034 |
|
Base year |
2024 |
|
Historical data |
2020 – 2023 |
|
Forecast period |
2025 – 2034 |
|
Quantitative units |
Revenue in USD billion and CAGR from 2025 to 2034 |
|
Segments Covered |
By Ingredients, By Application, By Region |
|
Regional scope |
North America, Europe, Asia Pacific, Latin America, Middle East & Africa |
|
Customization |
Report customization as per your requirements with respect to countries, region, and segmentation. |
FAQ's
Natural Food Colors Market report covering key segments are ingredients, application, and region
Natural Food Color Market Size Worth $ 4.7 Billion By 2034.
The global Natural Food Color market is expected to grow at a CAGR of 8.40% during the forecast period.
Europe is leading the global market.
The key driving factors in Natural Food Colors Market are Increasing consumer awareness about distinguishing products
Page last updated on:
Jan-2023
Research Methodology
A robust system of research, verification, and forecasting designed to ensure reliable and actionable market insights.
Polaris Market Research uses a clear and structured approach to deliver insights that clients can rely on. The process combines detailed primary and secondary research, including direct communication with industry experts. The detailed information helps build a complete picture of market trends and developments. Secondary data is gathered from credible sources such as industry reports, company filings, government source links, and trusted organization databases. It is then cross-checked through discussions with key stakeholders across the value chain. Market size and forecasts are developed using both bottom-up and top-down methods to ensure accuracy and consistency in the final results.

Project Setup
Step 1 & 2:
- We start every project by clearly understanding the client’s objective or goal, then defining the market scope, and aligning regions, segments, and timelines.
- Once the foundation is set, we collect data from all-around of sources, including company reports, government databases, and paid industry platforms.
- Our research is based on secondary data, which helps us build a strong understanding of the market across regions and industries. Then we validate this information through primary research by speaking directly with industry experts, companies, and stakeholders.
- By combining secondary and primary research, we ensure that our market insights are accurate, practical, and closely aligned with real market conditions.
Data Collection
We gather information from both public and verified sources:

Data Structuring
Step 3:
- All collected data is organized into a consistent format to ensure accurate analysis. Since inputs come from multiple sources, they are standardized and aligned before use.
- The data is segmented by product, application, and region, and mapped across a defined historical period (2020–2024). All values are converted into common units (USD Mn/Bn), and volume and pricing are aligned where required to estimate revenue.
- Any overlaps or inconsistencies are reviewed and adjusted to maintain accuracy (<5% variance threshold).
- The result is a structured dataset that allows for clear comparison across regions and supports reliable analysis and forecasting.
Structured Market Dataset, USD Mn/Bn

4. Data Structuring
Step 4: TOP-DOWN APPROACH
- We start with the overall market size at a global or macro level.
- The market is then narrowed down based on scope and industry relevance.
- We apply penetration rates and split the data by region and segment.
- This helps us estimate the market size for specific segments.
- The numbers are validated through cross-checks to ensure accuracy.

Step 5: BOTTOM-UP APPROACH
- We begin by analyzing data from leading companies in the market.
- Revenue data is collected and mapped across different segments.
- The data is then aggregated to estimate the total market size.
- To fill in any gaps, adjustments are made based on industry standards.
- Validation checks make sure that the results are correct.

5. Data Structuring
Step 6:
At Polaris Market Research, we employ a methodical forecasting strategy. This approach blends the analysis of historical data with real-time market validation. To forecast future trends with precision, we examine past patterns, pricing fluctuations, and the interplay of supply and demand. To ensure our conclusions reflect the present market landscape, we actively seek input from industry experts and key stakeholders.
To refine our predictions, we carefully consider critical elements such as market drivers and restraints, fluctuations in raw material costs, emerging technologies, and the production capabilities of various regions. Furthermore, we assess regulatory frameworks and potential policy shifts to gauge their potential impact on market expansion.
All this information is synthesized to generate precise forecasts for each segment and region. These forecasts illuminate the current state of the market and highlight forthcoming opportunities.

6. Data Structuring
Step 7:
In the final stage, we validate all our estimates using a triangulation method, where data is cross-checked from multiple reliable sources, like company data, primary interviews, and secondary research. This helps us make sure that our numbers are correct and fit with the rest of the market.
This process involves verifying data consistency across various segments and geographic areas. It also requires comparing historical trends with the assumptions support the forecast. Any discrepancies involve adjustments to ensure everything remains aligned and dependable.
Once the data is finalized, we prepare the final outputs, including market size estimates, segment-wise breakdowns, and growth metrics. These are delivered in structured formats such as tables, charts, and data files for easy analysis and use.
We collaborate closely with clients, ensuring the final products align with their requirements. This includes offering tailored adjustments, supplementary data analyses, and continuous assistance. Furthermore, we monitor market trends post-delivery, providing updates and refinements to maintain the insights' relevance as time passes.
Post-delivery, we continue to monitor market shifts, offering updates and adjustments to ensure the insights remain relevant over time.
Validation
Triangulation Framework
- Company-level data
- Primary inputs from industry participants
- Secondary benchmarks and published data
- Variance maintained within ±5-10%
- Adjustments applied to align estimates
- Segment values validated against overall market structure
Quality Check
Data Consistency & Integrity
- Segment totals validated to 100%
- Regional estimates aligned with global market size
- Historical trends compared against forecast outputs
- Assumptions reviewed for cross-segment and regional alignment
Output & Delivery
Final Outputs
- Market size estimates (USD Mn/Bn)
- Segment-wise distribution (%)
- Growth metrics (CAGR %)
- Structured tables and charts
- Segment-level datasets
- Excel-based data files for further analysis
Client Alignment & Support
- Deliverables are aligned with defined client requirements and scope
- Custom data cuts and segment splits are incorporated as required
- Post-delivery queries are addressed through analyst interactions
- Additional clarifications and data support are provided upon request
Client Continuity & Updates
- Market developments are tracked post-delivery to capture changes in key trends
- Updated data and revisions are provided based on new market inputs
- Additional refinements and data cuts are shared as required
- Continued analyst engagement supports evolving client requirements
