
North America Automated Test Equipment Market Size, Share Research Report, 2026-2034
REPORT DETAILS
Market Statistics
What is the Current Market Size?
The North America automated test equipment market size was valued at USD 8.47 Billion in 2025 and is expected to grow at a CAGR of 7.60% during the forecast period.
Market Statistics
- 2025 Market Size: USD 8.47 billion
- 2034 Projected Market Size: USD 16.20 billion
- CAGR (2026-2034): 7.60%
- U.S.: Largest market in 2025
Automatic Test Equipment (ATE) is widely used for testing circuits and devices in modern electronics. This technology is crucial for detecting faults in printed circuit boards found in electronic and electrical equipment. Primarily, ATE processes are known for their efficiency and speed, outperforming manual testing methodologies in terms of time.
The automated test equipment market in North America is witnessing substantial growth owing to various factors such as the demand for higher test accuracy and throughput, the surging complexity and miniaturization of electronic devices, and an increasing demand for quality assurance in numerous industries.
Source: Polaris Market Research Analysis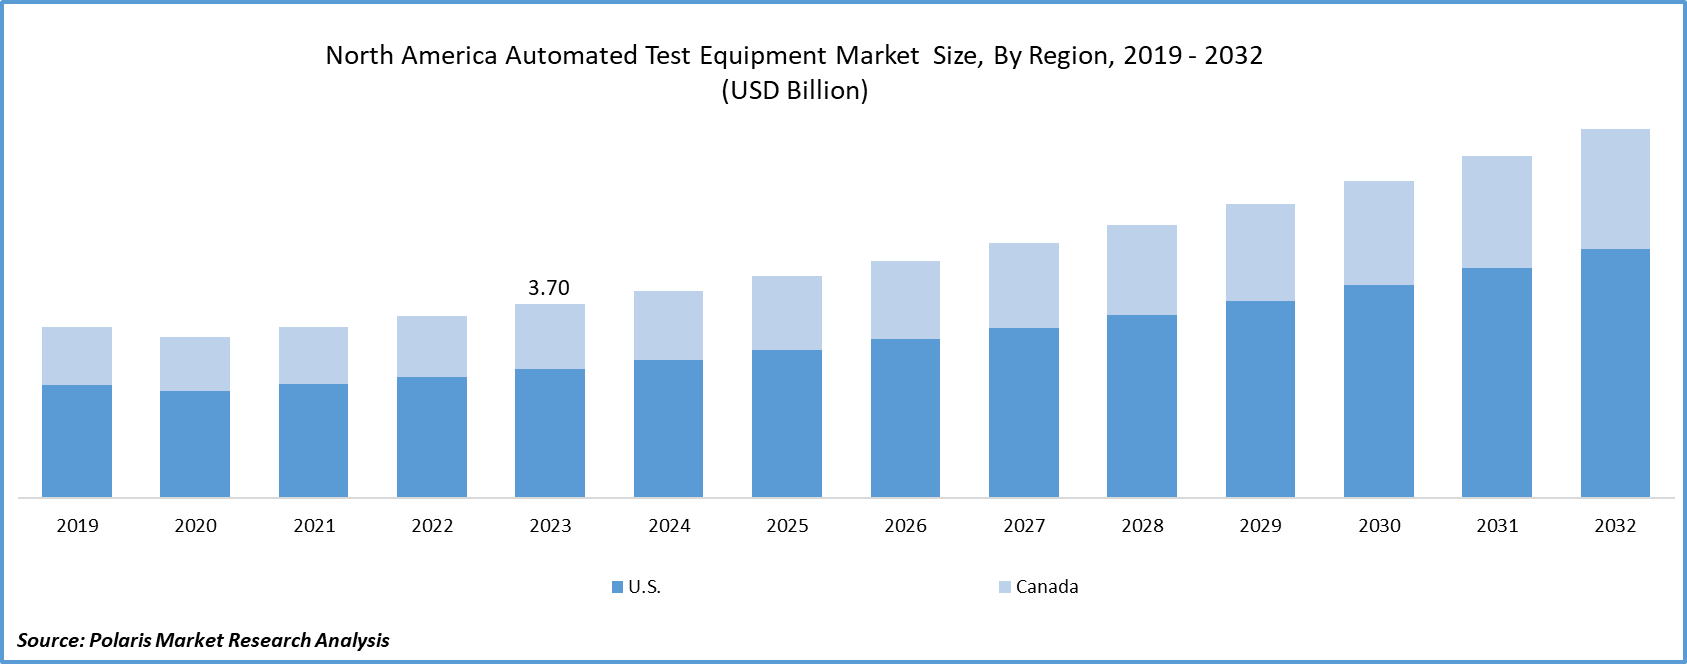
To Understand More About this Research: Download Sample Report
The adoption of the Internet of Things and industry 4.0 principles has expedited to the increased automation and connectivity in the manufacturing processes. Automated test equipment systems are combined into an IoT-enabled production lines, sanctioning real-time monitoring, smart factories, intelligent testing, and data analysis.
The COVID-19 pandemic has had a significant impact on the North America automated test equipment market. The outbreak disrupted the global supply chain, causing delays in the production and deployment of ATE solutions. Economic uncertainty and virus-control measures resulted in a temporary drop in demand for ATE across a variety of industries, including electronics and semiconductor manufacturing.
Companies faced challenges with workforce availability, logistics, and project timelines. The ATE market is anticipated to rebound as the region gradually recovers from the pandemic and industries alter to the normal. The increasing focus on automation, digital transformation, and the growing demand for advanced testing technologies are likely to propel the post-pandemic recovery and growth of the North america automated test equipment market.
The market research report offers an in-depth analysis of the industry to support informed decision-making. It offers a meticulous breakdown of various market niches and keeps readers updated on the latest industry developments. Along with tracking the north america automated test equipment market on the basis of SWOT and Porter’s Five Forces models, the research report includes graphs, tables, charts, and other pictorial representations to help readers understand the key insights and important data easily.
Source: Polaris Market Research Analysis
Get Full Segment-Level Forecasts & Insights: Download Sample Report
Growth Drivers
The enhancements in the semiconductor technology will drive the growth of the market
The improvements in semiconductor technology will drive the growth of the North america automated test equipment market. The semiconductor industry is persistently growing, with manufacturing processes, advancements in chip design, and packaging technologies. Automated test equipment systems play an essential role in validating and testing semiconductor components which are utilized to assuring their performance and functionality.
The adoption of advanced technologies like machine learning, and artificial intelligence, will also bolster the market’s growth, these technologies facilitate smarter testing processes, allowing for faster and more accurate detection of defects and performance issues in semiconductor devices. Furthermore, there has been a significant shift toward the development of ATE systems that are capable of meeting the testing requirements of advanced semiconductor nodes, such as smaller process geometries and higher device densities.
CHIPS Act & Supply Chain Security Matrix
| Year | Policy / Funding Mechanism | Funding / Value (USD) | Admin agency | Supply-chain / security intent (what it protects) | Direct relevance to semiconductor manufacturing equipment (incl. ATE) |
| 2022 | CHIPS & Science Act | “Nearly USD 53B” federal semiconductor support (CHIPS manufacturing + R&D) | U.S. Dept. of Commerce / NIST + others | Expands domestic semiconductor production + R&D capacity to reduce geopolitical and single-region concentration risk | Triggers U.S. fab + packaging buildouts (each new fab/ATP line pulls major demand for test capacity and ATE across wafer sort + final test) |
| 2024 | CHIPS NAPMP (National Advanced Packaging Manufacturing Program)- NOFOs | Example: USD 300 M finalized under first NOFO (advanced substrates/materials) | NIST / CHIPS R&D Office | Secures U.S. advanced packaging capability (a critical chokepoint for supply security) | Advanced packaging increases test intensity (chiplets, SiP, HBM stacks - more known-good-die, interconnect test, SLT), boosting ATE pull-through |
| 2024 | CHIPS Incentives-Micron preliminary terms | Up to USD 6.14 B proposed direct funding | U.S. Dept. of Commerce | Onshoring leading-edge memory manufacturing to reduce external dependence | Major U.S. memory expansion implies substantial wafer sort + final test capacity additions and ongoing ATE procurement cycles |
| 2024 | CHIPS Incentives-Samsung preliminary terms | Up to USD 6.4 B proposed direct funding | U.S. Dept. of Commerce | Leading-edge ecosystem + packaging/R&D cluster (Texas) for supply security | New logic + advanced packaging ecosystem increases test floorspace, SLT, and packaging-test integration demand |
| 2024 | CHIPS Incentives-Intel preliminary terms | Up to USD 8.5B proposed direct funding (plus potential loans referenced by NIST release) | U.S. Dept. of Commerce / CHIPS Program Office | Restores domestic leading-edge manufacturing scale | Multiple U.S. fab builds materially expand installed base requiring high-volume ATE across compute/AI, networking, and advanced packaging flows |
| 2024 | CHIPS Incentives-TSMC award (NIST version) | - | NIST / CHIPS for America | Tracks progress of allocated/awarded incentives | Provides public signal of scale/timing of capacity ramps, useful to forecast ATE shipment cycles tied to fab start/ramp |
Source: Polaris Market Research Analysis
Report Segmentation
The market is primarily segmented based on type, component, end-user, and country.
| By Type | By End-User | By Country |
|
|
|
Source: Polaris Market Research Analysis
To Understand the Scope of this Report: Request Customization
By Type Analysis
The non-memory ATE segment accounted for the largest market share in 2025
The non-memory ATE segment held the largest market share in the North america automated test equipment market. The latest innovations in autonomous vehicles and IoT devices as well as substantial advancements in the aerospace and defense sectors. Key players are concentrating on enhancing customer satisfaction by providing excellent product quality and less testing cost.
The memory ATE segment has witnessed for the fastest growth in the North america automated test equipment market, owing to the surging demand for a memory device in the numerous applications like automotive electronics, data centers, and phones. Memory ATE systems are designed specifically for evaluating memory chips and verifying their operational integrity, dependability, and efficiency.
By End-Use Analysis
The automotive segment accounted for the largest market share in 2025
The automotive segment held the largest market share in the North america automated test equipment market, owing to the surging demand for driver safety and vehicle diagnosis features which raises the durability of the vehicle. The increasing integration of electronics in vehicles, combined with stringent emission standards and the need for faster diagnosis, has resulted in an increase in demand for equipment, software, and repair data.
The aerospace and defense segment witnessed the fastest growth in the North america automated test equipment market. Safety is a pivotal parameter in the aerospace industry. It is critical to ensure safety and quality, and having a reliable and cutting-edge testing system is essential. Because aircraft incorporate a wide range of systems, including communication, navigation, and military applications, it is critical to thoroughly test each electronic component to ensure optimal performance and safety standards.
Source: Polaris Market Research Analysis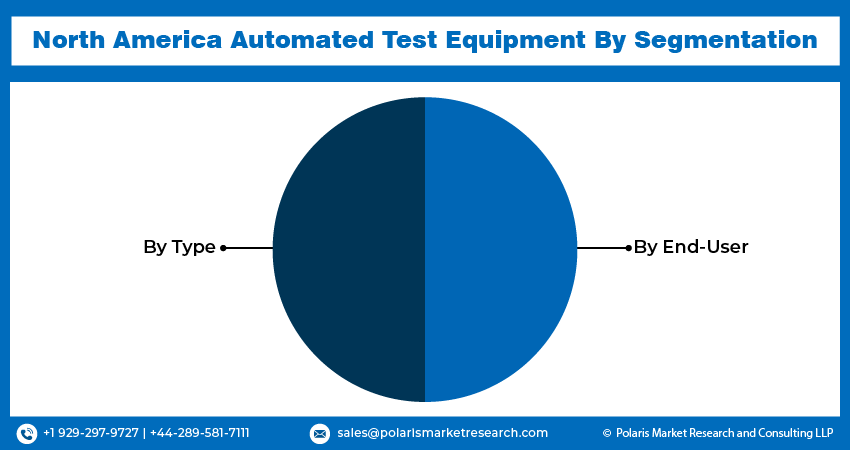
Need Granular Data Across All Market Segments? Request Customization
Country Insights
U.S. dominated the automated test equipment market in terms of revenue share in 2025
The U.S. dominated the automated test equipment market. In the United States, mainly three states are dominating in the process of automation namely Austin, Detroil, and Boston. These locations have risen to prominence as the country's leading robotics development centers. Boston Dynamics' creation of Atlas, a humanoid robot, was a remarkable achievement in the field of robotics, particularly in Boston. This accomplishment is expected to fuel growth in the automation test equipment market.
Companies across the region are increasing the test coverage of their enterprise application suites by leveraging Automated Test Equipment (ATE) in response to escalating cybersecurity threats and increasing application complexity. The primary driver of the ATE market in the United States is the rising demand for low-cost consumer goods, as well as a consistent increase in the adoption of semiconductor industry technologies.
Source: Polaris Market Research Analysis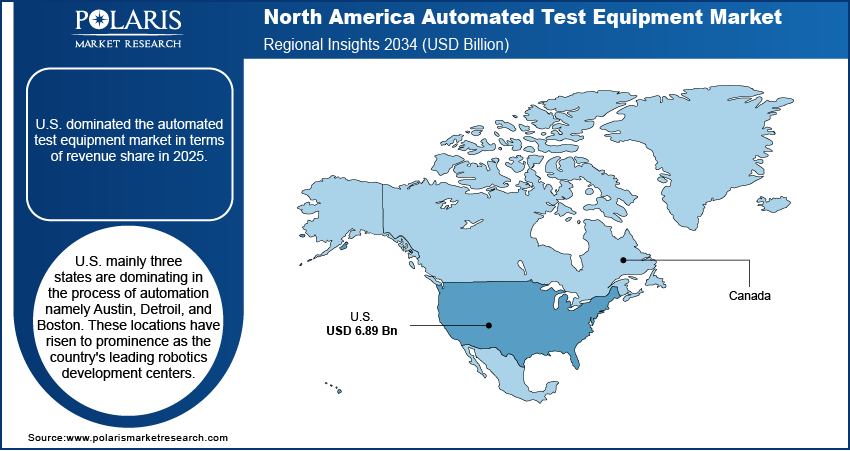
Curious About Regional Market Performance? Request Customization
Key Market Players & Competitive Insights
The North america automated Test equipment market is highly competitive, with several prominent players varying for market share. Leading manufacturers such as Aeroflex, Inc., Chroma ATE Inc., Danaher Corporation, LTX-Credence Corporation, National Instruments Corporation, Roos Instruments, Inc., STAr Technologies, Inc., Teradyne, Inc., Virginia Panel Corporation, Xcerra Corporation are also present in the region.
Some of the major players operating in the North America Automated Test Equipment Market include:
- Aeroflex, Inc.
- Chroma ATE, Inc.
- Danaher Corporation
- LTX-Credence Corporation
- National Instruments Corporation
- Roos Instruments, Inc.
- STAr Technologies, Inc.
- Teradyne, Inc
- Virginia Panel Corporation
- Xcerra Corporation
Recent Developments
- In April 2023, STAr technologies launched the latest 3D/2.5D MEMS micro-cantilever probe card developed to provide reliable Wafer Acceptance Test (WAT) results. This advanced probe card offers excellent physical characteristics, especially improving testing efficiency.
- In October 2022, Chroma ATE Inc. introduced the advanced Chroma 3650-S2, an innovative testing platform designed for high-performance power ICs. Specifically tailored for evaluating batteries, power management ICs (PMICs), and power conversion components, this automated testing equipment sets a new benchmark in precision testing.
North America Automated Test Equipment Market Report Scope
| Report Attributes | Details |
| Market Size Value in 2025 | USD 8.47 Billion |
| Market Size Value in 2026 | USD 9.04 Billion |
| Revenue Forecast in 2034 | USD 16.20 Billion |
| CAGR | 7.60% from 2026 – 2034 |
| Base Year | 2025 |
| Historical Data | 2021 – 2024 |
| Forecast Period | 2026 – 2034 |
| Quantitative Units | Revenue in USD Billion, and CAGR from 2026 to 2034 |
| Segments Covered | By Type, By End-User, By Country |
| Country Scope | U.S., Canada |
| Customization | Report customization as per your requirements concerning countries, regions, and segmentation. |
Source: Polaris Market Research Analysis
Explore the landscape of North america automated test equipment in 2025 through detailed market share, size, and revenue growth rate statistics meticulously organized by Polaris Market Research Industry Reports. This expansive analysis goes beyond the present, offering a forward-looking market forecast till 2034, coupled with a perceptive historical overview. Immerse yourself in the depth of this industry analysis by acquiring a Download Sample Report.
North America Automated Test Equipment Market FAQ's
The North America Automated Test Equipment Market report covering key segments are type, end user and country.
North America Automated Test Equipment Market Size Worth USD 16.20 Billion By 2034
The north america automated test equipment market is expected to grow at a CAGR of 7.60% during the forecast period.
Key players in the market are Aeroflex, Inc., Chroma ATE Inc., Danaher Corporation, LTX-Credence Corporation, National Instruments Corporation
key driving factors in North America Automated Test Equipment Market are rising demand for consumer electronics will bolster the growth of the market
Download Sample Report of North America Automated Test Equipment Market
Please fill out the form to request a customized copy of the research report.
