
North America Automotive Sensors Market Size Report, 2026-2034
REPORT DETAILS
Market Statistics
What is North America Automotive Sensors Market Size?
The North America automotive sensors market was valued at USD 17.46 Billion in 2025 and is expected to grow at a CAGR of 20.6% during the forecast period.
Market Statistics
- 2025 Market Size: USD 17.46 Billion
- 2034 Projected Market Size: USD 94.52 Billion
- CAGR (2026-2034): 20.6%
- Largest Market: U.S.
Automotive sensors are critical components in vehicles, detecting, transmitting, analyzing, recording, and presenting data about vehicle performance in both internal and external environments. In North America, it indicates a significant increase in demand for automotive sensors, driven by the increasing prevalence of vehicle automation and a growing desire for connected cars.
The North American automotive sensors market is fragmented due to the presence of multiple industries, and the competitive landscape is anticipated to shift in the coming years. Furthermore, governmental bodies are actively implementing various initiatives to propel the growth of the automotive sensors market in North America.
Source: Polaris Market Research Analysis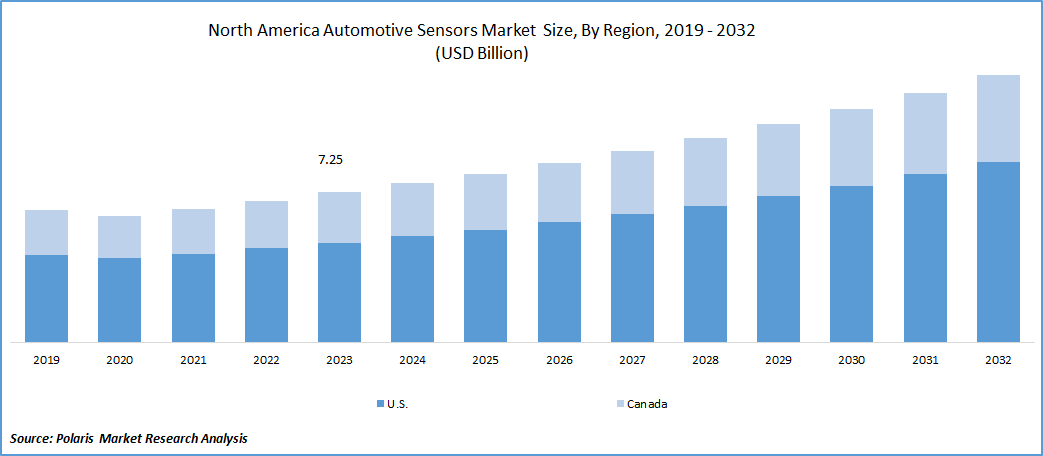
To Understand More About this Research: Download Sample Report
The governments in the United States, and Canada have launched a variety of initiatives aimed at encouraging and enticing investment in their respective automobile component manufacturing sectors. One example is the Automobile Innovation Fund Program, which was established in 2008 to assist automotive companies by allocating funds for research and development. This financial assistance facilitates the development of innovative technologies that improve vehicle fuel efficiency.
The COVID-19 pandemic has significant impact on the north america automotive sensors market. With widespread lockdowns, supply chain disruptions, and economic uncertainty, the automotive industry in North America witnessed a sharp decline in production. This downturn had a direct impact on demand for automotive sensors, which are used in modern vehicles for functions such as advanced driver assistance systems, engine management, and environmental monitoring. Automakers encountered difficulties obtaining necessary components, resulting in production delays and a temporary drop in sensor installations in North America.
However, the pandemic has accelerated certain automotive industry developments, such as the growing interest in electric vehicles and the integration of smart and connected technologies. As the industry adapts to the new normal, there is a greater emphasis on improving vehicle safety and efficiency, which is driving demand for sensors related to autonomous driving, collision avoidance, and in-cabin monitoring.
Growth Drivers
Utilization of commercial vehicles, will drive the growth of the market
The usage of commercial vehicles will drive the growth of the market in the north america automotive sensors market. The construction and transportation sectors in the United States are currently experiencing significant growth, resulting in an increased demand for heavy commercial vehicles. As a result, many truck fleet owners and operators are choosing to invest in improvements that will improve both fuel efficiency and overall driving comfort.
Autonomous braking systems, lane-keeping assist, and adaptive cruise control systems are becoming more common in commercial vehicles in north america region. Trucks in the United States are expected to use Advanced Driver Assistance Systems (ADAS) and connectivity technology for commercial applications in construction and transportation. This trend is expected to contribute to a greater integration of ADAS sensors in the north america automotive industry.
Key Trends in Automotive Sensors
| Trend | Description |
| Sensor Fusion | Multi-sensor integration (LiDAR, radar, cameras) using AI like Transformers for robust environmental perception. |
| Solid-State LiDAR | Compact, durable, affordable versions without moving parts for mass-market ADAS and L3+ autonomy. |
| EV-Specific Sensors | Battery monitoring (current, temperature, pressure), regenerative braking, and thermal management for electrified powertrains. |
| Edge AI Processing | On-sensor AI reduces latency for real-time decisions in predictive maintenance and V2X communication. |
| 4D Imaging Radar | Enhanced radar providing velocity, elevation, and precise object detection in adverse weather. |
| MEMS Advancements | Miniaturized, low-cost micro-electro-mechanical systems for inertial, pressure, and gas sensing. |
| V2X Connectivity | Wireless sensors enabling vehicle-to-everything for traffic, fleet management, and OTA updates. |
| Cybersecurity Focus | Secure, upgradable sensors compliant with regulations amid connected ecosystems. |
Source: Polaris Market Research Analysis
Source: Polaris Market Research Analysis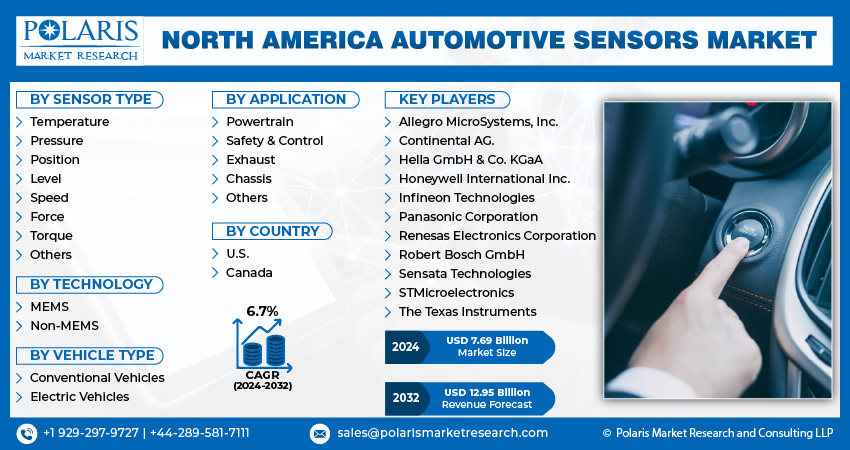
Get Full Segment-Level Forecasts & Insights: Download Sample Report
Report Segmentation
The market is primarily segmented based on sensor type, technology, vehicle type, application, and country.
| By Sensor Type | By Technology | By Vehicle Type | By Application | By Country |
|
|
|
|
|
Source: Polaris Market Research Analysis
To Understand the Scope of this Report: Request Customization
By Sensor Type Analysis
The pressure sensor segment accounted for the largest market share in 2025
The pressure sensor segment held the largest market share in the automotive sensors market in North America. The need for real-time tire pressure monitoring, as well as the growing preference for fuel-efficient automobiles, are driving demand for pressure sensors in North America. These sensors are critical in reducing fuel consumption and carbon emissions, thereby improving vehicle fuel economy.
The temperature sensor segment witnessed for the fastest growth in the north america automotive sensors market. These sensors are needed in monitoring engine oil temperature, fuel temperature, transmission fluid temperature, exhaust gas temperature, ensure reliable vehicle engine, and coolant water temperature.
By Application Analysis
The powertrain segment accounted for the largest market share in 2025
The powertrain segment held the largest market share in the north america automotive sensors market. The engine, transmission, and other components that generate and deliver power to the wheels comprise the powertrain, which heavily relies on sensors to monitor and control various parameters. These sensors provide real-time data on engine temperature, RPM (revolutions per minute), fuel injection, and transmission shift points, among other things. These sensors contribute to meeting stringent environmental regulations and fuel economy standards in the United States, in addition to improving the driving experience.
Powertrain sensors improve fuel efficiency by continuously monitoring key vehicle parameters such as temperature and pressure and transmitting critical data to the engine control unit. As a result, these elements are critical in achieving improved fuel economy.
Source: Polaris Market Research Analysis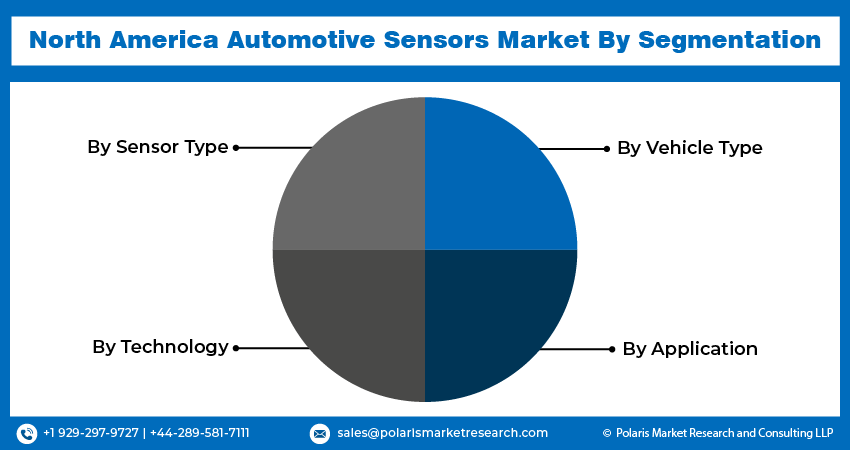
Need Granular Data Across All Market Segments? Request Customization
Country Insights
U.S. dominated the automotive sensors market in 2025
U.S. dominated the automotive sensors market. The United States is expected to lead the North American automotive sensors market throughout the forecast period. This is due to the presence of major automotive groups in the country, as well as the presence of some of the most important semiconductor manufacturers.
Numerous automotive manufacturers have engine and transmission plants in the United States, where they also conduct design, research and development (R&D), and testing. According to the Auto Alliance, the automotive sector in the United States receives nearly 20% of global R&D investments. The growing demand for infotainment systems, combined with a greater emphasis on vehicle safety, communication, and comfort, is driving the increased demand for semiconductors in the automotive industry.
Source: Polaris Market Research Analysis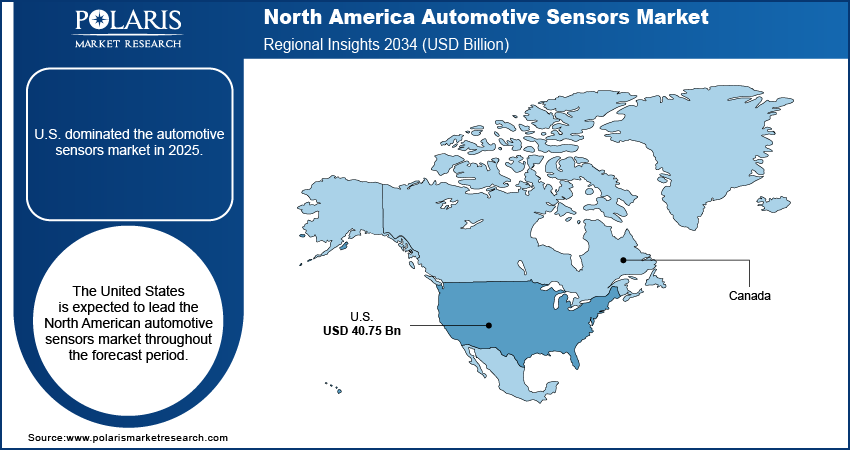
Curious About Regional Market Performance? Request Customization
Key Market Players & Competitive Insights
The North America Automotive Sensors market is highly competitive, with several prominent players varying for market share. Leading manufacturers such as Aeroflex, Inc., Chroma ATE Inc., Danaher Corporation, LTX-Credence Corporation, National Instruments Corporation, Roos Instruments, Inc., STAr Technologies, Inc., Teradyne, Inc., Virginia Panel Corporation, Xcerra Corporation are also present in the region.
Some of the major players operating in the North America Automotive Sensors Market include:
- Allegro MicroSystems, Inc.
- Continental AG.
- Hella GmbH & Co. KGaA
- Honeywell International Inc.
- Infineon Technologies
- Panasonic Corporation
- Renesas Electronics Corporation
- Robert Bosch GmbH
- Sensata Technologies
- STMicroelectronics
- The Texas Instruments
Recent Developments
- May 2025: Bosch unveiled the AI-based MPC3 multifunctional camera at CES 2025, combining classic image processing with AI to detect objects and people and support lane-keeping.
- April, 2025: Mercedes-Benz signed an agreement with Luminar to co-develop and integrate next-gen Halo lidar sensors, Halo’s first development contract and a potential step toward a supply deal.
- February, 2024: Luminar’s shares fell about 10% after Q4 results missed expectations due to delays in Volvo EX90 SUV production.
- June 2022, Allegro Microsystems Inc. has launched the A33110 and A33115 magnetic position sensors, which are intended for use in advanced driver assistance systems (ADAS).
- May 2022, Infineon Technologies AG has launched the XENSIV 60 GHz radar sensor which were designed for automotive use.
North America Automotive Sensors Market Report Scope
| Report Attributes | Details |
| Market size in 2025 | USD 17.46 Billion |
| Market size in 2026 | USD 21.05 Billion |
| Revenue Forecast in 2034 | USD 94.52 Billion |
| CAGR | 20.6% from 2026 – 2034 |
| Base year | 2025 |
| Historical data | 2021 – 2024 |
| Forecast period | 2026 – 2034 |
| Quantitative units | Revenue in USD Billion, and CAGR from 2026 to 2034 |
| Segments Covered | By Sensor Type, By Technology, By Vehicle Type, By Application, By Country |
| Country scope | U.S., Canada |
| Customization | Report customization as per your requirements concerning countries, regions, and segmentation. |
Source: Polaris Market Research Analysis
North America Automotive Sensors Market FAQ's
The North America Automotive Sensors Market report covering key segments are sensor type, technology, vehicle type, application, and country.
The north america automotive sensors market size is expected to reach USD 94.52 Billion by 2034
The north america automotive sensors market is expected to grow at a CAGR of 20.6% during the forecast period.
U.S regions is leading the global market
Utilization of commercial vehicles, will drive the growth of the market are the key driving factors in North America Automotive Sensors Market.
Download Sample Report of North America Automotive Sensors Market
Please fill out the form to request a customized copy of the research report.
