

What is Operating Room Management Software Market Size?
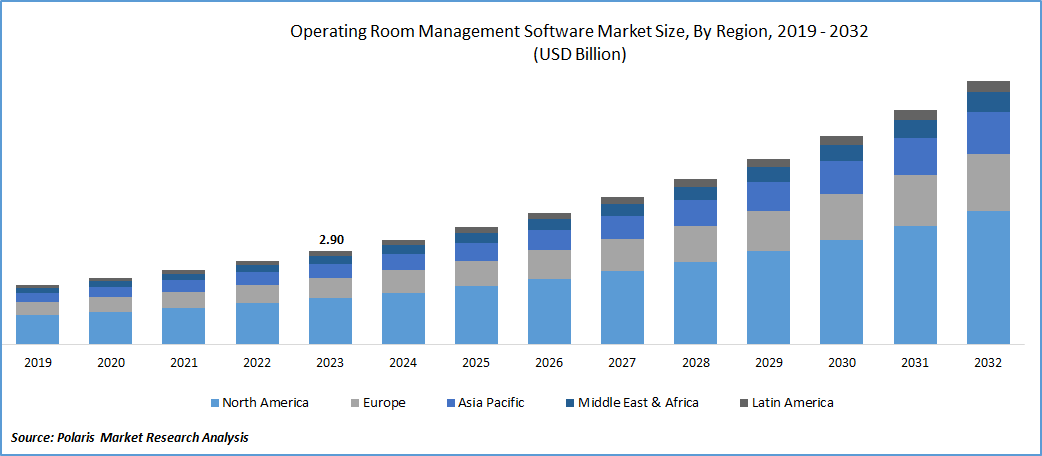
The global operating room management software market was valued at USD 3.65 billion in 2025 and is expected to grow at a CAGR of 12.4% during the forecast period. The growth is driven by rise in the number of surgical procedure wordwide, advancement in the technology, and increase in the adoption of electronic health record.
Market Statistics
- 2025 Market Size: USD 3.65 Billion
- 2034 Projected Market Size: USD 10.40 Billion
- CAGR (2026-2034): 12.4%
- Largest Market: North America
Growth is due to increasing adoption of electronic health records (EHRs), a rise in the number of surgical procedures, a heightened focus on cost reduction and efficiency improvements in hospitals and ambulatory surgery centers (ASCs), and advancements in technology associated with managing operating rooms (ORs). As the healthcare sector undergoes substantial digital transformation, these software solutions have become indispensable. They play a crucial role in optimizing surgical scheduling, resource allocation, and the management of patient data, ultimately enhancing efficiency and the quality of patient care.
To Understand More About this Research: Request a Free Sample Report
An increase in the volume of surgical procedures is expected to drive the demand for software, leading to market expansion. The COVID-19 pandemic has profoundly influenced the market, particularly during its initial phases. This decline had adverse effects, as outlined in a study published in the British Journal of Surgery, which reported the postponement or cancellation of 28 million surgeries worldwide in 2020. Many of these delayed surgeries were rescheduled for 2021, creating an increased need to enhance scheduling efficiency. In response to this demand, various technologies have been introduced by companies to address the evolving landscape of surgical procedures.
Industry Dynamics
Growth Drivers
Advancements in technology
Furthermore, advancements in artificial intelligence and data analytics are poised to be key drivers of market growth. The escalating prevalence of chronic diseases on a global scale also plays a significant role in the rising need for efficient operating rooms, primarily due to the nature of severe chronic illnesses often requiring surgical interventions. A notable example is a study published by JAMA Network Open in 2021, which disclosed that over 13 million surgical procedures were conducted across 49 U.S. states from 2019 through 2021. The study reported a 10% decline in surgical procedures by the end of 2020 compared to 2019, largely attributed to the impact of the COVID-19 pandemic.
Key OR Software Trends
|
Trend |
Description |
Key Drivers |
Examples from Practice |
|
AI/ML case duration prediction |
Machine learning models (e.g., XGBoost) forecast surgical durations using historical EHR data, surgeon/procedure specifics, reducing overruns by 10-20%. |
Block time under/overutilization; variability in surgeon speeds and case complexity. |
XGBoost models outperform traditional regression for surgeon-specific predictions; integrated into scheduling tools. |
|
EHR/perioperative integration |
Standardized data mapping from AIMS/EHR to central repositories enables semantic interoperability across vendors for research/quality metrics. |
Heterogeneous EHRs limit secondary use; need for de-identified limited datasets. |
MPOG extracts/transforms data into computable phenotypes (e.g., AKI definitions) from 7 vendors, 10M+ cases. |
|
Real-time workflow tracking |
Automated capture of case times, staff sign-in/out, vital signs for dashboards monitoring utilization, turnover, delays. |
OR downtime (turnover 20-30% of capacity); need for multimodal data protocols. |
Consensus on digitizing OR activities, uniform streaming via 5G/AI for efficiency. |
|
Clinical decision support (CDS) |
Alerts for SCIP metrics (e.g., beta-blockers, antibiotics) via AIMS improve compliance; intraoperative CDS reduces errors. |
Procedural adherence gaps; documentation burdens. |
AIMS alerts boost SCIP-INF-1/2 documentation; real-time CDS in perioperative tools. |
|
Multimodal data management |
Integration of video, sensors, wearables into OR systems for AI-driven safety (e.g., checklists, posture monitoring). |
Fragmented data silos; regulatory needs for safety analytics. |
Electronic WHO checklists, wearables for physiological monitoring in smart ORs. |
|
Scheduling optimization |
Computational models balance surgeon blocks, turnover, staff via predictive analytics for 15-25% utilization gains. |
No-show rates, emergency cases disrupting electives. |
AI workflows cut overtime/staff costs; landscape of OR scheduling algorithms. |
Report Segmentation
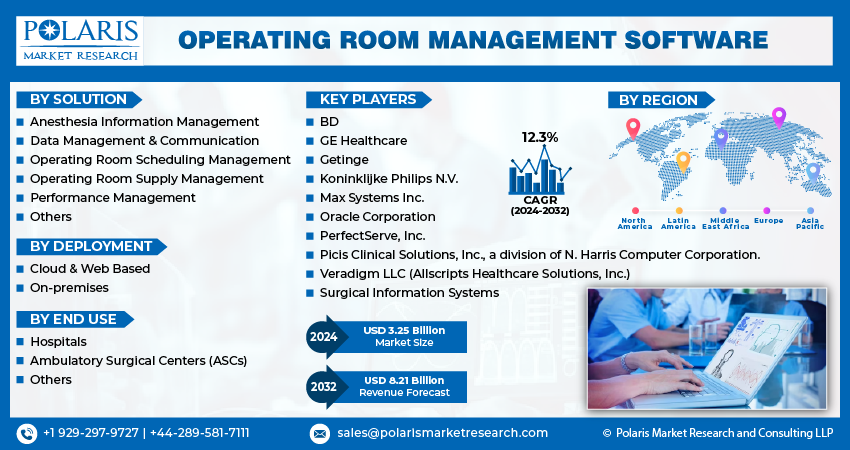
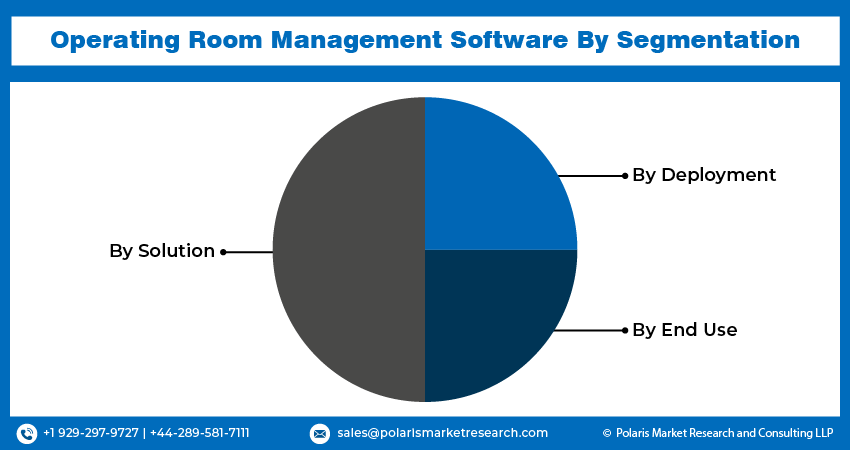
The market is primarily segmented based on solution, deployment, end use, and region.
|
By Solution |
By Deployment |
By End Use |
By Region |
|
|
|
|
To Understand the Scope of this Report: Speak to Analyst
By Solution Analysis
Solution segment accounted for the largest market share in 2025
Data management & communication segment accounted for the largest share. These solutions play a crucial role in facilitating efficient data sharing, seamless communication, and effective collaboration among surgical teams. They establish a centralized storage system for patient information, enabling medical professionals to access critical data in real time. Moreover, these solutions simplify the sharing of patient status updates throughout various perioperative care stages, aid in maintaining schedule adherence, and streamline the exchange of media and case-related information across different operating rooms and hospital departments.
Anesthesia information management segment will grow rapidly. It is primarily driven by the growing emphasis on accurate anesthetic dosing & data management. According to the Anesthesia Patient Safety Foundation, projections indicated that by 2020, approximately 84% of the academic anesthesiology departments in the U.S. would adopt these systems, marking a notable increase from an estimated 75% in 2014. This trend is anticipated to contribute significantly to the substantial expansion of the segment in the foreseeable future.
By Deployment Analysis
Cloud segment held the significant market share in 2025
Cloud segment held the significant market share. Segment’s growth is propelled by the increasing adoption of cloud solutions in clinics aimed at enhancing efficiency and lowering costs. Cloud solutions offer scalability, enabling healthcare organizations to adjust their software usage seamlessly or expand it as needed. This adaptability empowers them to effectively address the growing needs of hospitals and cater to a larger patient population without substantial investments in infrastructure. Furthermore, the cloud affords advantages such as real-time data sharing, secure data handling, flexible storage options, and reliable performance.
On premises segment is expected to gain substantial growth rate. The introduction of new on-premises software offerings equips healthcare organizations with improved offline accessibility, compliance adherence, customization options, and heightened control over their data. This type of software enables organizations to exert more influence over system upgrades, long-term cost management, and seamless integration with their existing systems. These factors contribute to a heightened demand for and increased adoption of on-premises software within the healthcare sector.
By End Use Analysis
Hospitals segment held the significant market share in 2025
Hospitals segment held the significant market share. This dominance is driven by the escalating number of surgical procedures. The American Cancer Society reported that in the U.S. in 2021, there were around 1.9 million new cancer cases and 608,570 cancer-related deaths. Notably, 43% of all cancer diagnoses in males in 2020 were attributed to colorectal, lung, and prostate cancers. Similarly, for women, breast, lung, and colorectal cancers were identified as the three most prevalent types, accounting for an expected 50% of all new cancer diagnoses in female patients.
ASCs segment is expected to gain substantial growth rate. It is attributed to the trend of transitioning from in-patient to out-patient surgical procedures. The Ambulatory Surgery Center Association (ASCA) reported that in 2020, over 5,800 ASCs performed around 30 million procedures. The significant growth of ASCs, particularly in specialized fields like orthopedics, highlights the critical role of customized operating room management software market, positioning it as a key factor driving market growth in the foreseeable future.
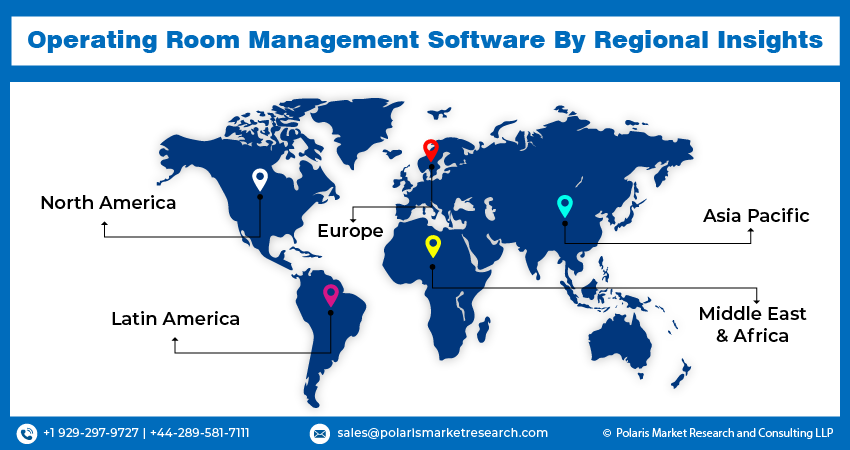
Regional Insights
North America dominated the global market in 2025
North America dominated the global market. This supremacy is attributed to the swift adoption of technologically advanced products. The regional growth is fueled by factors such as well-established infrastructure, an increasing embrace of operating room management software, and the presence of major industry players. In the United States, the market is poised for expansion, driven by the innovative strategies implemented by key industry players.
The Asia Pacific will grow with substantial pace. This is primarily due to high prevalence of chronic diseases, a large patient population, and a growing number of hospitals and healthcare facilities with improving infrastructure. Moreover, in August 2021, the government of Delhi announced a USD 19 million project aimed at establishing a cloud-based hospital information management system. This initiative was anticipated to further support the healthcare technology market in the region.
Key Market Players & Competitive Insights
The market is characterized by competitiveness due to the presence of key providers. To secure higher market shares, companies are implementing diverse strategies, including forming partnerships, introducing new products, and expanding regionally.
Some of the major players operating in the global market include:
- BD
- GE Healthcare
- Getinge
- Koninklijke Philips N.V.
- Max Systems Inc.
- Oracle Corporation
- PerfectServe, Inc.
- Picis Clinical Solutions, Inc., a division of N. Harris Computer Corporation.
- Surgical Information Systems
- Veradigm LLC (Allscripts Healthcare Solutions, Inc.)
Recent Developments
- In November 2024, US-based North American Partners in Anesthesia introduced NAPA Managed Services, a comprehensive offering designed to support the essential operating room (OR) operational needs of health systems.
- In February 2024, Veradigm acquired ScienceIO to strengthen its AI-driven data analytics, elevate customer experiences across the healthcare ecosystem, and reinforce its leadership in healthcare data intelligence all with the goal of driving better patient outcomes.
- In September 2023, Fujitsu and Baptist Health South Florida have introduced an innovative solution with the aim of revolutionizing operating room (OR) scheduling. The key goals of this recently unveiled solution include enhancing utilization rates and advancing the financial well-being of surgical practices. The improvements in OR scheduling carry substantial advantages, including decreased wait times for patients, optimal utilization of expensive surgical facilities, and the potential for reducing overall healthcare costs.
- In June 2022, Proximie has raised USD 80 Mn in Series C financing spped up its development of the Proximie's Operating System for the Operating Room (OR). This centralized platform is specifically crafted to improve connected surgical care.
Operating Room Management Software Market Report Scope
|
Report Attributes |
Details |
|
Market size in 2025 |
USD 3.65 billion |
| Market size in 2026 | USD 4.09 billion |
|
Revenue forecast in 2034 |
USD 10.40 billion |
|
CAGR |
12.4% from 2026 – 2034 |
|
Base year |
2025 |
|
Historical data |
2021 – 20224 |
|
Forecast period |
2026 – 2034 |
|
Quantitative units |
Revenue in USD million/billion and CAGR from 2026 to 2034 |
|
Segments covered |
By Solution, By Deployment, By End Use, By Region |
|
Regional scope |
North America, Europe, Asia Pacific, Latin America; Middle East & Africa |
|
Customization |
Report customization as per your requirements with respect to countries, region and segmentation. |
FAQ's
BD, GE Healthcare, Getinge, Philips, Max Systems are the key companies in Operating Room Management Software Market.
The global operating room management software market is expected to grow at a CAGR of 12.4% during the forecast period.
Solution, deployment, end use, and region are the key segments covered.
Advancements in technology are the key driving factors in Operating Room Management Software Market.
The global operating room management software market size is expected to reach USD 10.40 billion by 2034
Page last updated on:
Jan-2024
Research Methodology
A robust system of research, verification, and forecasting designed to ensure reliable and actionable market insights.
Polaris Market Research uses a clear and structured approach to deliver insights that clients can rely on. The process combines detailed primary and secondary research, including direct communication with industry experts. The detailed information helps build a complete picture of market trends and developments. Secondary data is gathered from credible sources such as industry reports, company filings, government source links, and trusted organization databases. It is then cross-checked through discussions with key stakeholders across the value chain. Market size and forecasts are developed using both bottom-up and top-down methods to ensure accuracy and consistency in the final results.

Project Setup
Step 1 & 2:
- We start every project by clearly understanding the client’s objective or goal, then defining the market scope, and aligning regions, segments, and timelines.
- Once the foundation is set, we collect data from all-around of sources, including company reports, government databases, and paid industry platforms.
- Our research is based on secondary data, which helps us build a strong understanding of the market across regions and industries. Then we validate this information through primary research by speaking directly with industry experts, companies, and stakeholders.
- By combining secondary and primary research, we ensure that our market insights are accurate, practical, and closely aligned with real market conditions.
Data Collection
We gather information from both public and verified sources:

Data Structuring
Step 3:
- All collected data is organized into a consistent format to ensure accurate analysis. Since inputs come from multiple sources, they are standardized and aligned before use.
- The data is segmented by product, application, and region, and mapped across a defined historical period (2020–2024). All values are converted into common units (USD Mn/Bn), and volume and pricing are aligned where required to estimate revenue.
- Any overlaps or inconsistencies are reviewed and adjusted to maintain accuracy (<5% variance threshold).
- The result is a structured dataset that allows for clear comparison across regions and supports reliable analysis and forecasting.
Structured Market Dataset, USD Mn/Bn

4. Data Structuring
Step 4: TOP-DOWN APPROACH
- We start with the overall market size at a global or macro level.
- The market is then narrowed down based on scope and industry relevance.
- We apply penetration rates and split the data by region and segment.
- This helps us estimate the market size for specific segments.
- The numbers are validated through cross-checks to ensure accuracy.

Step 5: BOTTOM-UP APPROACH
- We begin by analyzing data from leading companies in the market.
- Revenue data is collected and mapped across different segments.
- The data is then aggregated to estimate the total market size.
- To fill in any gaps, adjustments are made based on industry standards.
- Validation checks make sure that the results are correct.

5. Data Structuring
Step 6:
At Polaris Market Research, we employ a methodical forecasting strategy. This approach blends the analysis of historical data with real-time market validation. To forecast future trends with precision, we examine past patterns, pricing fluctuations, and the interplay of supply and demand. To ensure our conclusions reflect the present market landscape, we actively seek input from industry experts and key stakeholders.
To refine our predictions, we carefully consider critical elements such as market drivers and restraints, fluctuations in raw material costs, emerging technologies, and the production capabilities of various regions. Furthermore, we assess regulatory frameworks and potential policy shifts to gauge their potential impact on market expansion.
All this information is synthesized to generate precise forecasts for each segment and region. These forecasts illuminate the current state of the market and highlight forthcoming opportunities.

6. Data Structuring
Step 7:
In the final stage, we validate all our estimates using a triangulation method, where data is cross-checked from multiple reliable sources, like company data, primary interviews, and secondary research. This helps us make sure that our numbers are correct and fit with the rest of the market.
This process involves verifying data consistency across various segments and geographic areas. It also requires comparing historical trends with the assumptions support the forecast. Any discrepancies involve adjustments to ensure everything remains aligned and dependable.
Once the data is finalized, we prepare the final outputs, including market size estimates, segment-wise breakdowns, and growth metrics. These are delivered in structured formats such as tables, charts, and data files for easy analysis and use.
We collaborate closely with clients, ensuring the final products align with their requirements. This includes offering tailored adjustments, supplementary data analyses, and continuous assistance. Furthermore, we monitor market trends post-delivery, providing updates and refinements to maintain the insights' relevance as time passes.
Post-delivery, we continue to monitor market shifts, offering updates and adjustments to ensure the insights remain relevant over time.
Validation
Triangulation Framework
- Company-level data
- Primary inputs from industry participants
- Secondary benchmarks and published data
- Variance maintained within ±5-10%
- Adjustments applied to align estimates
- Segment values validated against overall market structure
Quality Check
Data Consistency & Integrity
- Segment totals validated to 100%
- Regional estimates aligned with global market size
- Historical trends compared against forecast outputs
- Assumptions reviewed for cross-segment and regional alignment
Output & Delivery
Final Outputs
- Market size estimates (USD Mn/Bn)
- Segment-wise distribution (%)
- Growth metrics (CAGR %)
- Structured tables and charts
- Segment-level datasets
- Excel-based data files for further analysis
Client Alignment & Support
- Deliverables are aligned with defined client requirements and scope
- Custom data cuts and segment splits are incorporated as required
- Post-delivery queries are addressed through analyst interactions
- Additional clarifications and data support are provided upon request
Client Continuity & Updates
- Market developments are tracked post-delivery to capture changes in key trends
- Updated data and revisions are provided based on new market inputs
- Additional refinements and data cuts are shared as required
- Continued analyst engagement supports evolving client requirements
