
Optical Transceiver Market Trends and Growth Drivers, 2024-2032
REPORT DETAILS
Market Statistics
The optical transceiver market size was valued at USD 12.40 billion in 2023. The market is anticipated to grow from USD 14.04 billion in 2024 to USD 38.23 billion by 2032, exhibiting a CAGR of 13.3% during the forecast period
Industry Trend
An optical transceiver, commonly known as a "transceiver," is a crucial component in fiber optic communication systems. It integrates both a transmitter and a receiver within a unified unit, facilitating bidirectional data exchange over optical fiber networks.
The demand for high-speed internet and data transmission capabilities has surged in recent years due to the increasing reliance on digital technologies across various sectors. This demand is fueled by the exponential growth of data generated by activities such as video streaming, social media usage, online gaming, e-commerce, and enterprise applications. Traditional copper-based communication systems struggle to keep up with this demand due to their limited bandwidth and susceptibility to interference. Consequently, there has been a global push towards expanding fiber optic networks, which offer significantly higher bandwidth and reliability.
Source: Polaris Market Research Analysis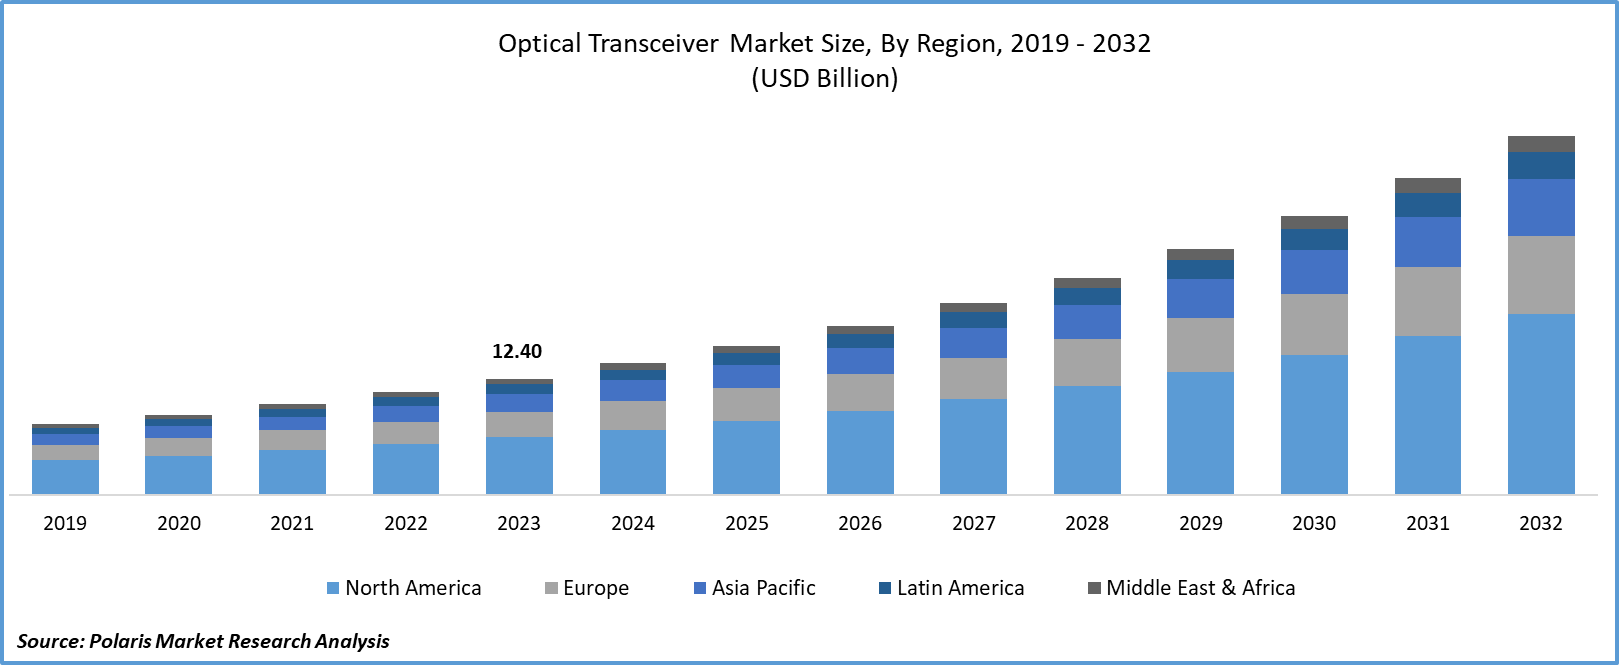
To Understand More About this Research:Download Sample Report
Fiber optic networks utilize optical fibers to transmit data in the form of light pulses over long distances. Optical transceivers are essential components in these networks as they facilitate the conversion of electrical signals into optical signals for transmission and vice versa. By combining a transmitter and receiver into a single unit, optical transceivers enable bidirectional communication over optical fibers. This capability is crucial for establishing high-speed, low-latency connections that can meet the demands of modern digital applications. Hence the optical transceivers market share is expected to grow in the upcoming years.
Moreover, the proliferation of data centers has been driven by the rapid growth of cloud computing, streaming services, and other data-intensive applications. Data centers serve as the backbone of the digital economy, hosting vast amounts of data and providing computing resources to support various online services. Within data centers, optical transceivers play a vital role in connecting servers, storage devices, and networking equipment. They enable high-speed communication between these components, ensuring efficient data processing and delivery. As a result, the optical transceivers market size is expected to grow in the upcoming years.
Furthermore, the adoption of Internet of Things (IoT) devices is expanding across industries, including manufacturing, healthcare, transportation, agriculture, and smart cities. These devices collect and transmit data from sensors and actuators, enabling real-time monitoring, automation, and process optimization. However, the widespread deployment of IoT devices requires robust communication infrastructure capable of handling the massive volume of data generated. As a result, the optical transceivers market size is expected to grow in the upcoming years. Optical transceivers play a crucial role in facilitating high-speed data transfer within IoT networks, ensuring reliable connectivity and efficient data transmission.
There is a continuous drive to enhance performance, increase bandwidth, and reduce form factors. With the rapid expansion of data-intensive applications such as cloud computing, streaming services, and 5G networks, there's an escalating demand for high-speed, reliable communication solutions. As a result, manufacturers are pushing the boundaries of technology to introduce new products that meet these evolving demands. As a result, significant growth is expected in the optical transceiver market share during the forecast period.
For instance, in December 2023, Coherent introduced the optical industry's pioneering 800G ZR/ZR+ transceiver, packaged in an exceptionally compact QSFP-DD pluggable format, tailored for optical communications networks.
The increasing demand for high-speed internet access and bandwidth-intensive applications is driving the expansion of fiber optic networks globally. Optical transceivers are essential components in these networks, supporting both long-haul and last-mile connectivity. As fiber optic network deployments continue to grow, there is a corresponding increase in demand for optical transceivers. As a result, the optical transceivers market share is expected to grow in the upcoming years. The rollout of 5G networks requires high-speed and low-latency data transmission, which drives the demand for optical transceivers. As 5G networks continue to expand globally, there will be significant market opportunities for companies involved in providing optical transceiver solutions, thereby increasing in optical transceiver market share.
Key Takeaway
- North America dominated the largest market and contributed to more than 40% of the share in 2023.
- The Asia Pacific market is expected to be the fastest-growing CAGR during the forecast period.
- By application category, the data center segment accounted for the largest market share in 2023.
- By wavelength category, the 1310 nm band segment is projected to grow at a high CAGR during the projected period.
What are the Market Drivers Driving the Demand for the Optical Transceiver Market?
Growing Demand for Cloud-Based Services to Boost the Market Growth
The optical transceiver market presents several opportunities for growth and innovation, driven by various factors, including technological advancements, increasing demand for high-speed communication, and expanding applications across industries. The rollout of 5G networks worldwide requires advanced communication infrastructure to support high-speed, low-latency connectivity. Optical transceivers play a crucial role in enabling the efficient transmission of data in 5G networks, presenting significant opportunities for manufacturers to supply transceivers optimized for 5G applications. The proliferation of cloud computing, big data analytics, and streaming services has fueled the growth of data centers. As data center capacity continues to expand, there is a growing demand for higher-speed transceivers, such as 100G, 200G, and 400G modules. Hence the optical transceivers market share is expected to grow in the upcoming years.
The adoption of IoT devices across industries is driving the need for robust communication infrastructure capable of handling large volumes of data generated by sensors and actuators. Optical transceivers enable high-speed data transfer within IoT networks, supporting applications such as industrial automation, smart cities, and connected vehicles. This rising demand is expected to increase the optical transceiver market share in the forecast period.
Which Factor is Restraining the Demand for Optical Transceivers?
The High Initial Investment Required for Deploying Fiber Optic Infrastructure is Expected to Hinder the Growth of the Market
Fiber optic networks offer numerous advantages, such as high bandwidth, low latency, and immunity to electromagnetic interference. However, the upfront costs associated with installing fiber optic cables, building optical network infrastructure, and deploying optical transceivers can be substantial. This initial investment may deter some businesses, especially smaller enterprises or those operating in regions with limited financial resources, from adopting fiber optic technology. Additionally, the complexity of integrating fiber optic networks into existing infrastructure and the need for specialized expertise in installation and maintenance can also pose challenges for adoption. Some organizations may hesitate to transition to fiber optic communication due to concerns about the perceived complexity and potential disruption to their operations during the deployment process. Furthermore, in certain regions or industries where there is already significant investment in legacy copper-based infrastructure, the transition to fiber optics may be slower due to the reluctance to abandon existing investments or the perceived lack of immediate need for higher bandwidth capabilities. Hence, the optical transceivers market is expected to hinder the growth in the future.
Source: Polaris Market Research Analysis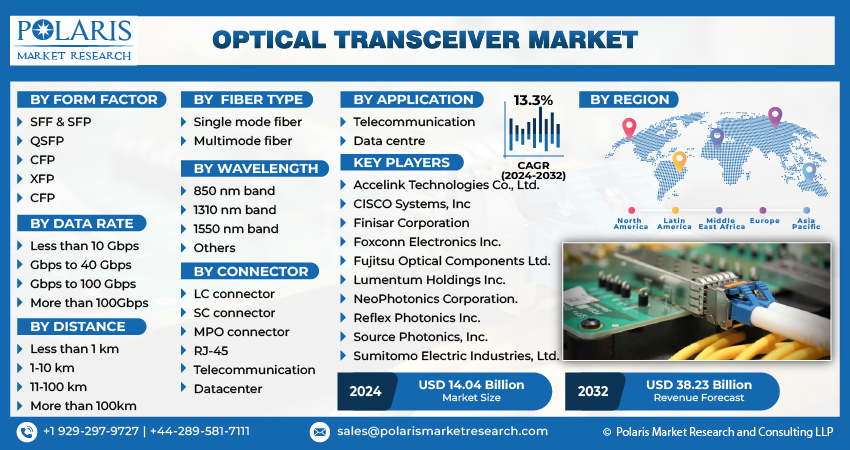
Get Full Segment-Level Forecasts & Insights: Download Sample Report
Report Segmentation
The market is primarily segmented based on form factor, data rate, fiber type, distance, wavelength, connector, application, and region.
| By Form Factor | By Data Rate | By Fiber Type | By Distance | By Wavelength | By Connector | By Application | By Region |
|
|
|
|
|
|
|
|
Source: Polaris Market Research Analysis
To Understand the Scope of this Report:Request Customization
Category Wise Insights
By Application Insights
Based on application analysis, the market is segmented into telecommunication and data centers. The data center held the largest market share in 2023. With the rise of digitalization, cloud computing, and the Internet of Things (IoT), there has been an exponential increase in data consumption. Data centers serve as the backbone of this digital infrastructure, necessitating high-speed and reliable optical transceivers to manage the vast amounts of data being processed. The demand for data centers has surged with the proliferation of online services, e-commerce, social media, and streaming platforms. As data centers expand to accommodate growing data loads, the need for optical transceivers increases proportionally to support high-speed data transmission within and between these facilities.
Data centers require high-speed connectivity to ensure efficient data processing, storage, and distribution. Optical transceivers offer high-speed data transmission capabilities over optical fibers, enabling rapid and reliable communication between servers, storage devices, and networking equipment within data center environments.
By Wavelength Insights
Based on wavelength analysis, the market has been segmented into the 850 nm band, 1310 nm band, 1550 nm band, and others. The 1310 nm band segment is expected to grow at the fastest CAGR during the forecast period. This wavelength is well-suited for transmission over single-mode optical fibers, which are commonly used in long-distance communication networks. Single-mode fibers offer lower signal attenuation and higher bandwidth compared to multimode fibers, making them ideal for high-speed and long-distance data transmission applications.
Optical transceivers operating at 1310 nm offer flexibility in wavelength selection and are compatible with various optical networking standards and protocols. This versatility makes them suitable for a wide range of applications, including telecommunications, data centers, enterprise networks, and metropolitan area networks (MANs). As demand for higher bandwidth and faster data transmission speeds continues to grow, the 1310 nm band segment becomes increasingly attractive for applications requiring high-performance optical communication solutions.
Source: Polaris Market Research Analysis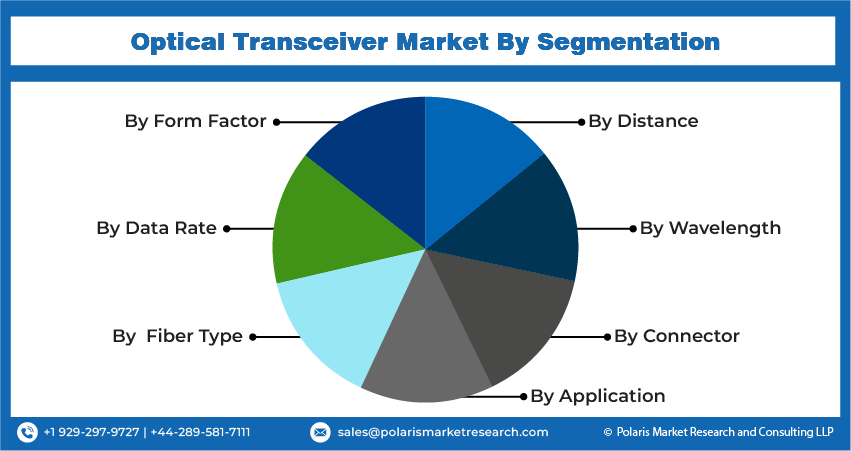
Need Granular Data Across All Market Segments? Request Customization
Regional Insights
North America
North American region accounted for the largest market share in 2023. North America, particularly the United States, boasts one of the most advanced telecommunications infrastructures globally. This infrastructure is characterized by extensive fiber optic networks deployed across the region to support high-speed data transmission, internet connectivity, and telecommunications services.
North America is home to a significant number of large-scale data centers operated by tech giants, cloud service providers, and enterprises. These data centers require robust optical transceiver solutions to facilitate high-speed data communication within the facilities and across networks, driving the demand for optical transceivers in the region. This demand necessitates the deployment of advanced optical transceiver technologies to support high-speed data transmission and bandwidth-intensive applications. As a result, in the North American region, the optical transceivers market share is expected to dominate in the forecast period. Top of Form
Asia Pacific
Asia Pacific is expected for the growth of fastest CAGR during the forecast period. The Asia Pacific region is experiencing rapid economic growth, driven by emerging economies such as China, India, and Southeast Asian countries. This growth is accompanied by increasing investments in telecommunications infrastructure, data centers, and digitalization initiatives, creating significant demand for optical transceivers to support high-speed data transmission and connectivity.
Asia Pacific is witnessing extensive expansion and modernization of telecommunications networks to meet the growing demand for broadband services, mobile connectivity, and digital infrastructure. Optical transceivers are essential components in these networks, enabling high-speed data transmission over fiber optic cables to support voice, data, and multimedia services. This trend is driving the demand for optical transceivers in various applications, including access networks, metro networks, and long-haul transmission networks, to accommodate the growing volume of internet traffic and digital services.
Source: Polaris Market Research Analysis.png)
Curious About Regional Market Performance? Request Customization
Competitive Landscape
The competitive landscape of the optical transceiver market is characterized by intense competition among key players striving to maintain and expand their market presence. The companies leverage their strong research and development capabilities, technological expertise, and strategic partnerships to innovate and introduce advanced optical transceiver solutions catering to diverse applications such as telecommunications, data centers, enterprise networking, and consumer electronics. Additionally, the market witnesses significant collaboration and merger activities aimed at expanding product portfolios, enhancing market reach, and gaining a competitive edge.
Some of the major players operating in the global market include:
- Accelink Technologies Co., Ltd.
- CISCO Systems, Inc
- Finisar Corporation
- Foxconn Electronics Inc.
- Fujitsu Optical Components Ltd.
- Lumentum Holdings Inc.
- NeoPhotonics Corporation.
- Reflex Photonics Inc.
- Source Photonics, Inc.
- Sumitomo Electric Industries, Ltd.
Recent Developments
In December 2025: Applied Optoelectronics secured a multi-million-dollar order for 800G OSFP modules from a North American hyperscale company, with first deliveries expected in Q1 2026.
In November 2025: Lumentum announced that bookings for 800G coherent products exceeded 100G orders for the first time.
In October 2025: Corning approved its ultra-low-loss multicore fiber for co-packaged optics and started field testing with three hyperscale clients.
In September 2025: Innolight delivered over 500,000 units of 400G modules in H1 2024 and plans large-scale production of 800G QSFP-DD modules in Q4 2025.
In May 2025: Exail successfully demonstrated 10 Gb/s two-way laser communication on the TELEO GEO project, working with Airbus Defense & Space and CNES.
In May 2025: Point2 Technology and Sumitomo Electric partnered to jointly develop 25 G transceivers for carrier x-Haul networks and early 6G testing.
Report Coverage
The optical transceiver market report emphasizes key regions across the globe to provide users with a better understanding of the product. The report also provides market insights into recent developments and trends and analyzes the technologies that are gaining traction around the globe. Furthermore, the report covers an in-depth qualitative analysis pertaining to various paradigm shifts associated with the transformation of these solutions.
The report provides a detailed analysis of the market while focusing on various key aspects such as competitive analysis, form factor, data rate, fiber type, distance, wavelength, connector, application, and their futuristic growth opportunities.
Optical Transceiver Market Report Scope
| Report Attributes | Details |
| Market size value in 2024 | USD 14.04 billion |
| Revenue Forecast in 2032 | USD 38.23 billion |
| CAGR | 13.3% from 2024 – 2032 |
| Base year | 2023 |
| Historical data | 2019 – 2022 |
| Forecast period | 2024 – 2032 |
| Quantitative units | Revenue in USD billion and CAGR from 2024 to 2032 |
| Segments Covered | By Form Factor, By Data Rate, By Fiber Type, By Distance, By Wavelength, By Connector, By Application, And By Region |
| Regional scope | North America, Europe, Asia Pacific, Latin America, Middle East & Africa |
| Customization | Report customization as per your requirements with respect to countries, regions, and segmentation. |
Source: Polaris Market Research Analysis
Optical Transceiver Market FAQ's
key companies in Optical Transceiver Market are Accelink Technologies Co., Ltd., CISCO Systems, Inc., Finisar Corporation, Foxconn Electronics Inc
The optical transceiver market exhibiting a CAGR of 13.3% % during the forecast period
The Optical Transceiver Market report covering key segments are form factor, data rate, fiber type, distance, wavelength, connector, application, and region.
key driving factors in Optical Transceiver Market are growing demand for cloud-based services to boost the market growth
The global optical transceiver market size is expected to reach USD 38.23 billion by 2032
Download Sample Report of Optical Transceiver Market
Please fill out the form to request a customized copy of the research report.
