
Paper Straw Market Share, Size, Analysis Report, 2025-2034
REPORT DETAILS
Market Statistics
Market Overview
The global Paper Straw Market was valued at USD 1.3 billion in 2024 and is projected to grow at a CAGR of 16.30% from 2025 to 2034. Regulatory bans on plastic straws and eco-friendly packaging trends are major growth catalysts.
Key Insights
- The virgin paper segment held the dominant share, accounting for the largest portion, due to its superior absorbency, quality, and strength in the production of paper straws.
- The food processing segment held the largest market share due to high demand for ready-to-drink beverages and a growing trend toward environmentally friendly packaging.
- North America dominated the market due to the widespread adoption of paper straws and stringent controls on plastic.
- Asia Pacific is expected to grow rapidly, due to its large population and increasing awareness of plastic pollution.
Industry Dynamics
- The market is poised for ongoing expansion as increasing consumer demand for environmentally friendly packaging drives companies toward the adoption of green alternatives.
- Increasing sensitivity to plastic pollution is driving demand for sustainable alternatives, such as paper straws, which are propelling their growth as an environmentally friendly option.
- Market growth has been spurred by new material development, making paper straws more durable, useful, and aesthetically pleasing to buyers.
- The market is constrained by higher production costs and reduced durability compared to plastic straws.
Market Statistics
2024 Market Size: USD 1.3 billion
Source: Polaris Market Research Analysis
2034 Projected Market Size: USD 5.2 billionSource: Polaris Market Research Analysis
CAGR (2025-2034): 16.30%Source: Polaris Market Research Analysis
North America: Largest Market ShareSource: Polaris Market Research Analysis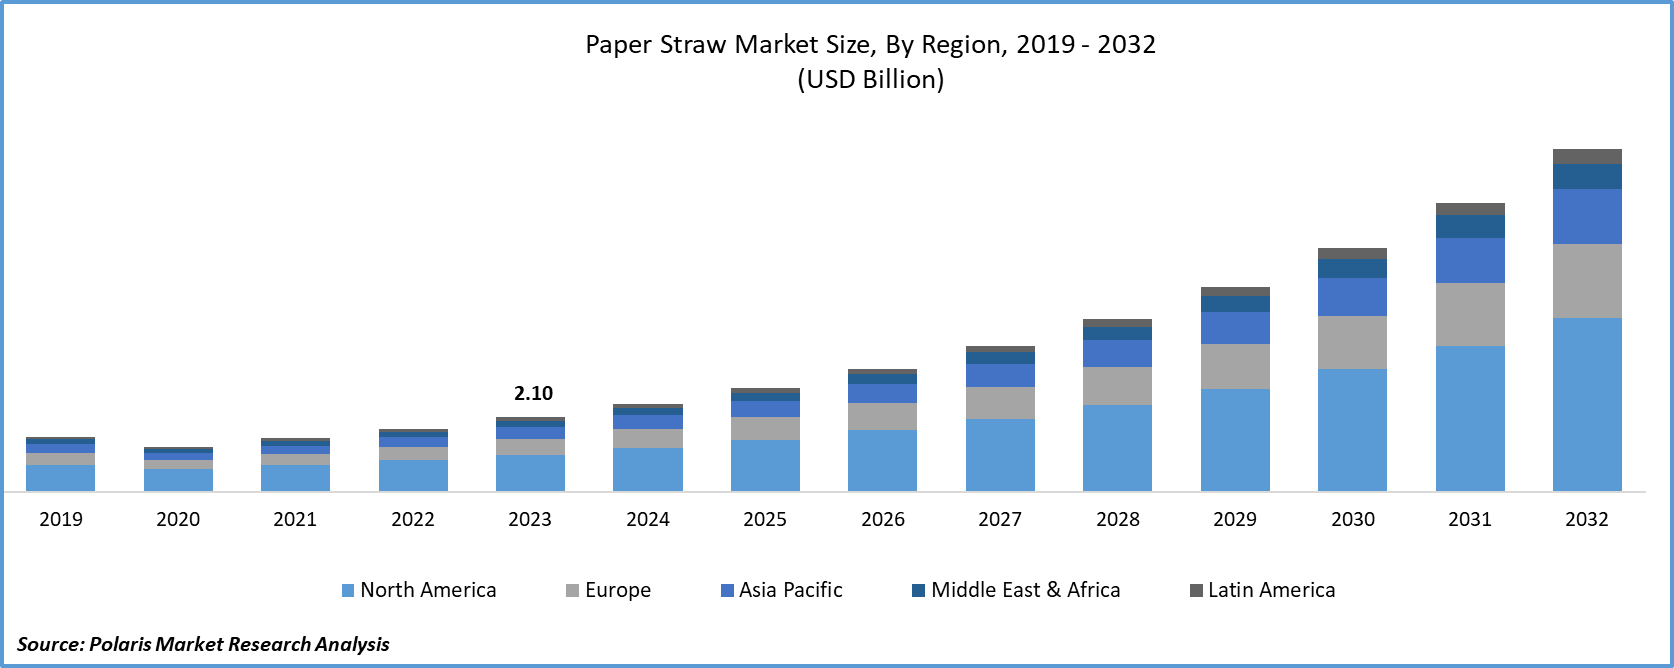
To Understand More About this Research: Download Sample Report
There is a heightened awareness of the environmental impact of plastic pollution, leading to increased concern among consumers and regulatory bodies. Government regulations are playing a significant role in shaping the packaging industry, with a growing emphasis on sustainable practices. The foodservice industry's expansion is also contributing to the demand for eco-friendly packaging solutions.
Consumer preferences are shifting towards sustainable packaging options, reflecting a broader trend of environmentally conscious choices. As the global commitment to sustainability gains momentum, businesses are adapting to these changes by incorporating eco-friendly alternatives. The paper straw market is poised for continued growth as these factors converge, highlighting the increasing importance of sustainable practices in packaging and the broader market landscape.
The increasing awareness of the negative environmental impact associated with single-use plastic items, including plastic straws, has prompted a shift in consumer preferences toward more sustainable alternatives. Paper straws have emerged as a popular eco-friendly choice due to their biodegradable, compostable, and renewable nature. In a survey conducted by the H.B. Fuller, in May 2021 to gauge consumer attitudes toward paper straws, it was found that 65% of consumers expressed support for the ban on single-use plastic straws. This growing sentiment is likely to drive an increased demand for alternative options like paper straws, as consumers actively seek more sustainable choices.
Source: Polaris Market Research Analysis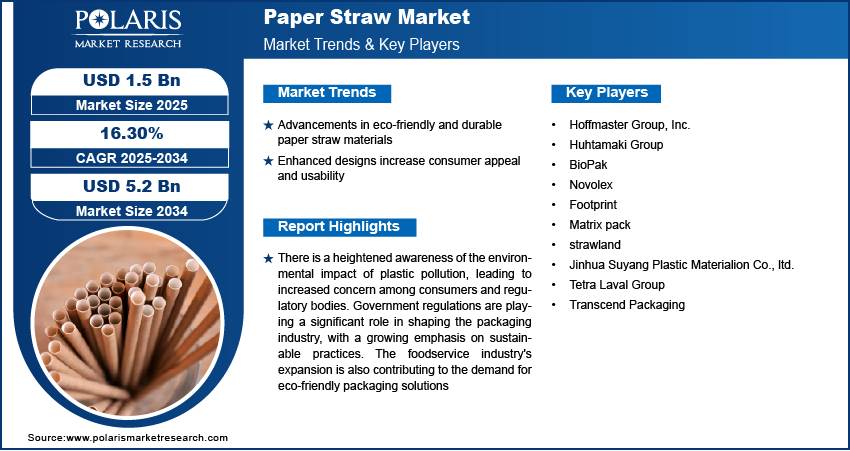
Get Full Segment-Level Forecasts & Insights: Download Sample Report
For More Details, Request for Report Discount
Growth Drivers
-
Innovation in Technology
The market has experienced notable advancements in material innovation, leading to a proliferation of various types and designs of paper straws. Manufacturers are now producing paper straws that not only prioritize eco-friendliness but also offer durability, functionality, and aesthetic appeal. This concerted effort to enhance the consumer experience has been instrumental in stimulating market growth. The increased availability of diverse paper straw options addresses the varied needs and preferences of consumers. By offering straws that are not only environmentally friendly but also durable and visually appealing, manufacturers have encouraged a broader adoption of paper straws. This expansion of choices has played a key role in attracting consumers to embrace sustainable alternatives, contributing to the overall growth of the market.
Report Segmentation
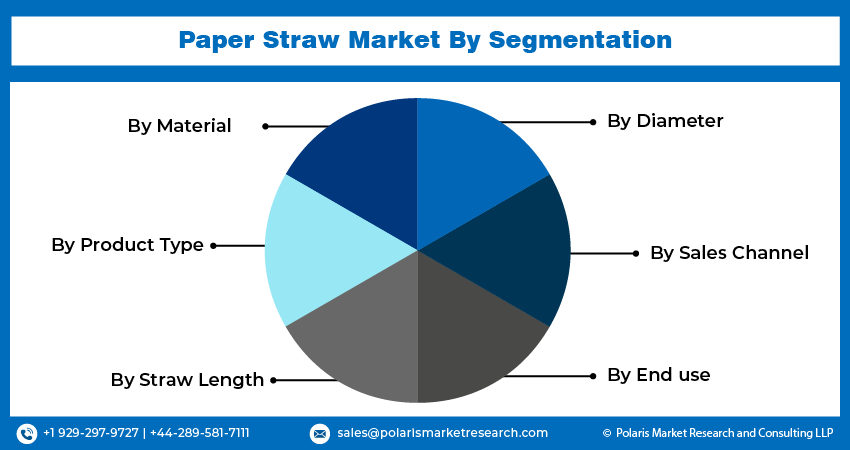
The market is primarily segmented based on material, product type, straw length, diameter, sales channel, end use, and region.
| By Material | By Product Type | By Straw Length | By Diameter | By Sales Channel | By End use | By Region |
|
|
|
|
|
|
|
Source: Polaris Market Research Analysis
Source: Polaris Market Research Analysis
To Understand the Scope of this Report: Request Customization
By Material Analysis
-
Virgin paper segment held the largest share
Virgin paper segment held the largest share. This dominance is attributed to the overall advantages that virgin paper offers in the development of paper straws, including a superior absorbency rate, excellent quality, and the ability to withstand usage for an extended period. These favorable characteristics influence manufacturers to prefer the use of virgin paper in straw production. Moreover, virgin paper is considered safer, as it is devoid of bacteria in comparison to recycled paper. A study conducted by Laval University revealed that the bacterial concentrations in tested recycled paper were 100-1,000 times higher than those found in virgin wood pulp. This safety aspect further contributes to the preference for virgin paper in the manufacturing of paper straws.
Recycled paper segment projected to grow at the fastest rate. Recycled paper is considered an environmentally friendly option as it can be recycled four to five times, making it a sustainable choice. This alternative is deemed greener because the recycling process requires less energy and water compared to the production of virgin paper, resulting in lower carbon emissions. Additionally, the use of recycled paper in paper straws contributes to reduced waste in landfills.
By Product Type Analysis
-
Non-printed segment registered the largest market share in 2024
Non-printed segment accounted for the largest share. These straws present numerous advantages, making them a preferred option for environmentally conscious consumers and industries. The lack of color pigments on paper facilitates easier recycling and guarantees that no chemicals were released during the decomposition process.
Printed segment will grow rapidly. This growth is attributed to the wide range of options available in printed straws, including various colors, patterns, and branding elements. This diversity enables end-users to craft a distinctive and visually appealing experience for their customers. The advancement and evolution of printing technology, coupled with the rising consumer demand for aesthetic features and patterns in paper straws, are expected to be key drivers of the growth.
By End Use Analysis
-
Food processing segment held the significant market revenue share in 2024
Food processing segment held the largest share. The food processing industry manufactures a diverse array of ready-to-drink products, including juices, smoothies, iced coffees, and various other beverages. The demand for straws is common in the consumption of these products for added convenience. The growing emphasis on sustainable packaging, driven by increasing regulations and a global shift toward eco-friendly practices, is fostering the widespread adoption of paper straws within this industry.
Food service will grow at the substantial pace. The expansion of this industry has resulted in a rise in the number of establishments offering beverages, consequently generating a heightened demand for straws. Evolving consumer preferences and the influence of regulatory measures have prompted this segment to embrace sustainable packaging materials, thereby escalating the demand for paper straws.
Regional Insights
-
North America region held the largest share of the global market in 2024
The North America region dominated the market. This dominance is linked to the growing availability of paper straws and the significant impact of plastic regulations across the region. Regulatory landscape has accelerated the adoption of paper straws as a viable alternative. The thriving food and beverages industry, coupled with evolving consumer preferences favoring sustainable and plastic-free materials, contributes to the region's leadership in the market.
The Asia Pacific region projected to grow at the rapid pace. The expanding population and growing awareness regarding the adverse environmental impacts of plastic waste are anticipated to be key drivers of market growth in the region. Additionally, the implementation of government regulations aimed at banning single-use plastics in developed countries has further contributed to the growth trajectory.
Source: Polaris Market Research Analysis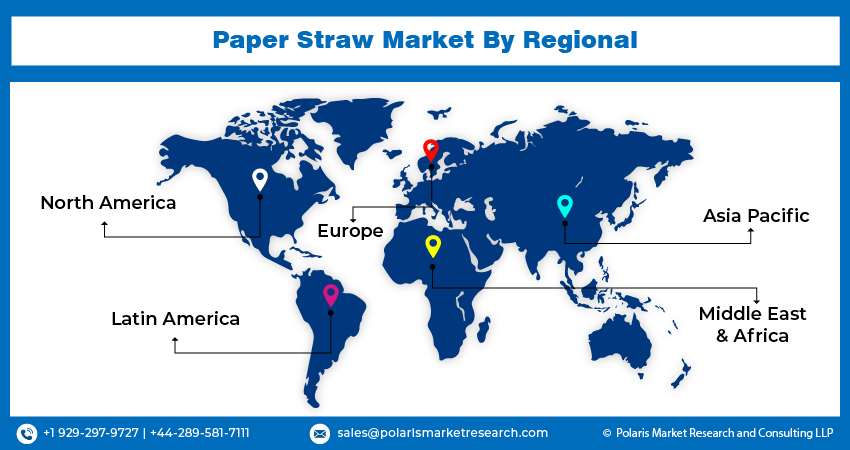
Curious About Regional Market Performance? Request Customization
Key Market Players & Competitive Insights
The market is characterized by the presence of numerous players, contributing to its competitive nature. Leading global companies are strategically employing partnerships, collaborations, the introduction of new materials, and agreements as tactics to navigate the intense competition and expand their market share.
Some of the major players operating in the global market include:
- Hoffmaster Group, Inc.
- Huhtamaki Group
- BioPak
- Novolex
- Footprint
- Matrix pack
- strawland
- Jinhua Suyang Plastic Materialion Co., ltd.
- Tetra Laval Group
- Transcend Packaging
Recent Developments
- April 2025: Novolex completed its merger with Pactiv Evergreen, forming a major food, beverage, and specialty packaging company valued at approximately USD 6.7 billion. The combined business manages more than 250 brands and 39,000 SKUs, significantly strengthening its position in sustainable packaging solutions.
- March 2025: Stora Enso began operations at its new consumer packaging board line at the Oulu site in Finland, following a EUR 1 billion investment. With an annual capacity of 750,000 tonnes, the facility will produce folding box board and coated unbleached kraft for food and beverage applications, reinforcing the company’s leadership in renewable packaging markets.
- In December 2024, Starbucks Japan launched biodegradable Green Planet straws made from plant-based materials, reducing waste and carbon emissions.
- In May 2022, SIG India introduced a range of recyclable and sustainable paper straws, available in multiple dimensions and shapes. These paper straws are crafted using paper sourced from Forest Stewardship Council (FSC)-certified suppliers. Aligned with India's efforts to curb plastic use and addressing the significant environmental impact associated with plastic straws, SIG has introduced this new material as an alternative.
- In October 2022, McDonald's Japan, implemented the use of the paper straws & wooden utensils while phasing out plastic materials at around 2,900 locations throughout Japan.
- In August 2021, Novolex acquired Vegware to strengthen its portfolio of paper materials within sustainable brands and meet the growing demand for the compostable food-service packaging.
Paper Straw Market Report Scope
| Report Attributes | Details |
| Market size value in 2025 | USD 1.5 billion |
| Revenue forecast in 2034 | USD 5.2 billion |
| CAGR | 16.30% from 2025 – 2034 |
| Base year | 2024 |
| Historical data | 2020 – 2023 |
| Forecast period | 2025 – 2034 |
| Quantitative units | Revenue in USD million/billion and CAGR from 2025 to 2034 |
| Segments covered | By Material, Product Type, By Straw Length, Diameter, Sales Channel, End Use, By Region |
| Regional scope | North America, Europe, Asia Pacific, Latin America, Middle East & Africa |
| Customization | Report customization as per your requirements with respect to countries, region, and segmentation. |
Source: Polaris Market Research Analysis
paper straw market FAQ's
The global paper straw market is expected to grow at a CAGR of 16.30% during the forecast period.
Key players in the market are Hoffmaster Group, Huhtamaki, BioPak, Novolex, Footprint, Matrix pack
North America contribute notably towards the global paper straw market
The global paper straw market is expected to grow at a CAGR of 16.30% during the forecast period.
The paper straw market report covering key segments are material, product type, straw length, diameter, sales channel, end use, and region.
Recycled paper shows fastest growth due to environmental sustainability, reduced energy consumption, lower carbon emissions, and decreased landfill waste contribution.
Non-printed paper straws dominate due to easier recycling, absence of chemical pigments, eco-friendly decomposition, and preference among environmentally conscious consumers.
Download Sample Report of paper straw market
Please fill out the form to request a customized copy of the research report.
