
Petrochemicals Market Size, Share & Growth Report, 2026-2034
REPORT DETAILS
Market Statistics
Petrochemicals Market Overview
The Petrochemicals market was valued at USD 695.22 billion in 2025 and is anticipated to grow at a CAGR of 5.30% from 2026 to 2034. The increasing demand for lightweight materials in automobiles and aircraft, along with efforts to reduce carbon emissions, is spurring innovation and paving the way for the creation of new, environmentally friendly products.
Key Takeaways
- In 2025, the ethylene segment dominated the market with a share of 22.4%, due to increasing demand from major industries, including construction, packaging, and transportation.
- In 2025, the packaging sector dominated the global market accounting for a share of 30.8%, driven by the expansion of e-commerce, rising consumer demand, and the food industry's increasing need for plastic packaging.
- Asia Pacific had the highest market share of 52.0% in 2025 and is anticipated to maintain its dominance over the forecast period.
- The North American market is poised for rapid growth with a CAGR of 4.5%, due to increased shale gas production, lower manufacturing costs, and increased investment in new plants.
- Europe is expected to be the most rapidly growing petrochemicals market growing with a CAGR of 4.2%, stimulated by the continued rebound and growth of the region's oil and gas industry.
Market Statistics
- 2025 Market Size: USD 695.22 billion
- 2034 Projected Market Size: USD 1,106.13 billion
- CAGR (2026-2034): 5.30%
- Asia Pacific: Largest Market Share
Industry Dynamics
- The increasing need for sustainable and eco-friendly materials provides strong opportunities for the petrochemicals market.
- The increased demand for electronic gadgets, such as smartphones and laptops, driven by technological growth and shifts in consumer behavior, creates a need for high-quality components and fuels market growth.
- The petrochemical industry is expected to grow significantly as more people, higher incomes, and expanding cities and industries in developing countries increase demand.
- High environmental regulations and increasing concern about minimizing plastic waste are major constraints curbing growth in the petrochemical industry.
Source: Polaris Market Research Analysis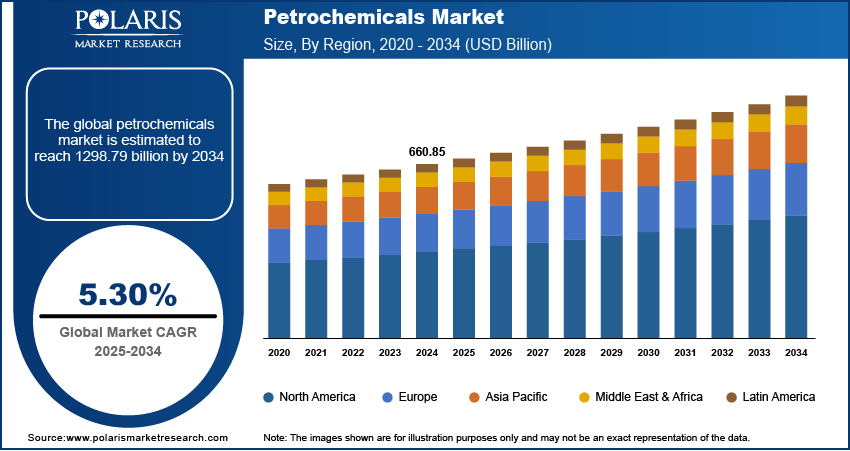
To Understand More About this Research:Download Sample Report
What are Petrochemicals?
Petrochemicals are chemicals obtained from crude oil and natural gas. They are used to make plastics, synthetic fibers, rubber, and detergents. Production involves processes like cracking and distillation. In the procedure, hydrocarbons are split into smaller molecules such as ethylene and propylene. These chemicals are widely used in industries such as packaging, construction, automotive, and healthcare, supporting the supply of common and durable products.
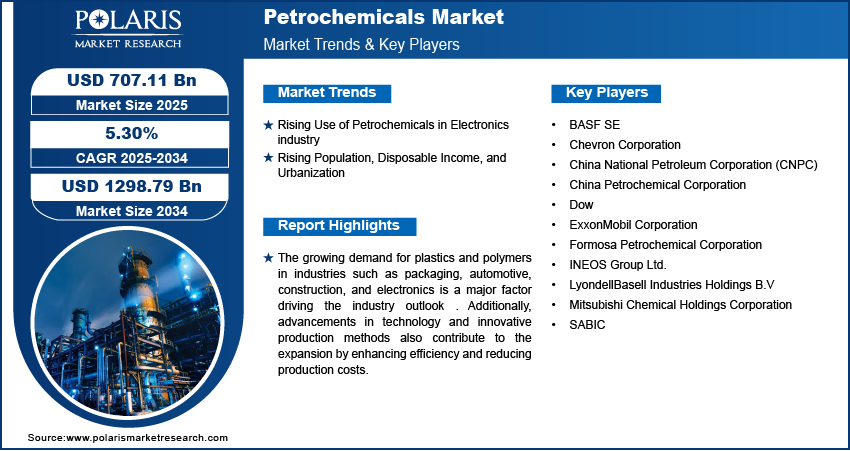
The growing demand for plastics and polymers in industries such as packaging, automotive, construction, and electronics is a major factor driving the industry outlook . Additionally, advancements in technology and innovative production methods also contribute to the expansion by enhancing efficiency and reducing production costs. For instance, In May 2024, Honeywell introduced new NEP technology that enhances energy efficiency and sustainability in petrochemicals production, boosting ethylene and propylene yields while reducing carbon dioxide (CO2) emissions by up to 50%.
Further, market is driven by the increasing use of natural gas as a feedstock. Natural gas, being a cleaner and more abundant source compared to crude oil, is becoming a preferred raw material for petrochemicals production. The shale gas boom in the United States has particularly boosted the availability of cheap natural gas, giving a competitive edge to petrochemicals producers in the region. This shift towards natural gas is also aligned with the global efforts to reduce carbon emissions and promote sustainable practices.
Types & End Uses
| Types | End Uses | |
| Ethylene | Plastics (polyethylene), packaging, pipes | |
| Propylene | Polypropylene, automotive parts, textiles | |
| Benzene | Synthetic fibers, resins, detergents | |
| Methanol | Adhesives, paints, plastics, fuel blending | |
| Butadiene | Synthetic rubber, tires | |
| Xylene | Polyester fibers, plastics, solvents | |
| Toluene | Paints, coatings, chemicals | |
Source: Polaris Market Research Analysis
Market Trends:
Rising Use of Petrochemicals in Electronics industry
The CAGR is being driven by the increasing demand for electronic devices. The proliferation of smartphones, tablets, laptops, and other consumer electronics has seen a notable increase, driven by advancements in technology and shifts in consumer behavior. These devices have become essential in daily life, intensifying the demand for high-quality components, thereby boosting market production.
In addition to consumer demand, ongoing innovation in electronics, particularly in flexible electronics and wearable technology, plays a crucial role. These advancements necessitate materials that can adapt to various shapes and forms while maintaining performance standards. Petrochemicals-derived materials, such as advanced polymers and composites, are favored for these applications due to their lightweight, flexible, and durable properties boosting the industry revenue.
Rising Population, Disposable Income, and Urbanization
The growing demand for petrochemicals products around the world is likely to drive significant expansion in the market in the next years. The demand for products is being driven by factors like population increase, rising disposable income, urbanization, and industrialization in emerging economies. The burgeoning middle class in nations like China and India is driving up demand for cars, building supplies, and consumer products, which is driving up the sector.
Source: Polaris Market Research Analysis
Get Full Segment-Level Forecasts & Insights: Download Sample Report
Segment Insights:
Product Insights:
The product segment includes methanol, propylene, benzene, ethylene, butadiene, xylene, toluene, styrene, and vinyl. The ethylene segment has dominated the industry owing to revenue share of 22.4% in 2025. This is explained by the rising need for ethylene from a number of sectors, including the building, packaging, and transportation industries. Throughout the projection period, rising industrialization and the thriving automotive and packaging sectors in emerging economies like Vietnam, Thailand, India, and Brazil are likely to drive up ethylene demand in those nations. Expanded usage of polyethylene, low-density polyethylene (LDPE), and high-density polyethylene (HDPE) is anticipated to facilitate the general expansion of the market revenue.
The methanol segment is expected to experience the highest CAGR of 6.7% in the market industry over the forecast period. Acetic acid and formaldehyde, which are utilized in foams, adhesives, foams, plywood subfloors, and windshield washer fluids, are produced using methanol as a feedstock. Rising demand for acetic acid and formaldehyde in a number of end-use industries, including construction, paints and adhesives, medicines, plastics, and the automotive industry, drives the need for methanol as a feedstock, further boosting the future of industry ecosystems. For instance, according to estimates provided by the World's Paint and Coatings Industry Association, global sales of paints and coatings exceeded USD 180 billion in 2022. This substantial market size significantly impacts the demand for industry outlook.
End-Use Insights:
The end-use includes electronics, construction, automotive, and packing. In 2025, the packaging industry held the largest proportion of 30.8% of the global petrochemicals market. The growing consumer products sector, the quick development of e-commerce, and the requirement for strong, lightweight packing materials all support the product demand in the packaging space. The food business is a leading factor in the growing demand for plastic packaging, which could lead to segment expansion.
The petrochemicals substance is primarily utilized in pipes, adhesives, and coatings for various construction industry applications, including wiring, flooring, insulation, pipes, and structural elements. The demand for the product is also anticipated to increase due to the expanding need for housing and infrastructure.
Global Petrochemicals Market, Segmental Coverage, 2021 - 2034 (USD Billion)
Source: Polaris Market Research Analysis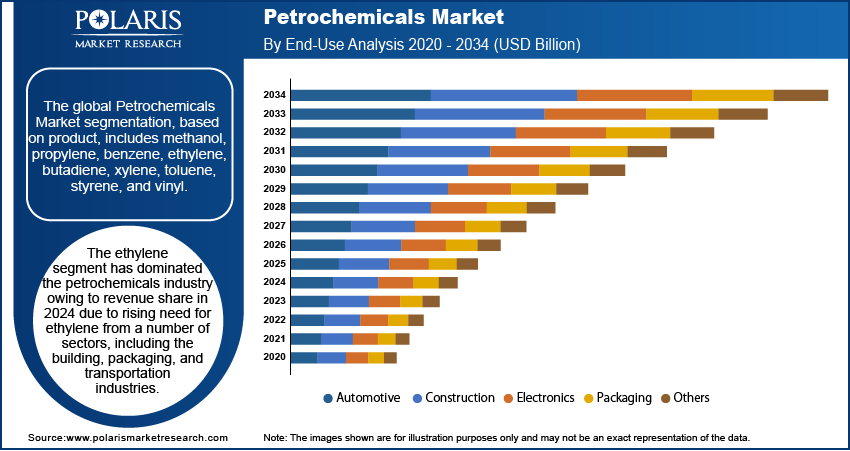
Need Granular Data Across All Market Segments? Request Customization
Source: Secondary Research, Primary Research, PMR Database and Analyst Review
Real-World Applications
- Packaging: Polyethylene and polypropylene are used in plastic bags, food containers, and bottles. They support lightweight and flexible packaging for food and e-commerce.
- Automotive: Polypropylene, synthetic rubber, and nylon are used in bumpers, dashboards, and tires. They help reduce vehicle weight and improve fuel efficiency.
- Textiles: Polyester, nylon, and acrylic fibers are used in clothing, carpets, and upholstery. They provide durability and cost efficiency in fabric production.
Regional Insights:
By region, the study provides insights into North America, Europe, Asia-Pacific, Latin America, and Middle East & Africa. The Asia Pacific region dominated the global market with the largest market share of 52.0% in 2025 and is expected to maintain its dominance over the anticipated period. The growth of the segment market can be largely attributed to the expanding industry of chemicals and simultaneous growth in consumption of polymer. The corporations from the Asia Pacific region are focusing on non-oil feedstock and gas liquids, which are found naturally. The huge market growth for petrochemicals in the region can be expected by working on cost-effectiveness as this petrochemicals industry is too capital-intensive market, as this pricing can be strategized, which can result in exponential growth in the sales of products. Indian petrochemicals industry is experiencing huge growth due to the nation's development and robust expansion in the manufacturing and business sectors by deploying capital for improving its capacity and upgradation in the technology by giant petrochemicals corporations from private ventures and public sector undertakings.
Further, In Asia Pacific, China is expected to grow significantly during the anticipated years, driven by the robust demand from the paints and coatings sector. For instance, according to the World Paint & Coatings Industry Association, the Chinese market expanded by 5.7% in 2022, exceeding USD 45 billion in total sales. This growth positions China to capture a significant 78% market share in East Asia alone for paint & coating, driving the regional market size.
GLOBAL PETROCHEMICALS MARKET, REGIONAL COVERAGE, 2021 - 2034 (USD Billion)
Source: Polaris Market Research Analysis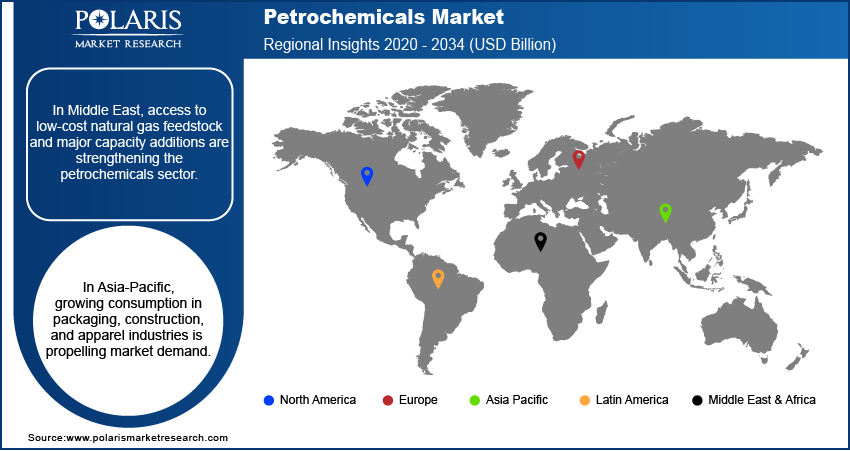
Curious About Regional Market Performance? Request Customization
Source: Secondary Research, Primary Research, PMR Database and Analyst Review
The North America petrochemicals market is expected to boom with a CAGR of 4.5%, due to rising activities of shale gas exploration in countries such as Canada and the U.S. These nations' increasing shale gas production offers the chance to use shale gas instead of conventional feedstock to produce a range of product. Over the projection period, significant capacity additions are anticipated to drive growth in the United States and Canada. Additionally, North America offers low-cost locations for settling up the manufacturing units for the market. This attracts corporations from multiple nations to invest and plan for developing new facilities and contributing to the growth of the area.
Furthermore, the Europe petrochemicals market is expected to be the fastest growing region with a healthy CAGR during the projected period. This is due to the growing recovery for expansion of the oil and gas business in the region. Along with that, the general industrial sector affected by the worldwide pandemic in Europe is expected to propel industry growth. Due to market saturation, slow growth is predicted for Western Europe. The region's major nations, Germany, France, and the United Kingdom, are producing more ethylene, which has increased demand from producers of different industrial chemicals.
Key Market Players & Competitive Insights
Leading key players are investing heavily in research and development in order to expand their product lines, which will help to grow even more. Key participants are also undertaking a variety of strategic activities to expand their global footprint, with important industry developments including new product launches, contractual agreements, mergers and acquisitions, higher investments, and collaboration with other organizations.
Manufacturing locally to minimize operational costs is one of the key business tactics used by manufacturers in the global petrochemicals industry to benefit clients and increase the petr. In recent years, the industry has offered some technological advancements. Major players includes SABIC, ExxonMobil Corporation, BASF SE, Mitsubishi Chemical Holdings Corporation, Formosa Petrochemical Corporation, Chevron Corporation, China National Petroleum Corporation (CNPC), China Petrochemical Corporation, INEOS Group Ltd., LyondellBasell Industries Holdings B.V, and Dow.
BASF SE is a chemical corporation that operates all over the world. It operates through seven segments including chemicals, industrial solutions, materials, surface technologies, nutrition & care, and agricultural solutions, and others. Petrochemicals and intermediates are provided in the chemicals section. Advanced materials and their precursors for applications such as isocyanates and polyamides are available through the Materials section, as well as inorganic basic products and specialties for the plastic and plastic processing industries. In Feb 2024, BASF launched ChemCycling in the U.S., transforming plastic waste into advanced recycled building blocks for sustainable products.
Dow Inc., operating through its subsidiaries, is a provider of materials science solutions worldwide, catering to diverse industries such as packaging, mobility, infrastructure, and consumer applications. The company's operations are organized into three main segments: Industrial Intermediates & Infrastructure, Packaging & Specialty Plastics, and industrial Coatings. The Packaging & Specialty Plastics focuses on delivering a range of products, including ethylene, propylene, polyethylene, and elastomers for applications in mobility, transportation, consumer goods, wire and cable, and construction. The company is headquartered in Midland, Michigan, and has a global presence, serving in the United States, Canada, Europe, the Middle East, Africa, India, the Asia Pacific, and Latin America. In Oct 2023, Dow and Evonik successfully launched a pilot plant in Germany using hydrogen peroxide to produce propylene glycol, enhancing sustainability and reducing environmental impact in chemical manufacturing.
Key Companies:
- BASF SE
- Chevron Corporation
- China National Petroleum Corporation (CNPC)
- China Petrochemical Corporation
- Dow
- ExxonMobil Corporation
- Formosa Petrochemical Corporation
- INEOS Group Ltd.
- LyondellBasell Industries Holdings B.V
- Mitsubishi Chemical Holdings Corporation
- SABIC
Industry Developments
- December 2025 – Larsen & Toubro got a major contract from BPCL for a polyethylene plant in Bina. It will be India’s largest plant of this type. The capacity is 575 kilo tones per annum. It will serve infrastructure, agriculture, packaging, consumer goods, and automotive industries. Source: (ibef.org)
- September 2025 – Sinopec partnered with Aramco to launch a USD 10 billion petrochemical project in Fujian. The facility will produce aromatics with a capacity of 2 MTA. Ethylene capacity is 1.5 MTA. Source: (aramco.com)
- May 2025: The American University in Cairo (AUC) announced the introduction of a new professional diploma in Process Safety Management (PSM) for Egypt’s oil, gas, and petrochemical industries, following the signing of a Memorandum of Understanding (MoU). Source: (aucegypt.edu)
- May 2025: Gelest completed the expansion of its specialty materials production facility in the U.S., boosting manufacturing capabilities to meet growing demand. The project enhanced operational efficiency and reinforced Gelest’s commitment to innovation in advanced materials for global markets. Source: (gelest.com)
Market Segmentation:
Product Outlook
- Methanol
- Propylene
- Benzene
- Ethylene
- Butadiene
- Xylene
- Toluene
- Styrene
- Vinyls
- Others
End-Use Outlook
- Automotive
- Construction
- Electronics
- Packaging
- Others
Regional Outlook
North America
- US
- Canada
Europe
- Germany
- France
- UK
- Italy
- Spain
- Netherlands
- Russia
- Rest of Europe
Asia-Pacific
- China
- Japan
- India
- Malaysia
- South Korea
- Indonesia
- Australia
- Vietnam
- Rest of Asia-Pacific
Middle East & Africa
- Saudi Arabia
- UAE
- Israel
- South Africa
- Rest of Middle East & Africa
Latin America
- Mexico
- Brazil
- Argentina
- Rest of Latin America
Future of Petrochemicals Market
The petrochemicals market is expected to grow due to rising demand from packaging, automotive, and construction sectors. Rising use of natural gas as feedstock is supporting cost efficiency and lower emissions. More and more attention is being paid to new ideas in sustainable and recyclable materials. Demand is expected to increase with the growth of emerging economies and rising urbanization levels. However, environmental rules and problems with plastic waste could slow down future growth.
Petrochemicals Report Scope:
| Report Attributes | Details |
| Market size value in 2025 | USD 695.22 billion |
| Market size value in 2026 | USD 731.48 billion |
| Revenue Forecast in 2034 | USD 1,106.13 billion |
| CAGR | 5.30% from 2026 – 2034 |
| Base year | 2025 |
| Historical data | 2021 – 2024 |
| Forecast period | 2026 – 2034 |
| Quantitative units | Revenue in USD billion and CAGR from 2026 to 2034 |
| Report Coverage | Revenue Forecast, Market Competitive Landscape, Growth Factors, and Trends |
| Segments covered |
|
| Regional scope |
|
| Competitive Landscape |
|
| Report Format |
|
| Customization | Report customization as per your requirements with respect to countries, region, and segmentation. |
Source: Polaris Market Research Analysis
Petrochemicals Market FAQ's
The petrochemicals market revenue in 2025 was valued at USD 695.22.
The market is expected to grow at a CAGR of 5.30% during 2026–2034. The market is projected to reach USD 1,106.13 by 2034.
Petrochemicals are produced from crude oil and natural gas through refining processes. Methods like cracking and distillation break hydrocarbons into smaller molecules.
• Key products include ethylene, propylene, benzene, methanol, and butadiene. These are used to produce plastics, fibers, and industrial chemicals.
Asia Pacific leads due to strong industrial demand and growth. North America and Europe also contribute with steady expansion.
Petrochemicals are used in packaging, automotive, construction, and electronics. They are important for making plastics, coatings, and synthetic materials.
Download Sample Report of Petrochemicals Market
Please fill out the form to request a customized copy of the research report.
