
Pipeline Pigging Services Market Opportunity, Growth Report, 2024-2032
REPORT DETAILS
Market Statistics
Pipeline pigging services market size was valued at USD 9,460.19 million in 2023. The market is anticipated to grow from USD 9,938.87 million in 2024 to USD 14,954.87 million by 2032, exhibiting the CAGR of 5.2% during the forecast period.
Industry Trends
Pipeline pigging services involve the use of pipeline pigs, devices inserted into pipelines to perform various maintenance, inspection, and cleaning tasks. These services are crucial for ensuring the safe and efficient operation of oil and gas pipelines, as well as pipelines in other industries such as water and chemicals. The demand for pipeline pigging services has been steadily growing due to several factors.
Firstly, there is a growing concern regarding pipeline safety and energy infrastructure, driven by incidents such as leaks, spills, and ruptures. As a result, there is increasing pressure from governments and regulatory bodies to ensure the safe and secure transportation of oil and gas. This has led to a higher demand for pipeline-pigging services as companies seek to maintain and monitor their pipelines to prevent accidents and comply with regulations.
Source: Polaris Market Research Analysis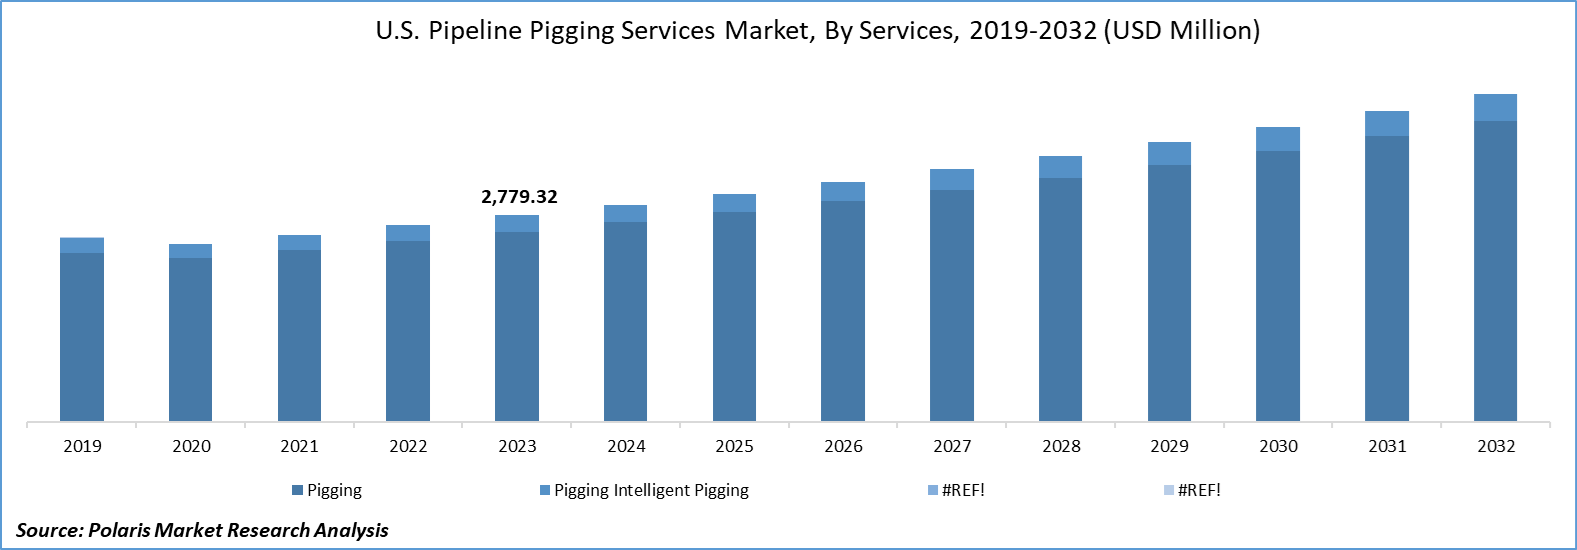
To Understand More About this Research: Download Sample Report
Moreover, the rising application of pipeline pigging services across various end-use industries, particularly oil and gas, has contributed to their increased demand. Pipelines are the primary mode of transportation for oil and gas, and ensuring their integrity and efficiency is essential for the smooth functioning of these industries. Therefore, companies are investing in pipeline-pigging services to optimize their operations and minimize downtime.
Key Takeaways
- North America dominated the market and contributed over 35% market share of the pipeline pigging services market size in 2023
- By services category, the pigging segment dominated the global pipeline pigging services market size in 2023
- By application category, the metal loss/corrosion detection segment is projected to grow with a significant CAGR over the pipeline pigging services market forecast period
What are the market drivers driving the demand for market?
Increasing demand for energy transportation infrastructure
The increasing demand for energy transportation infrastructure is fueling growth in the pipeline-pigging service market. As energy consumption continues to rise globally, there's a heightened need to transport oil, gas, and other fluids efficiently and safely. Pipelines serve as a critical component of this infrastructure, offering a cost-effective and environmentally friendly means of transportation. However, to ensure the smooth operation of these pipelines, regular maintenance and inspection are imperative.
This demand for energy transportation infrastructure directly translates to a surge in the need for pipeline-pigging services. As pipelines age and face challenges such as corrosion, deposit buildup, and integrity issues, the requirement for pigging services becomes even more pronounced. Companies operating in the energy sector increasingly rely on pigging to maximize the lifespan of their pipelines and minimize operational disruptions.
Which factor is restraining the demand for the market?
High initial investment for pigging equipment
The high initial investment required for pigging equipment stands as a major restraint in the pipeline pigging services market, significantly impeding market entry and expansion. Firstly, the cost associated with acquiring specialized pigging tools, such as intelligent pigs or cleaning pigs, constitutes a substantial financial burden for companies seeking to enter the market. These tools are essential for effective pipeline maintenance, inspection, and cleaning, but their procurement demands a considerable upfront investment.
Moreover, in addition to the cost of the pigging tools themselves, there are additional expenses related to training personnel and ensuring compliance with industry standards. Specialized training programs are necessary to educate technicians on the proper handling and utilization of pigging equipment, adding to the overall investment required. Furthermore, ensuring that the equipment meets stringent regulatory requirements further compounds these costs, as non-compliance can result in fines and operational disruptions.
Source: Polaris Market Research Analysis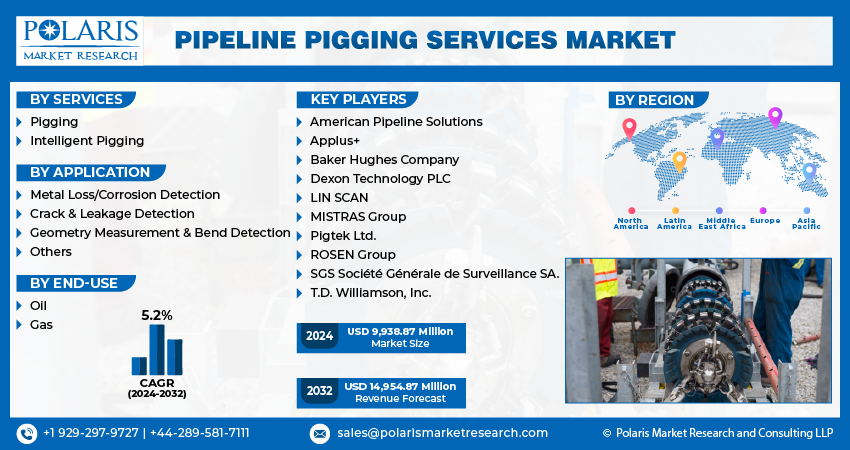
Get Full Segment-Level Forecasts & Insights: Download Sample Report
Report Segmentation
The market is primarily segmented based on services, application, end-use, and region.
| By Services | By Application | By End-Use | By Region |
|
|
|
|
Source: Polaris Market Research Analysis
To Understand the Scope of this Report: Request Customization
Category Wise Insights
By Services Insights
Based on services category analysis, the market has been segmented on the basis of pigging and intelligent pigging. In 2023, pigging emerged as the dominant segment in the global market since pipeline pigging is a critical segment within the oil and gas industry. It involves the use of pipeline pigs, which are devices inserted into pipelines for various purposes, such as cleaning, inspecting, and maintaining the integrity of the pipelines. This segment is integral to ensuring the smooth and efficient operation of pipelines, which are crucial for transporting oil, gas, and other fluids over long distances.
The pipeline pigging services market encompasses a range of activities related to the deployment and operation of pipeline pigs. This includes pigging equipment manufacturing, pigging service providers, and associated technologies for pipeline maintenance and inspection. The primary use of pipeline pigging is for cleaning and removing debris, scale, and other buildups from the inside of pipelines. This helps to maintain the flow capacity of the pipelines and reduces the risk of corrosion and blockages. Additionally, pigs equipped with sensors and cameras are used for inspecting the condition of the pipelines, identifying defects, and ensuring compliance with safety and regulatory standards.
By Application Insights
Based on application category analysis, the market has been segmented on the basis of metal loss/corrosion detection, crack & leakage detection, geometry measurement & bend detection, and others. The metal loss/corrosion detection segment is projected to witness a significant growth rate in the forecasted years since it has a critical application within the pipeline pigging services market, aimed at ensuring the integrity and reliability of pipelines across various industries. This application involves the identification and assessment of areas where metal has been lost due to corrosion, erosion, or other forms of deterioration, which can compromise the structural integrity of the pipeline and pose significant risks such as leaks, environmental contamination, and safety hazards.
Several driving factors contribute to the demand for metal loss and corrosion detection services in the pipeline pigging market. Firstly, stringent regulations and safety standards mandate regular inspection and maintenance of pipelines to ensure compliance and mitigate the risk of accidents or environmental incidents. Aging pipeline infrastructure further underscores the need for comprehensive inspection and monitoring to address corrosion and metal loss issues promptly. Additionally, the increasing complexity and scale of pipeline networks, coupled with the expansion of operations into remote or challenging environments, necessitate advanced inspection technologies to maintain the integrity and reliability of the infrastructure.
Source: Polaris Market Research Analysis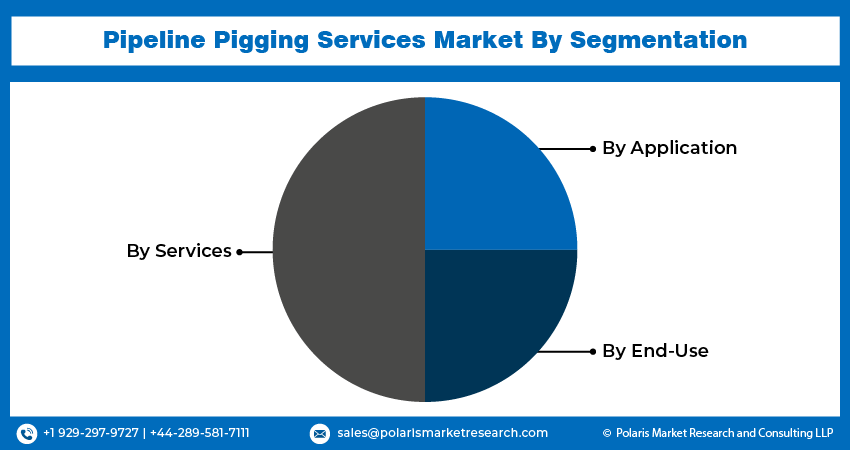
Need Granular Data Across All Market Segments? Request Customization
Regional Insights
North America
North America accounted for the largest revenue share in the global market due to the recent shale revolution, which has spurred a significant increase in the construction of new oil and gas transportation networks. As new supply systems are developed, there will be a heightened market for inline assessment services, including pigging, to underrate pipeline breakdowns. Regulatory management has also implemented policies aimed at lowering spillage and pipeline failures, further boosting the demand for these and ensuring optimal flow efficiency services. For instance, in 2023, the U.S. Pipeline and Hazardous Materials Safety Administration (PHMSA) mandated the periodic inspection and cleaning of pipelines using pigging services. PHMSA has earmarked a $13.5 million increase in pipeline safety operations, specifically targeting the enhancement of safety checks and the reduction of adverse climate and environmental impacts. This strategic investment will enable PHMSA to play a pivotal role in supporting the President's climate change agenda by reducing methane emissions in the oil and gas sector and bolstering oversight of liquefied natural gas (LNG) operations.
Asia Pacific
The Asia Pacific market is anticipated to exhibit the highest CAGR over the forecasting years. The market in the Asia Pacific APAC region is currently undergoing rapid expansion, driven by several key factors, such as the escalating demand for pipeline maintenance and repair solutions across the region. This surge is propelled by the burgeoning number of oil and gas pipelines, necessitating efficient and cost-effective maintenance services. The adoption of pipeline-pigging services further fuels market growth. Pipeline pigging, renowned for its cost-effectiveness and efficiency, is increasingly favored in the region for its ability to clean and inspect pipelines thoroughly. Furthermore, the agreement between countries for natural gas supply through extensive pipelines spanning numerous kilometers significantly contributes to the demand for pipeline pigging services for maintenance, thus driving the market.
Source: Polaris Market Research Analysis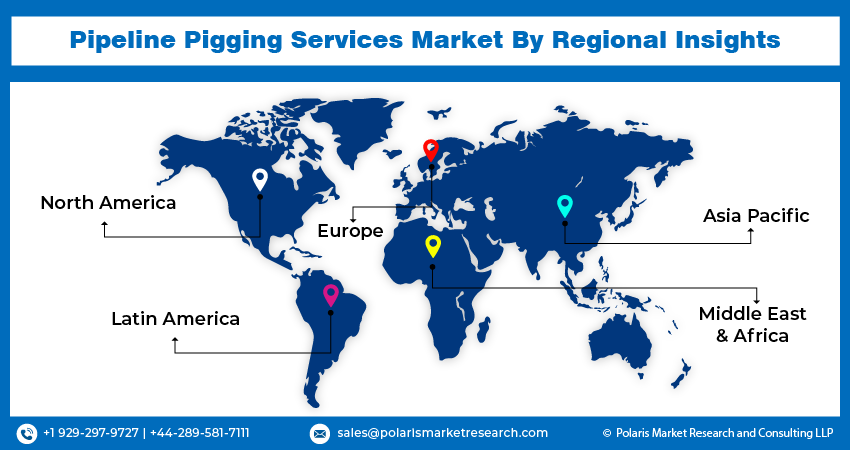
Curious About Regional Market Performance? Request Customization
Competitive Landscape
The competitive landscape of the pipeline-pigging services market is marked by the presence of several key players vying for market share through strategies such as mergers and acquisitions, partnerships, and geographic expansions. These companies offer a wide range of pipeline pigging services, including cleaning, inspection, and maintenance, catering to the diverse needs of industries.
Some of the major players operating in the global market include:
- American Pipeline Solutions
- Applus+
- Baker Hughes Company
- Dexon Technology PLC
- LIN SCAN
- MISTRAS Group
- Pigtek Ltd.
- ROSEN Group
- SGS Société Générale de Surveillance SA.
- T.D. Williamson, Inc.
Recent Developments
- February 2025: Saipem and Subsea7 announced plans to combine operations under Saipem7, forming a USD 21.9 billion (EUR 20 billion) revenue leader with a 60-vessel construction fleet focused on delivering integrated offshore pipeline solutions.
- January 2025: Baker Hughes launched the SureCONNECT FE downhole wet-mate system, expanding its subsea connection portfolio to support deepwater flowline applications.
- In February 2024, Dexon Technology PLC announced the official launch of Dexon Technology Europe GmbH. This new subsidiary, based in Stutensee, Germany, will operate as Dexon's European center of excellence for in-line inspection.
- In February 2024, SGS has recently incorporated the Magnetic Flux Leakage (MFL) technique into its non-destructive testing solutions for the oil, gas, and energy sector in the United Arab Emirates. This new technique enables inspectors in the UAE to accurately determine the depth of wall thickness caused by corrosion and erosion.
- In August 2023, ROSEN partnered with Speir Hunter, a provider of pipeline inspection and integrity management services. This strategic alliance aims to meet the growing demand for high-quality pipeline inspections and integrity assessments.
- In August 2022, Baker Hughes announced its plan to acquire Quest Integrity, a subsidiary of Team, Inc. Quest Integrity is a global provider of advanced asset inspection and reliability management solutions technology. The company specializes in serving various sectors such as pipeline, refining, petrochemical, and power generation.
Report Coverage
The pipeline pigging services market report emphasizes on key regions across the globe to provide better understanding of the product to the users. Also, the report provides market insights into recent developments, trends and analyzes the technologies that are gaining traction around the globe. Furthermore, the report covers in-depth qualitative analysis pertaining to various paradigm shifts associated with the transformation of these solutions.
The report provides detailed analysis of the market while focusing on various key aspects such as competitive analysis, services, application, end-use, and their futuristic growth opportunities.
Pipeline Pigging Services Market Report Scope
| Report Attributes | Details |
| Market size value in 2024 | USD 9,938.87 million |
| Revenue forecast in 2032 | USD 14,954.87 million |
| CAGR | 5.2% from 2024 – 2032 |
| Base year | 2023 |
| Historical data | 2019 – 2022 |
| Forecast period | 2024 – 2032 |
| Quantitative units | Revenue in USD million and CAGR from 2024 to 2032 |
| Segments covered | By Services, By Application, By End-Use, By Region |
| Regional scope | North America, Europe, Asia Pacific, Latin America; Middle East & Africa |
| Customization | Report customization as per your requirements with respect to countries, region and segmentation. |
Source: Polaris Market Research Analysis
Pipeline Pigging Services Market FAQ's
key companies in Pipeline Pigging Services Market are American Pipeline Solutions, Applus+, Baker Hughes Company, Dexon Technology PLC
Pipeline pigging services market exhibiting the CAGR of 5.2% during the forecast period.
The Pipeline Pigging Services Market report covering key segments are services, application, end-use, and region.
key driving factors in Pipeline Pigging Services Market are Increasing demand for energy transportation infrastructure
The global pipeline pigging services market size is expected to reach USD 14,954.87 Million by 2032
Download Sample Report of Pipeline Pigging Services Market
Please fill out the form to request a customized copy of the research report.
