
Point of Entry Water Treatment System Market Size Report, 2026-2034
REPORT DETAILS
Market Statistics
What Point of Entry Water Treatment Systems Market Size?
Point of entry water treatment systems market size was valued at USD 10.47 billion in 2025 and is anticipated to exhibit the CAGR of 4.7% during the forecast period.
Market Statistics
- 2025 Market Size: USD 10.47 Billion
- 2034 Projected Market Size: USD 15.82 Billion
- CAGR (2026-2034): 4.7%
- Largest Market: Asia Pacific
Market Overview
Rising demand for efficient water treatment systems across the globe as a result of drastic increase in population and growing water pollution particularly in urban areas, driving the global market growth. Also, the rising levels of contaminations that led to increased presence of heavy metals, chemicals, and microorganisms in water bodies, resulting in greater adoption of water treatment systems worldwide.
For instance, according to a report published by The Environmental Integrity Project, over 700,000 miles of waterways and around 51% of assessed river and stream miles in the United States are impaired by the pollution.
Source: Polaris Market Research Analysis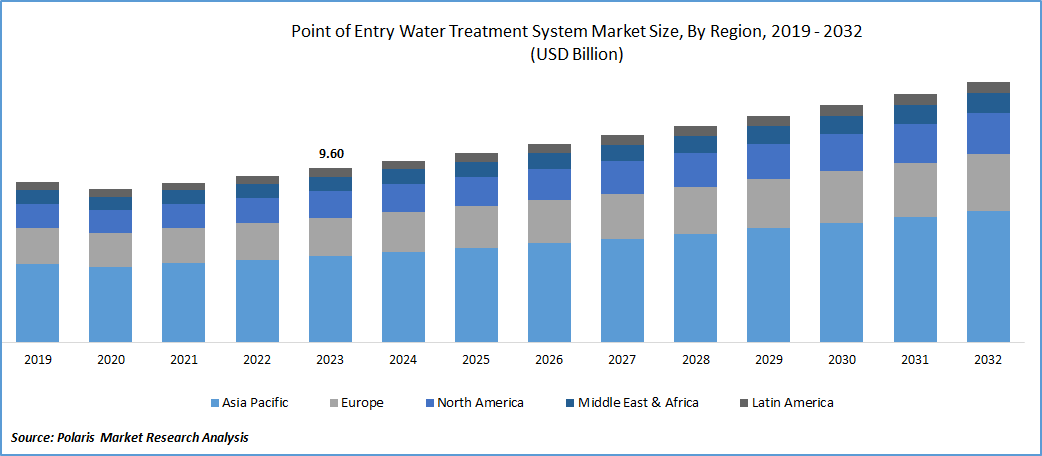
To Understand More About this Research: Download Sample Report
These water treatment systems are being increasingly used or installed at both residential and commercial places for various purposes including under the counter of kitchens, faucets, bathroom showers, and others. Due to their less volume treatment, they are highly considered as an ideal solution of last stage water purification in homes or light commercial buildings. Beside this, growing innovations in water treatment technologies such as integration of smart sensors and modular systems, could open lucrative growth opportunities for the market.
The market research report offers an in-depth analysis of the industry to support informed decision-making. It offers a meticulous breakdown of various market niches and keeps readers updated on the latest industry developments. Along with tracking the Point of Entry Water Treatment Systems Market on the basis of SWOT and Porter’s Five Forces models, the research report includes graphs, tables, charts, and other pictorial representations to help readers understand the key insights and important data easily.
Source: Polaris Market Research Analysis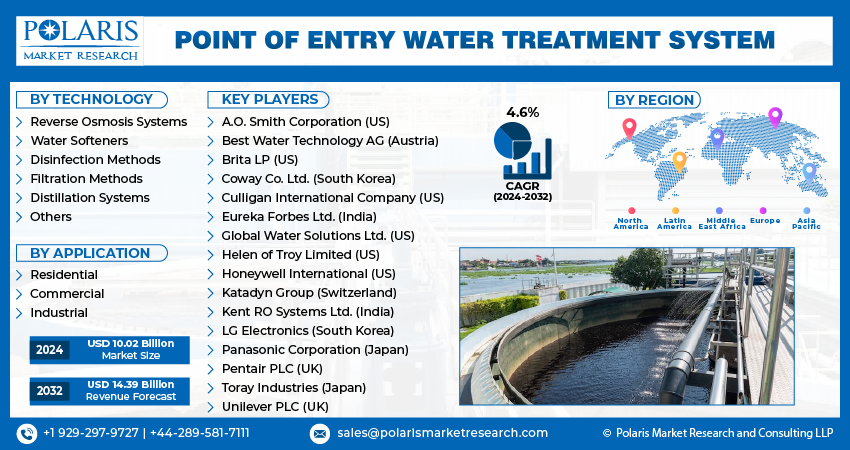
Get Full Segment-Level Forecasts & Insights: Download Sample Report
Market Trends
Growth Factors
Growing Awareness for the Usage of Clean and Treated Water to Drive Market Growth
The rising awareness among general public about the importance of intaking clean or treated water is significantly contributing to global market growth. As people worldwide are becoming aware of numerous waterborne diseases caused by the consumption of uncleaned water, they are increasingly demand efficient point of entry water treatment systems because of their ability to provide safe and clean water.
For instance, according to the BMC Public Health, more than 37.7 million people in India are estimated to suffer with waterborne diseases each year, and waterborne diseases causes 1.5 million children deaths every year.
Scarcity of Clean Water Mainly in Underdeveloped Countries Likely to Spur Market Growth
As the number of people suffering with the availability of safe and clean water especially in underdeveloped or developing is increasing rapidly, the need for efficient water treatment systems to fulfill the requirements of global population is also rises. For instance, as per a report published by the UNICEF, more than 4 billion people across the globe experience severe water scarcity for at-least one month every year. And, half of world’s population is expected to be live in areas with water scarcity by 2025.
Restraining Factors
High Initial Costs and Complex Installation Process are Expected to Hamper Global Market Growth
The high initial or upfront costs associated with the purchasing and setting-up of point of entry water treatment systems and high complexity of installation process of such water treatment systems, are among the factors which could hamper global market growth.
Key Trends in Point of Entry Water Treatment Systems
| Trend | Description | Key Drivers | Examples from Practice |
| NSF/ANSI 401 certification for emerging contaminants | POE systems certified to reduce 15+ emerging chemicals (pharmaceuticals, personal care products, pesticides like BPA, ibuprofen, carbamazepine). | Whole‑house units treating pharmaceuticals, hormones, and plasticizers at entry point, beyond traditional aesthetic/health standards (NSF 42/53). | NSF/ANSI 401 verifies POE/POU systems reduce emerging contaminants; lists 15 targets including Atenolol, Estrone, Nonylphenol for certified treatment units. |
| PFAS removal via GAC and RO (NSF/ANSI 53, 58) | POE systems using granular activated carbon (GAC) or reverse osmosis certified to NSF/ANSI 53/58 for PFOA/PFOS reduction below 70 ppt. | Multi‑stage whole‑house treatment for "forever chemicals" at main inlet, addressing EPA MCLs for PFOA, PFOS, PFNA, PFHxS, HFPO‑DA, PFBS mixtures. | EPA studies confirm commercial GAC/RO POE systems remove PFAS affordably under NSF guidelines; NSF/ANSI 53 covers lead, forever chemicals in POE. |
| IoT‑SCADA integration for smart monitoring | POE units with sensors (pH, TDS, turbidity, flow) linked to IoT/SCADA for real‑time data, predictive maintenance, and remote control. | Automated adjustment of filtration/softening based on water quality, leak alerts, and cloud analytics for residential whole‑house systems. | IoT‑SCADA systems enable remote monitoring/control of treatment processes, using sensors for quality parameters and DBNs for predictive analytics. Studies show real‑time monitoring with 0.1–0.2 error margins. |
| NSF/ANSI 44 for efficient water softeners | Cation exchange softeners certified for hardness reduction, scale control, and trace metal removal with optimized salt efficiency. | Whole‑house softening at entry to prevent scale in pipes/appliances, using NSF‑certified regenerants (NaCl/KCl). | NSF/ANSI 44 sets benchmarks for POE softeners on hardness capacity, salt efficiency, and pressure drop; widely referenced for residential systems. |
| Multi‑barrier POE for broad contaminant control | Integrated POE trains combining sediment/carbon filtration, softening, UV, or RO for aesthetic, health, and microbial protection. | Comprehensive whole‑house treatment mirroring centralized plants but scaled for homes, certified to NSF 42 (chlorine/taste), 53 (lead/pathogens), 55 (UV). | WVU extension notes POE uses filtration, softening, RO, UV like large plants for contaminants; Mass.gov requires NSF 53/58 for POE devices. |
| Advanced oxidation for organics/pathogens | Emerging POE AOPs using UV/H2O2 or ozone for recalcitrant organics and microbes, often pre/post carbon filtration. | Oxidizing pharmaceuticals, pesticides, pathogens at entry; supplements GAC/RO for complete barrier against emerging threats. | Reviews detail AOPs (UV, ozone) as effective for microbial/organic removal in decentralized systems like POE. |
Source: Polaris Market Research Analysis
Report Segmentation
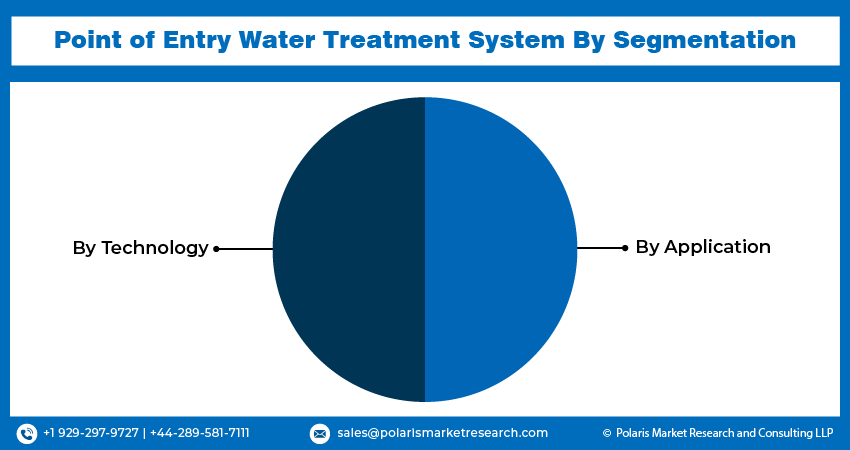
The market is primarily segmented based on technology, application, and region.
| By Technology | By Application | By Region |
|
|
|
Source: Polaris Market Research Analysis
To Understand the Scope of this Report: Request Customization
By Technology Insights
Reverse Osmosis Systems Segment Captured Largest Share in 2025
The reverse osmosis systems segment captured largest share. Segment’s dominance is accelerated by its growing adoption as it helps in eliminating several aqueous salts and metal ions such as chromium, copper, lead, sodium, and chloride. Additionally, these water treatment systems are highly versatile and find numerous applications in both residential and commercial settings, which positively influences segment’s growth.
The distillation systems segment will grow at highest growth rate. This growth is attributed to growing use of distilled water in wide range of applications including cooking, drinking, bathing, cleaning, and laundry. Their effectiveness in eliminating various specific contaminants like volatile organic compounds and heavy metals, has also been creating substantial demand for these treatment systems.
By Application Insights
Industrial Segment Held the Majority Revenue Share in 2025
The industrial segment held the majority revenue share. This dominance is attributed to continuous expansion of various water-using industries such as chemicals, food & beverages, and textiles, as increasingly realizing the importance of treated water for their processes. Growing industrialization especially in developing nations that led to increased demand for clean water in several industrial processes, further contribute to the demand for reliable water treatment systems.
For instance, according to USDA, industrial water uses accounts for approx. 22 percent of world’s total water consumption. And, in the United States, industry is the second largest water consumer with around 40 percent of water consumption.
Source: Polaris Market Research Analysis
Need Granular Data Across All Market Segments? Request Customization
Regional Insights
Asia Pacific Region Dominated the Global Market in 2025
The Asia Pacific region dominated the global market. Region’s dominance is accelerated by the higher concentration of industrial end-users and significant increase in the implementation of efficient water treatment systems to meet both industrial and residential needs. Additionally, a significant portion of APAC region is suffering with water scarcity and have very limited access to clean water, thereby, fueling the adoption of water treatment systems in order to maximize the use of available water resources.
For instance, as per a report by the Asian Development Bank, more than 75% of Asia is water insecure, and over 90% of region’s population is suffering with imminent water crisis.
The North America region is anticipated to emerge as fastest growing region. This growth is due to robust presence of large-scale commercial manufacturers and region’s high penetration of innovative water treatment systems. Growing stringent regulations and standards regarding the water quality and safety that are imposed by several regulatory authorities is further escalating the demand for treatment systems in the region. For instance, United States Environmental Protection Agency, announced that they have set legal limits on more than 90 contaminants in drinking water. Also, the agency set water-testing schedules and methods that must be followed by water systems.
Source: Polaris Market Research Analysis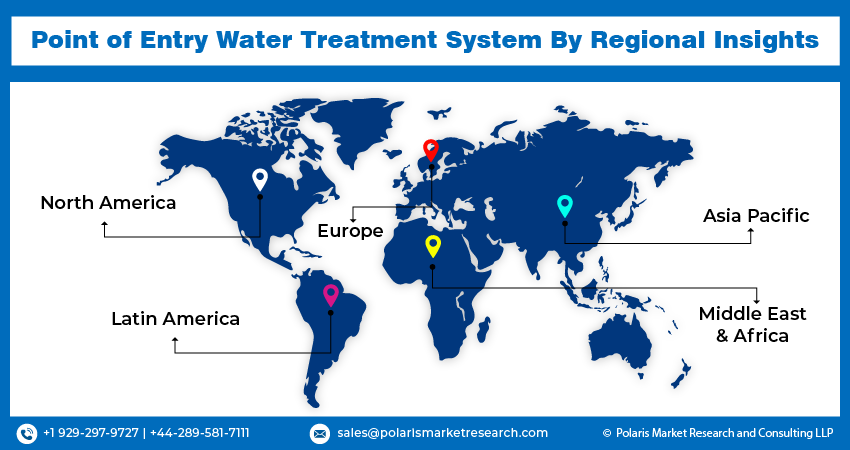
Curious About Regional Market Performance? Request Customization
Key Market Players & Competitive Insights
Developing improved water purification technologies to drive market competition
The point of entry water treatment systems market is moderately competitive in nature with the robust presence of several regional and global players. Key companies are competing on various factors such as improvements in water purification technologies, improving system performance, developing easily and user-friendly installable systems, and enhancing durability & longevity of their product offerings, that helps them gain a competitive edge in the market over the competitors. For instance, in December 2023, Cyclopure, introduced its two new home filters to remove PFAS (per-and-polyfluoroalkyl substances) from the household water named “Purefast Home80 and Purefast Home20.
Some of the major players operating in the global market include:
- A.O. Smith Corporation (US)
- Best Water Technology AG (Austria)
- Brita LP (US)
- Coway Co. Ltd. (South Korea)
- Culligan International Company (US)
- Eureka Forbes Ltd. (India)
- Global Water Solutions Ltd. (US)
- Helen of Troy Limited (US)
- Honeywell International (US)
- Katadyn Group (Switzerland)
- Kent RO Systems Ltd. (India)
- LG Electronics (South Korea)
- Panasonic Corporation (Japan)
- Pentair PLC (UK)
- Toray Industries (Japan)
- Unilever PLC (UK)
Recent Developments in the Industry
- In November 2023, Clear Comfort announced the launch of CCW2000 Series, that mainly aims to deliver the highest available standards of water efficiency, quality, and also plant-nutrient delivery. The new solution is powered by the patented Hydroxyl-based AOP (Advanced Oxidation Process) and DO (Dissolved Oxygen) technology.
- In November 2023, OSG Japan unveiled its newly designed innovated water purification system in India, that is developed in collaboration with Purever. The system is specially engineered to elevate the water quality and facilitate the easy absorption by the body.
-
In August 2023: Mentice launched the latest EU version of its Ankyras app, helping interventional neuroradiologists select optimal flow diverters for brain aneurysm treatment.
-
In July 2023: MicroVention reported successful treatment of over 1,000 patients in collaboration with U.S. physicians using the FDA-approved FRED X flow diverter designed for small vessels.
Report Coverage
The point of entry water treatment systems market report emphasizes on key regions across the globe to provide better understanding of the product to the users. Also, the report provides market insights into recent developments, trends and analyzes the technologies that are gaining traction around the globe. Furthermore, the report covers in-depth qualitative analysis pertaining to various paradigm shifts associated with the transformation of these solutions.
The report provides detailed analysis of the market while focusing on various key aspects such as competitive analysis, technology, application, and their futuristic growth opportunities.
Point of Entry Water Treatment Systems Market Report Scope
| Report Attributes | Details |
| Market size in 2025 | USD 10.47 billion |
| Market size in 2026 | USD 10.94 billion |
| Revenue forecast in 2034 | USD 15.82 billion |
| CAGR | 4.7% from 2026 – 2034 |
| Base year | 2025 |
| Historical data | 2021 – 2024 |
| Forecast period | 2026 – 2034 |
| Quantitative units | Revenue in USD billion and CAGR from 2026 to 2034 |
| Segments covered |
|
| Regional scope |
|
| Competitive Landscape |
|
| Report Format |
|
| Customization | Report customization as per your requirements with respect to countries, region, and segmentation. |
Source: Polaris Market Research Analysis
Point of Entry Water Treatment System Market FAQ's
Best Water Technology, Honeywell International, Kent RO Systems, Culligan International Company are the key companies in Point of Entry Water Treatment System Market
Point of entry water treatment systems market exhibiting the CAGR of 4.7% during the forecast period.
The Point of Entry Water Treatment System Market report covering key segments are technology, application, and region.
Growing awareness for the usage of clean and treated water to drive market growth are the key driving factors in Point of Entry Water Treatment System Market
The global point of entry water treatment systems market size is expected to reach USD 15.82 billion by 2034
Download Sample Report of Point of Entry Water Treatment System Market
Please fill out the form to request a customized copy of the research report.
