
Power Monitoring Market Size, Share Analysis Report, 2025-2034
REPORT DETAILS
Market Statistics
Market Overview
The power monitoring market size was USD 4.89 billion in 2024. The market is expected to grow at a CAGR of 6.28% from 2025 to 2034. Rising energy costs, stringent government regulations and sustainability initiatives, and increasing inclination toward renewable energy are among the prominent factors driving the demand for these monitoring solutions and services.
Market Insights
- The hardware segment accounted for the largest share of the power monitoring market in 2024, due to the widespread use of smart meters, sensors, and other measuring systems across industrial and commercial facilities, as well as utilities.
- The manufacturing & process industry held the largest share among all end use segments in 2024. With high energy consumption driving the need for operational efficiency, various industries are adopting monitoring solutions to track power usage and reduce energy waste.
- North America dominated the global power monitoring landscape in 2024, primarily driven by a surge in grid modernization initiatives and the growing integration of renewable energy sources.
- The market in Asia Pacific is expected to experience impressive growth during the forecast period, owing to rapid industrialization and urbanization.
Market Dynamics
- Stringent government regulations and sustainability initiatives, including energy efficiency policies, carbon reduction targets, and environmental standards, boost the implementation of power monitoring solutions worldwide.
- A constant burden on businesses and utilities to optimize power consumption and reduce energy costs in response to soaring energy prices fuels the power monitoring market.
- A shift toward renewable energy sources, such as solar, wind, and hydropower, is creating new growth opportunities for companies in the power monitoring industry.
- IoT-based monitoring aided by smart meters, wireless sensors, and cloud-based analytics is unlocking new trends in the market, as it enables utilities and businesses to optimize electricity distribution and reduce energy losses.
Market Statistics
Market Size in 2024: USD 4.89 billion
Source: Polaris Market Research Analysis
Projected Market Size in 2034: USD 8.93 billionSource: Polaris Market Research Analysis
CAGR, 2025–2034: 6.28%Source: Polaris Market Research Analysis
Largest Market in 2024: North AmericaAI Impact on Power Monitoring Market
- AI algorithms predict failures in transformers, switchgear, and meters by analyzing their performance and energy usage data, in turn reducing downtime and maintenance costs.
- Machine learning models detect irregularities in power utilization, fluctuations in voltage levels, or load imbalances, improving the reliability and safety of grids.
- Smart grid monitoring, leveraging AI and IoT, enables flexible energy distribution, supports the integration of renewable energy, and stabilizes power flow in complex networks.
- AI-powered analytics provide actionable insights into power consumption trends across facilities, enabling enterprises to implement targeted energy efficiency strategies.
- AI tools enhance threat detection activities and facilitate responses against cyberattacks targeting smart grids and monitoring systems.
Source: Polaris Market Research Analysis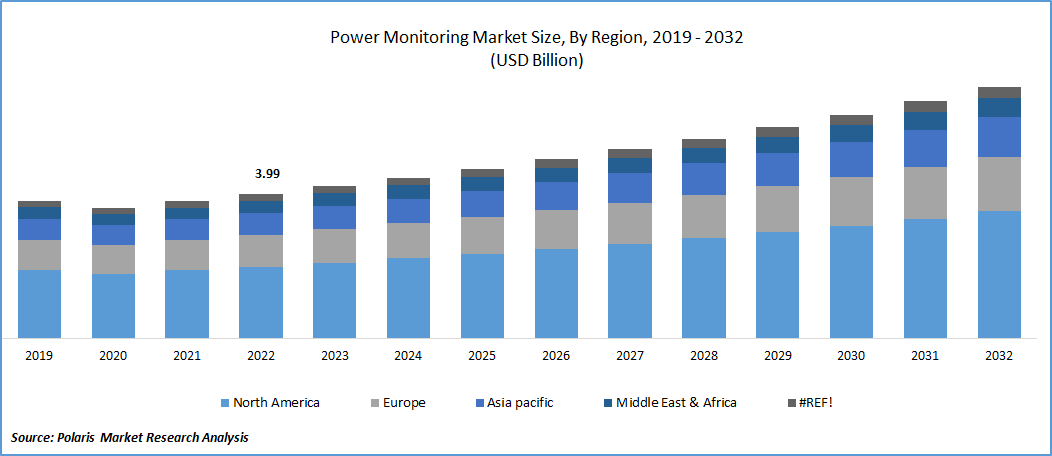
To Understand More About this Research: Download Sample Report
The global power monitoring industry focuses on systems and solutions that track, analyze, and manage electrical power usage in real time. These systems consist of hardware such as meters, sensors, and circuit monitors, as well as software for data analytics and reporting. Power monitoring solutions are used across various sectors, including industrial, commercial, residential, and utility applications, to optimize energy consumption, reduce operational costs, and ensure reliable power distribution. One of the primary benefits of power monitoring is improved energy efficiency. Power monitoring systems help businesses and consumers identify areas of high consumption and implement energy-saving measures by providing real-time insights into power usage. This leads to lower electricity costs and reduced environmental impact, aligning with global initiatives for sustainable energy management.
The integration of smart grids with IoT-enabled power monitoring solutions is revolutionizing the way energy is managed. IoT-based monitoring devices, such as smart meters, wireless sensors, and cloud-based analytics platforms, are providing a clear visibility into power usage, enabling utilities and businesses to optimize electricity distribution and reduce energy losses.
The rising energy cost globally is driving market growth. Businesses and utilities are under pressure to optimize power consumption to reduce energy cost. Power monitoring systems address these challenges by helping businesses and utilities track energy usage in real-time, identify inefficiencies, and implement corrective measures to reduce electricity bills. Industries with high energy consumption, such as manufacturing, data centers, and commercial buildings, are widely adopting power monitoring for long-term cost savings. Therefore, as energy cost increases globally, the demand for power monitoring solutions also rises.
Industry Dynamics
Stringent Government Regulations and Sustainability Initiatives
Governments and regulatory bodies worldwide are implementing strict energy efficiency policies, carbon reduction targets, and environmental standards, compelling businesses to adopt power monitoring systems. Regulations such as the European Energy Efficiency Directive (EED), U.S. Energy Policy Act, and China’s Energy Conservation Law require industries and commercial buildings to track and report energy consumption to ensure compliance. These policies are driving the adoption of power monitoring solutions that enable real-time energy tracking, reporting, and optimization. solutions that enable real-time energy tracking, reporting, and optimization. Moreover, global sustainability initiatives, such as net-zero carbon goals, the Paris Agreement, and corporate ESG commitments, are encouraging businesses to adopt power monitoring technologies.
Expansion of Renewable Energy Projects
The global shift toward renewable energy sources such as solar, wind, and hydropower is creating new opportunities for power monitoring solutions. The intermittent nature of renewable energy generation is making power monitoring essential for balancing supply and demand, optimizing grid integration, and improving energy storage efficiency. Therefore, as countries across Europe, North America, and Asia Pacific invest in large-scale renewable energy projects, the demand for power monitoring solutions is projected to increase in the coming years to ensure the stability and reliability of renewable energy grids.
Source: Polaris Market Research Analysis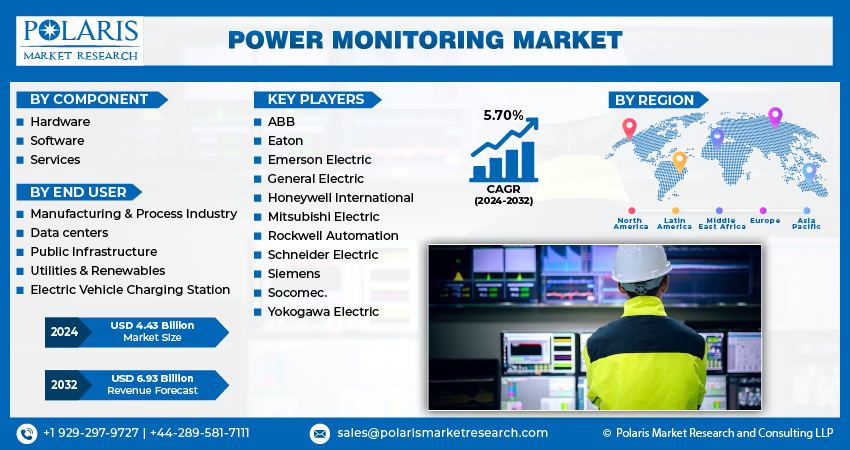
Get Full Segment-Level Forecasts & Insights: Download Sample Report
Segmental Insights
By Component Analysis
Based on component, the market is divided into hardware, software, and services. The hardware segment accounted for 48.95% revenue market share in 2024 due to widespread deployment of smart meters, sensors, and other measuring instruments across industrial, commercial, and utility sectors. Industrial facilities increasingly adopt advanced hardware solutions to monitor energy usage in real-time, minimize downtime, and enhance equipment performance. The growing need to reduce operational costs and comply with energy efficiency regulations also contributed to the dominance of the segment. Rapid urbanization and the modernization of electrical infrastructure in developing countries such as India and Brazil further boosted demand for hardware devices. The World Bank, in its report, stated that India’s urban population is expected to reach 40% by 2036.
The software segment is projected to reach USD 2.83 billion by 2034. This growth is attributed to the rising digitization and the integration of IoT and cloud technologies into energy systems. Organizations are widely adopting software solutions to gain actionable insights, optimize energy usage, and meet sustainability goals. Additionally, rising concerns about carbon emissions and energy wastage are fueling investments in intelligent software platforms that support real-time monitoring and decision-making.
By End User Analysis
Based on end user, the market is divided into manufacturing & process industry, data centers, public infrastructure, utilities & renewables, and electric vehicle charging stations. The manufacturing & process industry segment held 32.05% revenue share in 2024 due to high energy consumption and a critical need for operational efficiency. Various industries such as automotive, chemicals, food and beverage, and pharmaceuticals increasingly adopted monitoring solutions to track power usage, reduce energy waste, and maintain equipment reliability. The push for cost reduction, combined with strict regulatory requirements on energy efficiency and emissions, led manufacturers to invest heavily in power monitoring systems that offer real-time visibility and control over electrical consumption. The rise of Industry 4.0 and the integration of smart factory technologies further propelled the adoption of power monitoring tools within the manufacturing & process industry.
The data center segment is expected to reach USD 1.83 billion in 2034 at a CAGR of 6.89%, owing to exponential growth of digital services, cloud computing, and artificial intelligence. Data centers require continuous, reliable, and optimized power usage to prevent downtime and maintain server performance. This is driving operators to adopt advanced power monitoring systems to monitor load distribution, detect inefficiencies, and support sustainability goals through carbon footprint reduction. The increasing focus on green data centers, along with stringent environmental regulations, is fueling the demand for power monitoring solutions in data centers.
Source: Polaris Market Research Analysis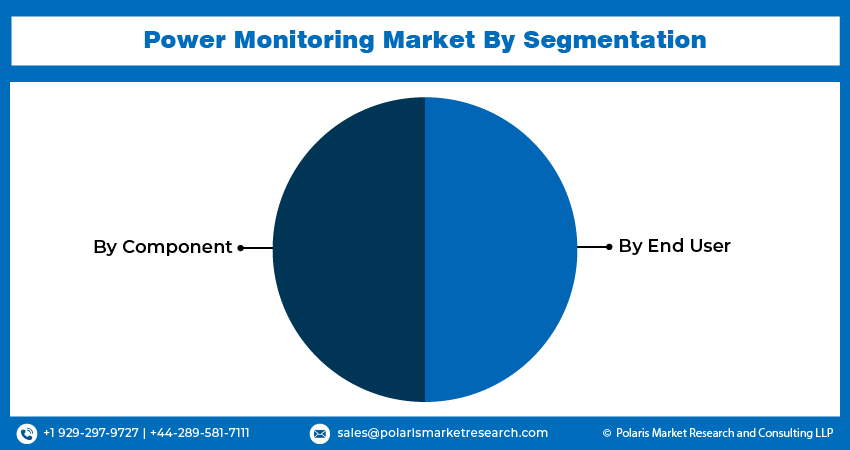
Need Granular Data Across All Market Segments? Request Customization
Regional Analysis
The North America power monitoring market dominated the market in 2024, holding 38.11% global market share. This dominance is attributed to the increasing need for energy efficiency, grid modernization, and the integration of renewable energy sources. Aging power infrastructure and the rise of smart grids in the region necessitated the use of power monitoring tools to prevent outages and optimize energy consumption. Strict government regulations and sustainability goals, such as reducing carbon emissions also encouraged industries and utilities to adopt advanced power monitoring systems. Additionally, the growth of data centers, increasing electric vehicle (EV) sales, and industrial automation in the region fueled the need for reliable power quality and consumption analytics solutions such as power monitoring. For instance, the International Energy Agency in its report stated that the electric car sales increased to 1.6 million in the US in 2024.
US Power Monitoring Market Insight
The US accounted for 78.32% revenue share in 2024, due to the expansion of smart cities, IoT-enabled energy management, and federal initiatives promoting clean energy. The rise of distributed energy resources (DERs), such as solar and wind, in the US propelled the use of power monitoring devices to ensure grid stability. Many industries such as manufacturing, healthcare, and IT heavily relied on power monitoring in 2024 to enhance operational efficiency and reduce downtime. Furthermore, increased cyber threats in the US to critical infrastructure drove investments in secure, real-time power monitoring solutions to safeguard the grid.
Asia Pacific Power Monitoring Market Overview
The market in Asia Pacific is projected to reach USD 2.23 billion by 2034, owing to rapid industrialization and urbanization. Countries such as China, Japan, and South Korea are investing heavily in smart grids and renewable energy integration, necessitating the use of advanced power monitoring systems. The growing adoption of electric vehicles and data centers in the region is also contributing to power monitoring demand. The International Energy Agency, in its report, stated that electric car sales in China increased by almost 40% year-on-year in 2024. Additionally, governments in the region are implementing stringent energy efficiency regulations, pushing commercial and industrial sectors to deploy energy monitoring solutions for cost savings and compliance, leading to market growth.
India Power Monitoring Market Evaluation
In India, power monitoring demand is driven by the need to reduce transmission and distribution (T&D) losses, improve grid reliability, and expand renewable energy adoption. Government initiatives such as the Smart Cities Mission and UDAY Scheme are emphasizing energy efficiency, boosting the adoption of monitoring technologies. The industrial and commercial sectors in the country are also increasingly using power monitoring tools to optimize consumption and reduce costs. Frequent power outages and the push for solar energy integration are further fueling the need for power monitoring solutions in India.
Europe Power Monitoring Market Insight
The market in Europe is projected to hold 27.47% revenue share in 2034 due to stringent EU regulations on energy efficiency and carbon neutrality. The rise of electric vehicles and smart home technologies is contributing to market growth in Europe. Additionally, industries in the region are adopting IoT-based energy management systems to comply with sustainability mandates and reduce operational costs. Investments in smart grids and microgrids are further driving the need for advanced power monitoring solutions.
Source: Polaris Market Research Analysis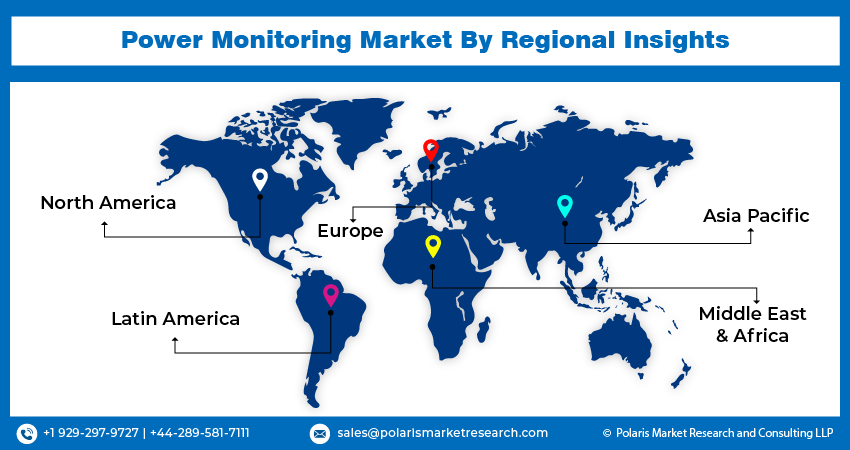
Curious About Regional Market Performance? Request Customization
Key Players & Competitive Analysis Report
The power monitoring industry is highly competitive, characterized by the presence of established global players and emerging regional competitors striving to enhance efficiency, reliability, and smart energy management. A few major companies such as ABB, Schneider Electric, Siemens AG, Eaton, and Honeywell International Inc. dominate the industry, leveraging their extensive product portfolios, strong R&D capabilities, and global distribution networks. These players focus on integrating advanced technologies such as IoT, AI, and cloud computing into their power monitoring solutions to provide real-time data analytics, predictive maintenance, and energy optimization. Competitive strategies further include mergers, acquisitions, and partnerships to enhance technological capabilities and expand product reach.
Prominent companies operating in the power monitoring industry include ABB; Eaton; Emerson Electric Co; General Electric (GE); Honeywell International Inc.; MachineQ; Mitsubishi Electric Corporation; Rockwell Automation, Inc.; Schneider Electric; Siemens AG; Socomec; and Yokogawa Electric Corporation.
Key Players
- ABB
- Eaton
- Emerson Electric Co
- General Electric (GE)
- Honeywell International Inc.
- Mitsubishi Electric Corporation
- MachineQ
- Rockwell Automation, Inc.
- Schneider Electric
- Siemens AG
- Socomec
- Yokogawa Electric Corporation
Industry Developments
- September 2024: MachineQ launched an Internet of Things (IoT)-based power-monitoring offering to enable data centers to manage energy use better, as well as gain operational efficiencies.
- January 2024, Starline, a Legrand sub-brand, introduced the third generation of its Critical Power Monitor portfolio, the M70 CPM. First launched in 2014, the Starline Critical Power Monitor has become the preferred solution for data center busway power monitoring among leading data center operators worldwide.
- September 2023, Sungrow, an energy storage system provider, released an upgraded version of its iSolarCloud App. Developed as an intelligent project management and monitoring platform, iSolarCloud supports full lifecycle management of photovoltaic and energy storage plants, including plant monitoring, data acquisition, and operation and maintenance.
- February 2022: ABB India launched a new series of electrical measuring and power monitoring meters for efficient energy management.
Power Monitoring Market Segmentation
By Component Outlook (Revenue, USD Billion, 2020–2034)
- Hardware
- Software
- Services
By End User Outlook (Revenue, USD Billion, 2020–2034)
- Manufacturing & Process Industry
- Data centers
- Public Infrastructure
- Utilities & Renewables
- Electric Vehicle Charging Station
By Regional Outlook (Revenue, USD Billion, 2020–2034)
- North America
- US
- Canada
- Europe
- Germany
- France
- UK
- Italy
- Spain
- Netherlands
- Russia
- Rest of Europe
- Asia Pacific
- China
- Japan
- India
- Malaysia
- South Korea
- Indonesia
- Australia
- Vietnam
- Rest of Asia Pacific
- Middle East & Africa
- Saudi Arabia
- UAE
- Israel
- South Africa
- Rest of Middle East & Africa
- Latin America
- Mexico
- Brazil
- Argentina
- Rest of Latin America
Power Monitoring Market Report Scope
| Report Attributes | Details |
| Market Size in 2024 | USD 4.89 Billion |
| Market Size in 2025 | USD 5.16 Billion |
| Revenue Forecast by 2034 | USD 8.93 Billion |
| CAGR | 6.28% from 2025 to 2034 |
| Base Year | 2024 |
| Historical Data | 2020–2023 |
| Forecast Period | 2025–2034 |
| Quantitative Units | Revenue in USD Billion and CAGR from 2025 to 2034 |
| Report Coverage | Revenue Forecast, Competitive Landscape, Growth Factors, and Industry Trends |
| Segments Covered |
|
| Regional Scope |
|
| Competitive Landscape |
|
| Report Format |
|
| Customization | Report customization as per your requirements with respect to countries, regions, and segmentation. |
Source: Polaris Market Research Analysis
Power Monitoring Market FAQ's
The global market size was valued at USD 4.89 billion in 2024 and is projected to grow to USD 8.93 billion by 2034.
The global market is projected to register a CAGR of 6.28% during the forecast period.
North America dominated the market share in 2024.
A few of the key players in the market are ABB; Eaton; Emerson Electric Co; General Electric (GE); Honeywell International Inc.; MachineQ; Mitsubishi Electric Corporation; Rockwell Automation, Inc.; Schneider Electric; Siemens AG; Socomec; and Yokogawa Electric Corporation.
The hardware segment dominated the market share in 2024.component, end user and region.
The data centers segment is expected to witness the fastest growth during the forecast period.
Download Sample Report of Power Monitoring Market
Please fill out the form to request a customized copy of the research report.
